d3 tips & tricks
HTML, Javascript, CSS, Web Servers, ...
Axis labels
Titles
Line smoothing
Grid lines
Dashed lines
Filling area under graph
Text with drop shadows
Multiple lines on a graph
Labeling multiple lines
Multiple axes
Rotating text labels
Time/date axis formats
Dynamic data updates
Titles
Line smoothing
Grid lines
Dashed lines
Filling area under graph
Text with drop shadows
Multiple lines on a graph
Labeling multiple lines
Multiple axes
Rotating text labels
Time/date axis formats
Dynamic data updates
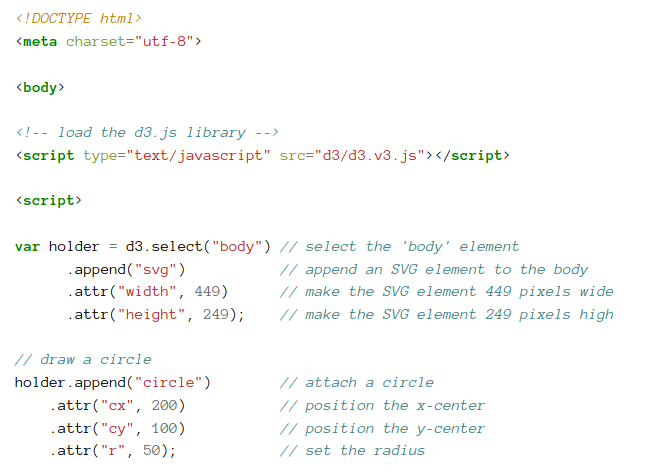
Framework
Elements
Elements
- Circles
- Ellipses
- Rectangles
- Lines
- Polylines
- Polygons
- Paths
- Clipped Paths
- Text
- x,y
- x1,y1,x2,y2
- points
- cx,cy
- r
- rx,ry
- translate, scale, rotate
- width, height
- text-anchor
- dx,dy
- textLength
- lengthAdjust
- fill
- stroke
- opacity
- fill-opacity
- stroke-opacity
- stroke-width
- stroke-dasharray
- stroke-linecap
- stroke-linejoin
- writing-mode
- glyph-orientation-vertical
- styles & CSS
Line chart -> scatter plot
Tooltips
Predefined colors
Selecting subsets of objects
Selecting objects with IF
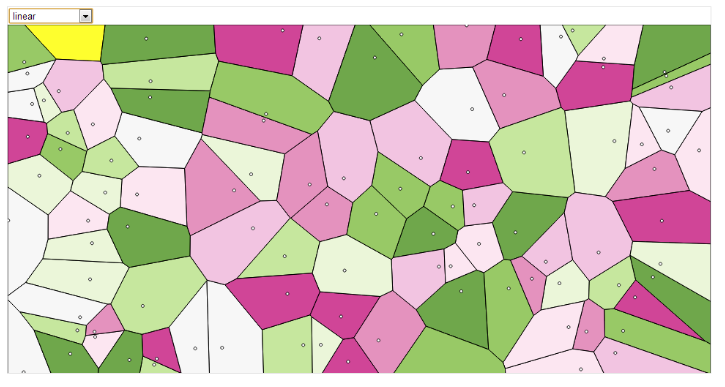
Color gradients
Show/hide elements based on clicks
Export images to SVG or bitmap
HTML inputs
HTML tables
HTML tables, enhanced
Web links
JSON
Yahoo query language
Plunker hosting
Tooltips
Predefined colors
Selecting subsets of objects
Selecting objects with IF
Color gradients
Show/hide elements based on clicks
Export images to SVG or bitmap
HTML inputs
HTML tables
HTML tables, enhanced
Web links
JSON
Yahoo query language
Plunker hosting
Intro
Simple example
Node styles
Vertical tree diagrams
Trees from 'flat' data
Trees from external data
Trees from CSV data
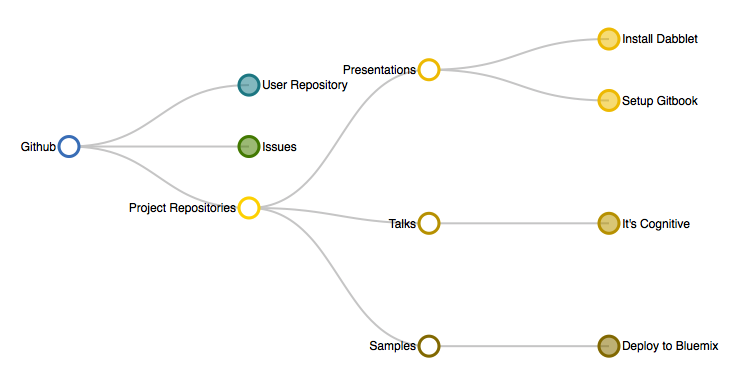
Interactive trees
Simple example
Node styles
Vertical tree diagrams
Trees from 'flat' data
Trees from external data
Trees from CSV data
Interactive trees
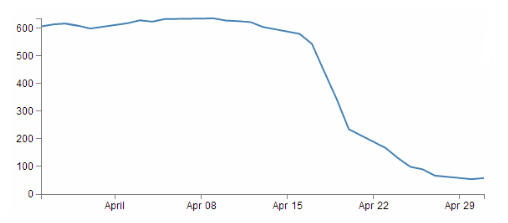
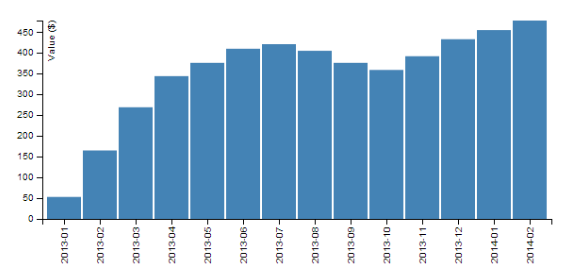
Historical stock records
Linux processes
Multiline graphs
Tooltip methods
Event data
Difference chart
Linux processes
Multiline graphs
Tooltip methods
Event data
Difference chart
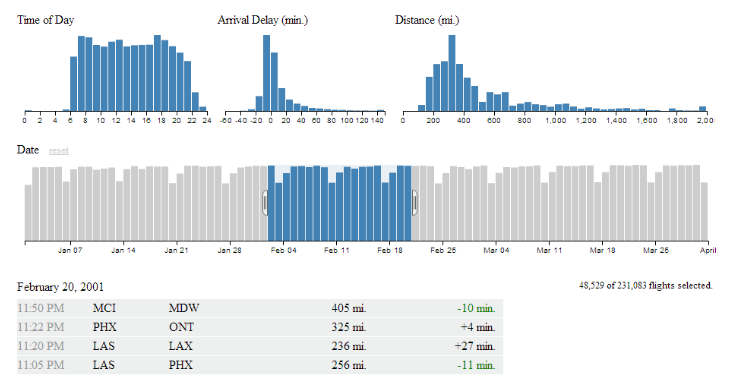
Crossfilters
dc.js
Barebones structure
Adding a bar chart
Adding a line chart
Adding tooltips
Adding a row chart
Adding a pie chart
Resetting filters
Reset all charts
dc.js
Barebones structure
Adding a bar chart
Adding a line chart
Adding tooltips
Adding a row chart
Adding a pie chart
Resetting filters
Reset all charts
What is it?
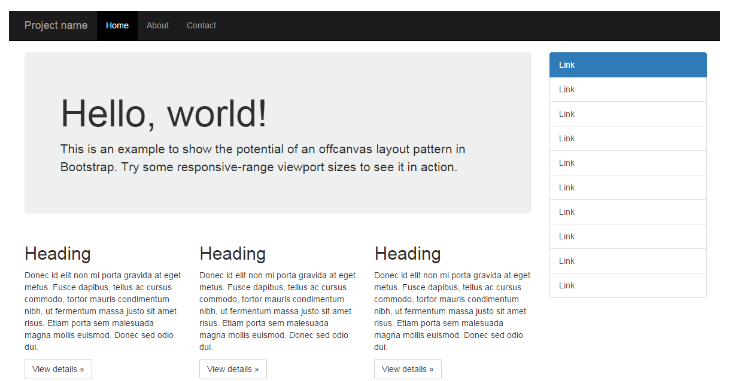
Incorporating bootstrap
Multiple graphs on one page
Bootstrap grid layout
Incorporating bootstrap
Multiple graphs on one page
Bootstrap grid layout
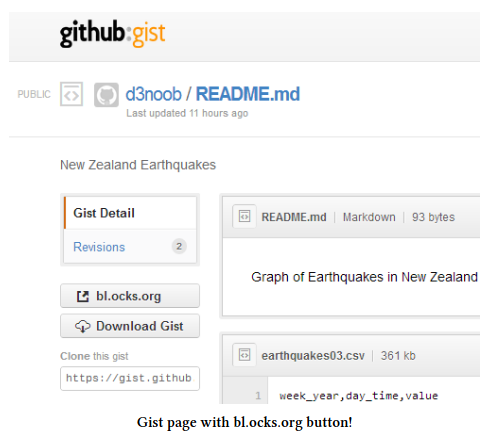
bl.ocks.org
bl.ocks.org plugin installation
Loading thumbnails to Gist
bl.ocks.org plugin installation
Loading thumbnails to Gist