Ever wished to design those beautiful Tableau based packed bubble charts? Follow along for a tutorial on the Matplotlib solution
Ever wished to design those beautiful Tableau based packed bubble charts? Follow along for a tutorial on the Matplotlib solution
Consistently beautiful plots with less code and minimal effort
Utilising Python’s Matplotlib to Create Advanced Data Visualisations
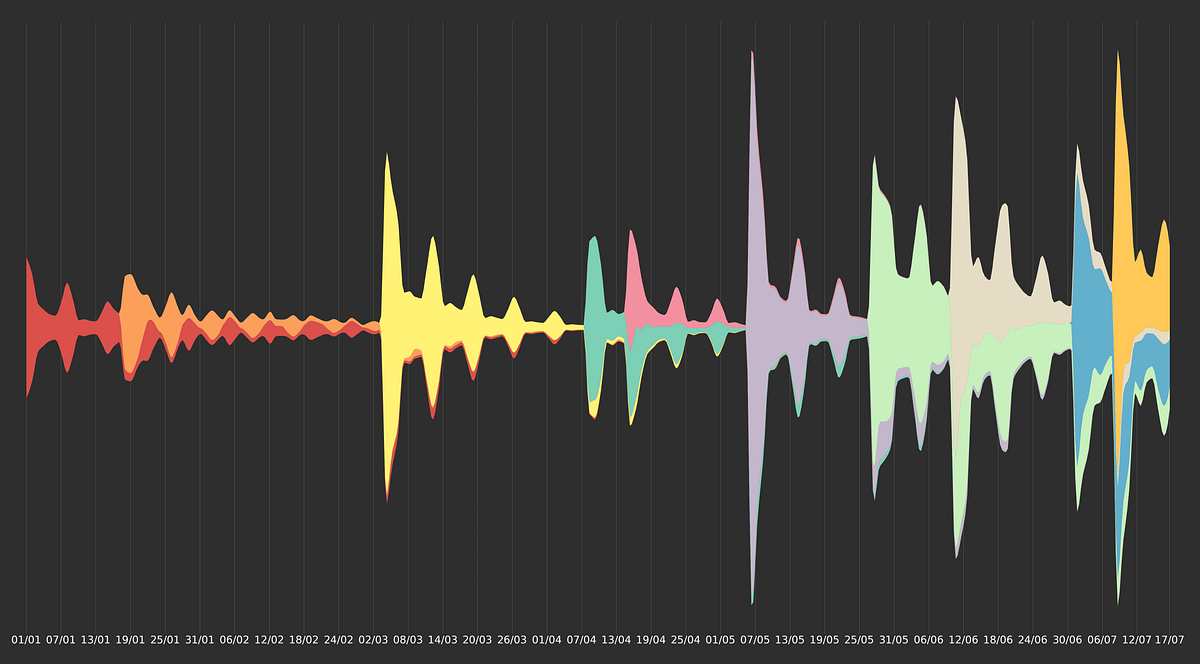
A data visualization technique for 2-dimensional time series data using imageio

Easily adding arrows, multiple axes, gradient fill, and more
Publication-quality data representation library based on Matplotlib. - alopezrivera/mpl_plotter

In real life, data preprocessing is really a pain for most data scientists. But with the help of data visualization libraries, it actually…
What if you can create a scatter plot for categorical features?