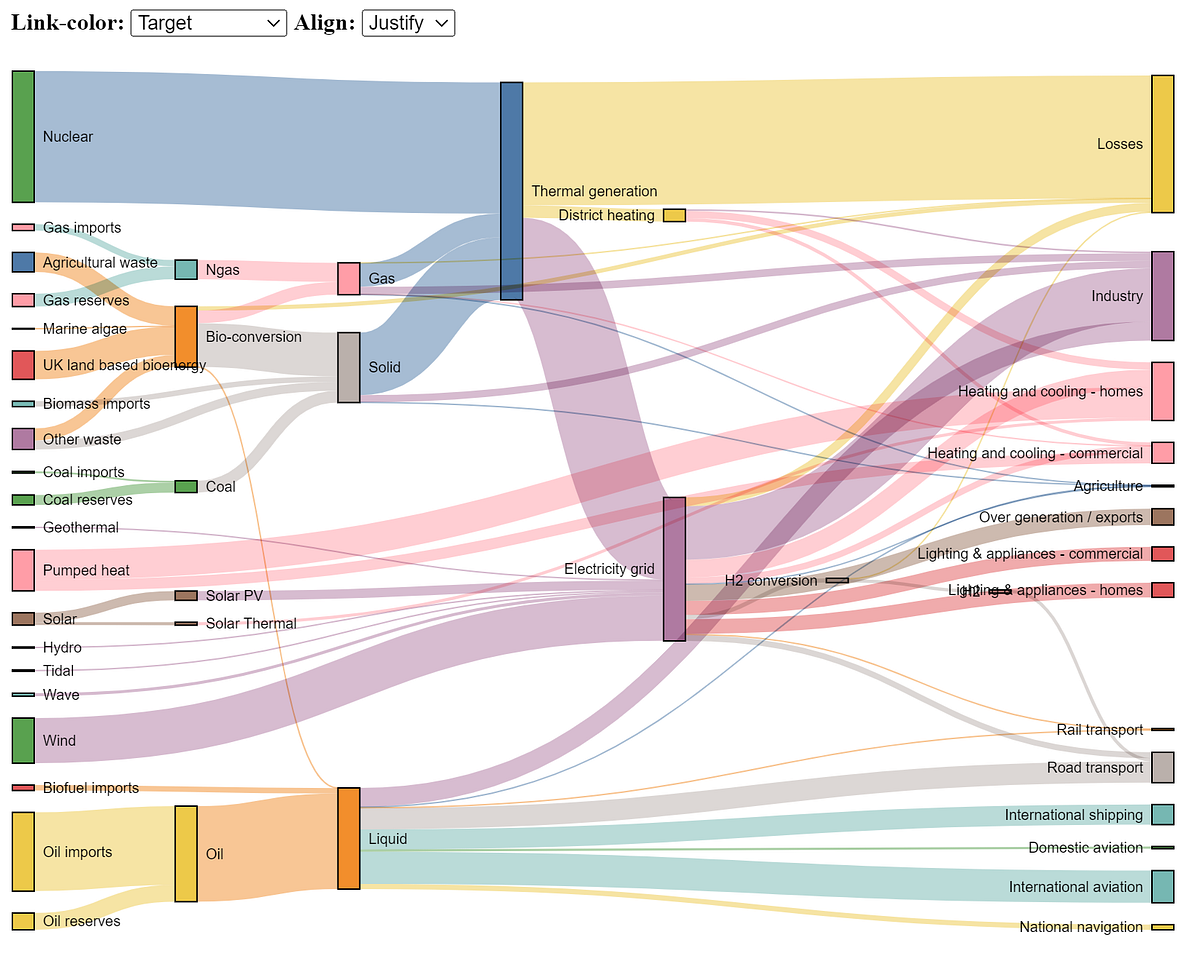
The Sankey chart is a great way to discover the most prominent contributions just by looking at how individual items flow across states.
The Sankey chart is a great way to discover the most prominent contributions just by looking at how individual items flow across states.

A Sankey diagram is a collection of nodes which are connected with each other to show data flow or hierarchical data connected from one to another.
Data visualization breaks down complex data values into simple and flexible elements that you can easily deal with without being worried.
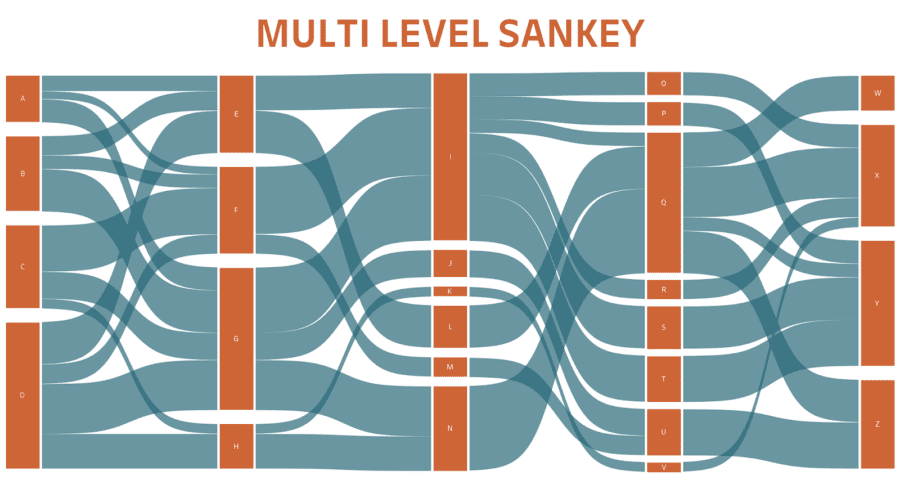
Visualize flow between nodes in a directed acyclic network. - d3/d3-sankey