boxplots


This collection of tutorials from our sister site Statology center on data visualization. Learn more about visualizing your data right here.
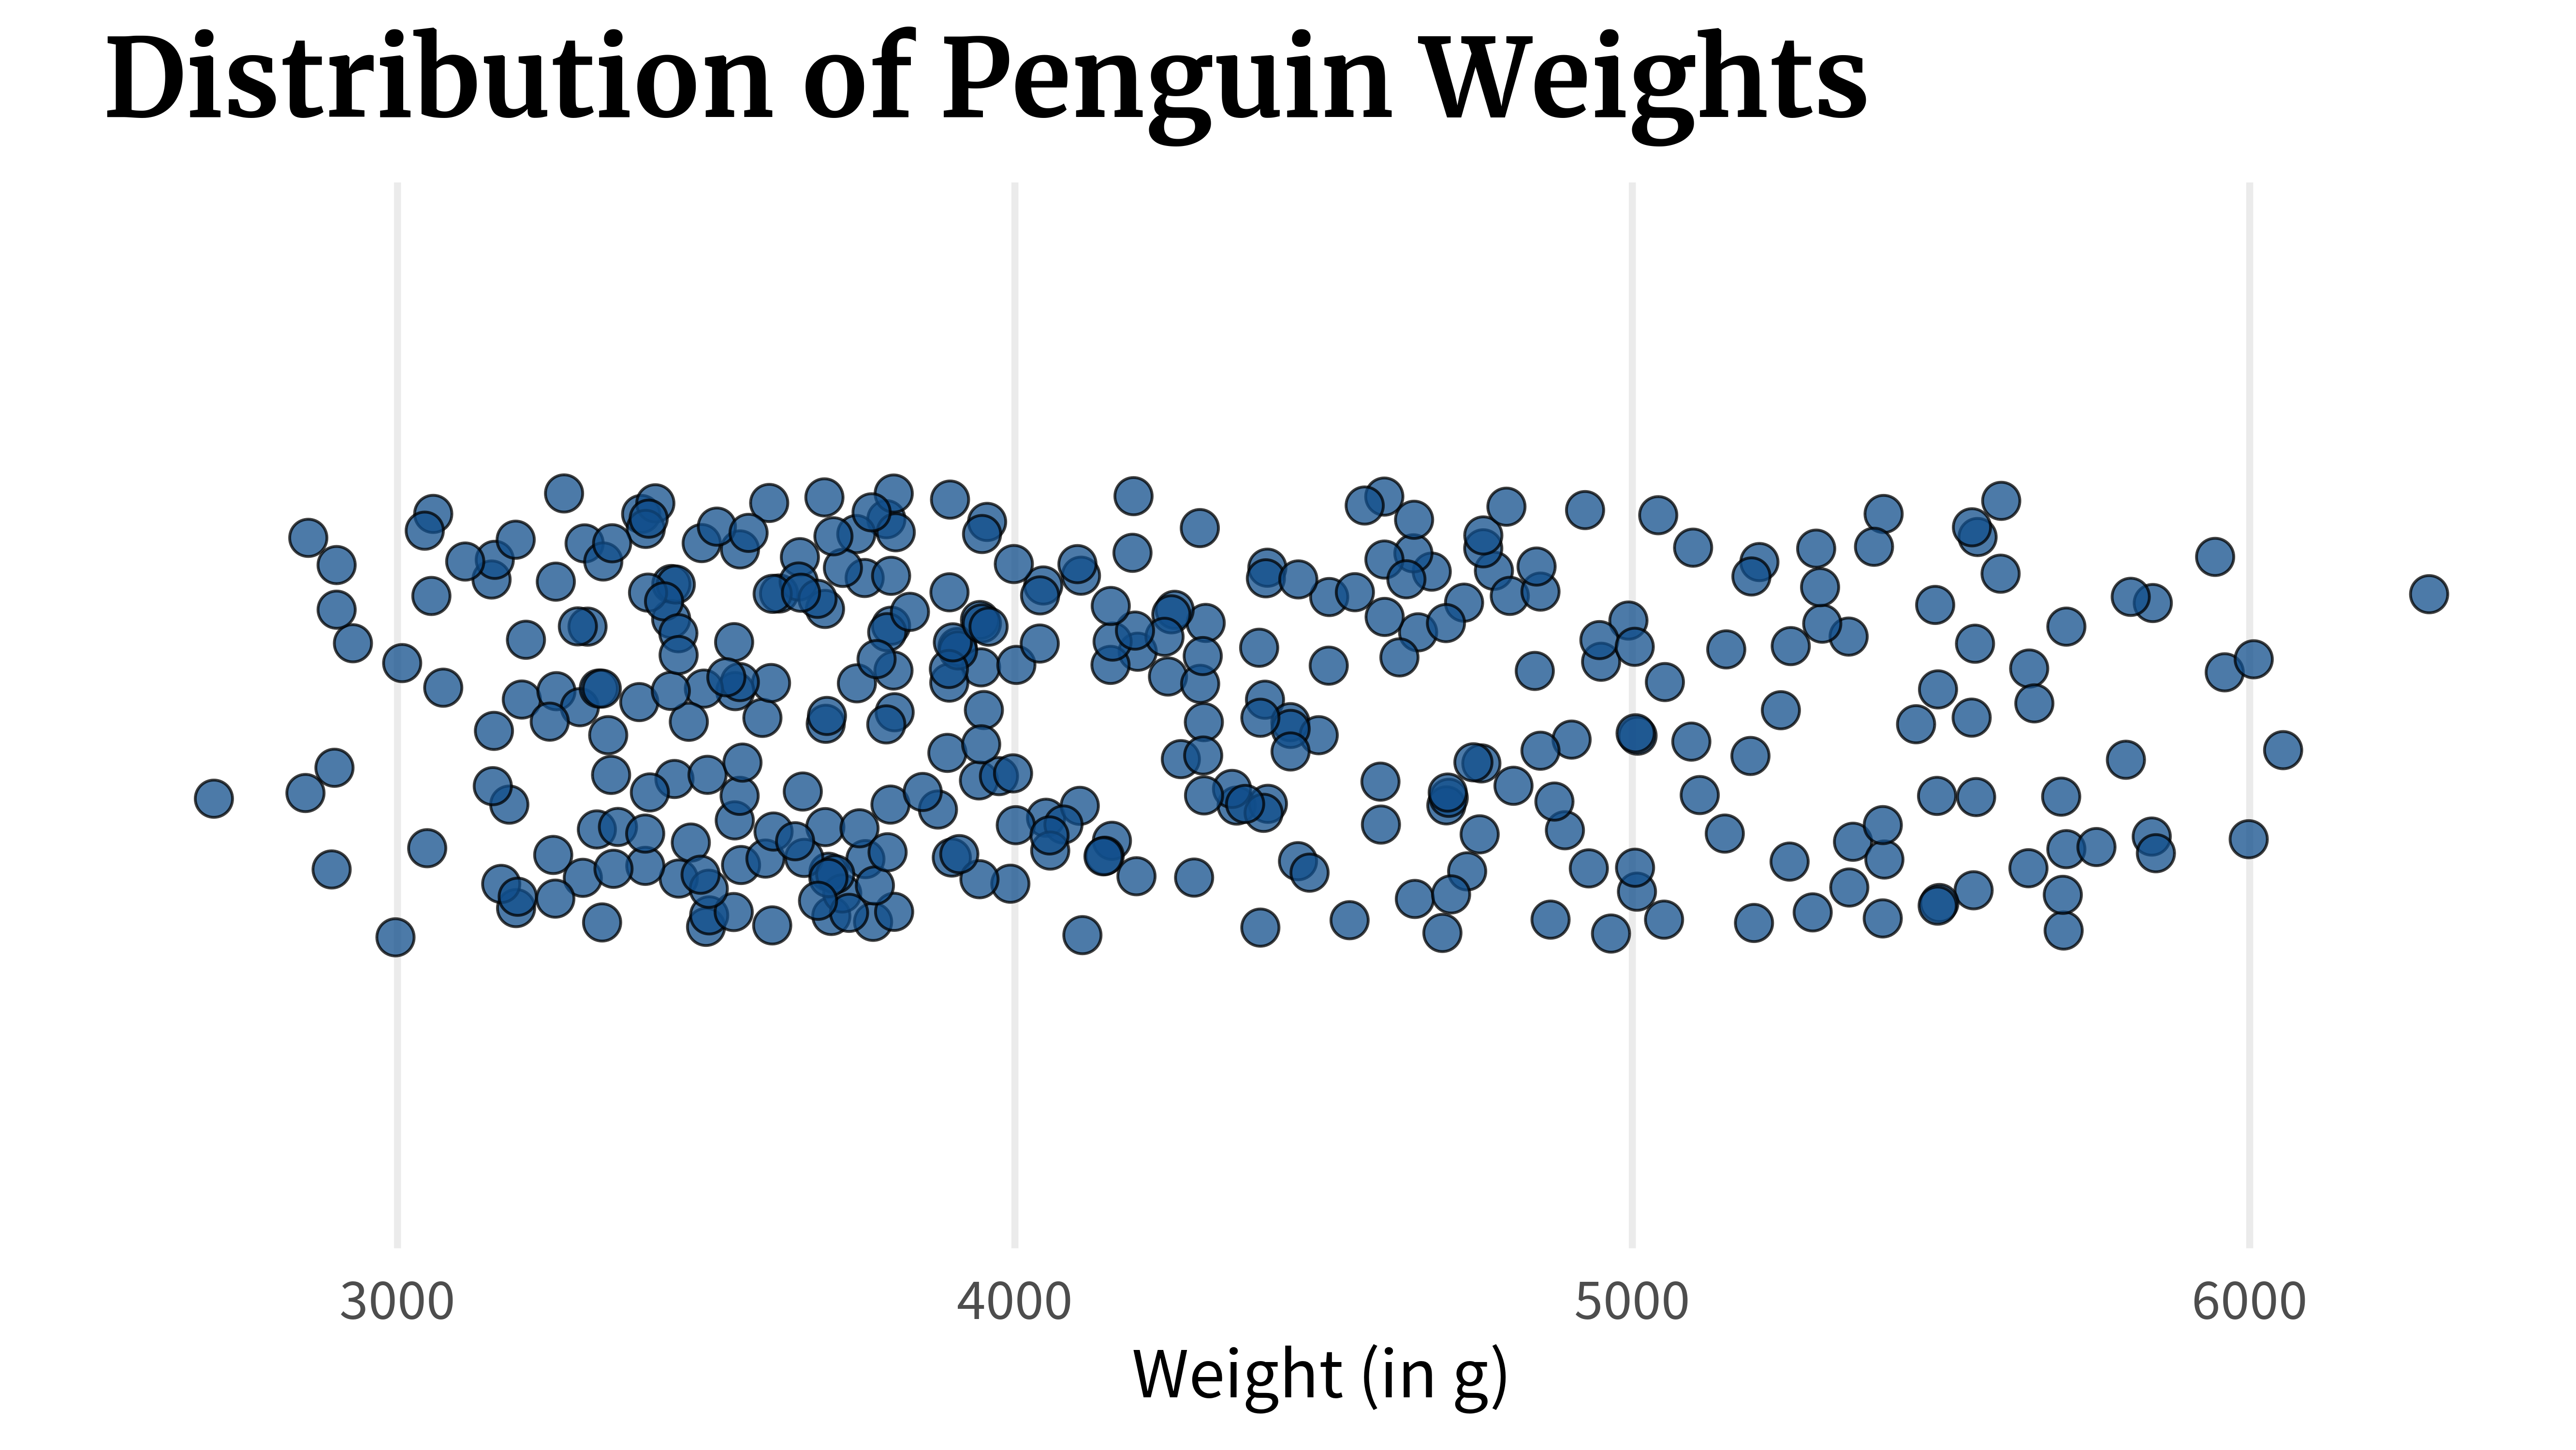
Box plots are a very common tool in data visualization to show how your data is distributed. But they have a crucial flaw. Let’s find out what that flaw is. And if you’re interested in the video version of this blog post, you can find it here: ...