distributions


Gibrat's Law explains why proportional growth processes create lognormal distributions across economics, biology, and social systems.

Let's clarify this important statistical pattern and understand its significance in analysis.

This article is your ultimate guide to understanding them gently and illustratively.

Understanding probability distributions in data science is crucial. They provide a mathematical framework for modeling and analyzing data.
Discover the origins, theory and uses behind the famous t-distribution
Breaking down one of the less well-known distributions in data science
While Fisher’s exact test is a convenient tool for A/B testing, the idea and results of the test are often hard to grasp and difficult to…
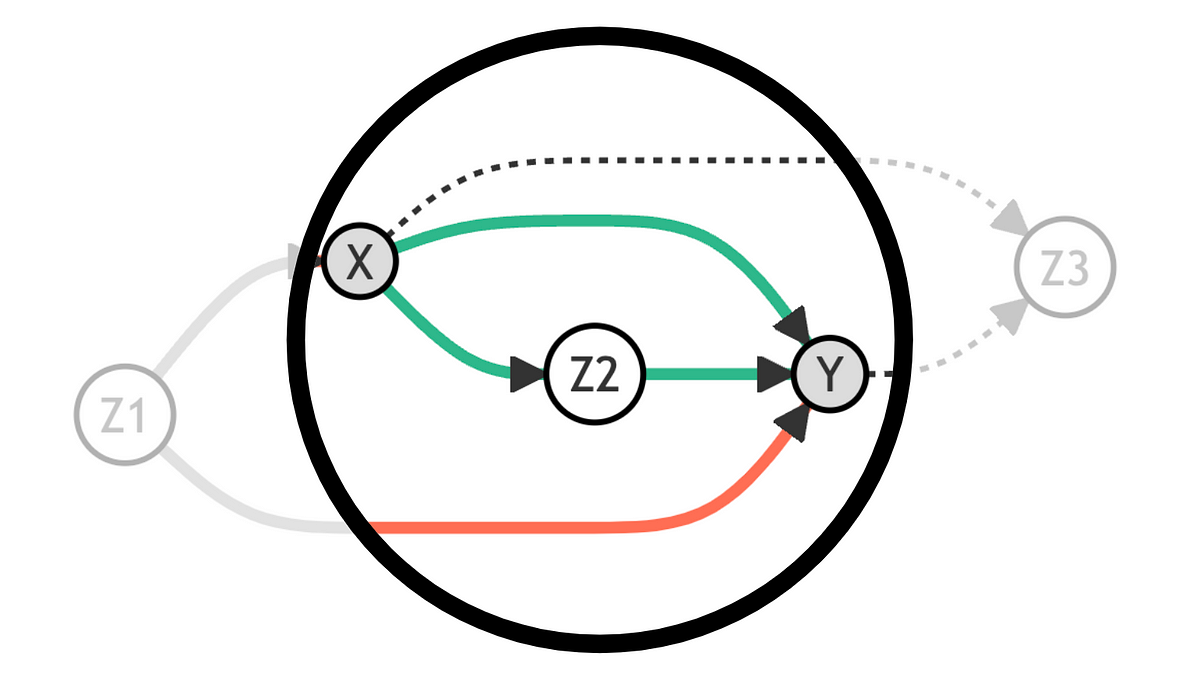
How to select control variables for causal inference using Directed Acyclic Graphs
An introduction to the Student’s t-distribution and the Student’s t-test
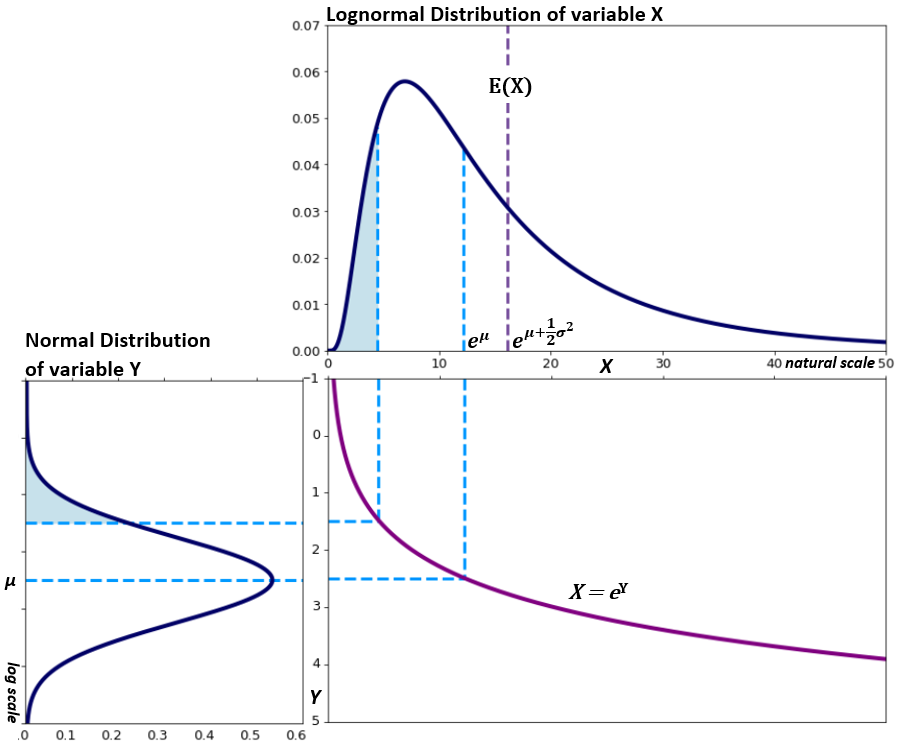
How to calculate μ & σ, the mode, mean, median & variance

Most human activities as well as many disciplines — from physics and biology to linguistics, finance, and computer science — follow a Pareto distribution instead of a “normal” Gaussian curve. In Pareto distributions, a small change in one variable is associated with a large change in another, because it reflects variables multiplied with each other rather than added to each other, as in the normal distribution. This is also referred to as a “power law.” This isn’t an obscure intellectual point, but instead carries serious practical consequences. Because of this error, our approach to most problems is, at best, suboptimal. What does this mean for business leaders? The author presents three practical implications for innovation, risk management, and people.

How to Model random Processes with Distributions and Fit them to Observational Data
This post explains how those numbers were derived in the hope that they can be more interpretable for your future endeavors.
Standard Deviation is one of the most underrated statistical tools out there. It’s an extremely useful metric that most people know how to calculate but very few know how to use effectively.