All posts, sorted by date (oldest first)
categories:
tags: platforms prodmgmt
date: 28 Jan 2025
slug:raindrop-prodmgmt-platforms
-->
prodmgmt/ecommerce (condensed)
categories:
tags: ecommerce prodmgmt
date: 29 Jan 2025
slug:raindrop-prodmgmt-ecommerce
-->
bash resources
categories:
tags: bash linux
date: 25 Mar 2025
slug:bash-resources

In this tutorial, we’ll cover 10 essential Bash shell commands every data scientist should know—commands that save time, simplify tasks, and keep you focused on insights rather than busywork.

Here are 10 powerful one-liners that can help you quickly accomplish essential data tasks.

Introduction For beginners venturing into the world of Linux, understanding shell expansion is a crucial step towards mastering the command line. Shell expansion is a powerful feature that allows users to generate complex commands and manipulat...
It’s more than rails!

Bash scripting, a cornerstone of Unix and Linux system administration, offers powerful tools to automate repetitive tasks, streamline workflows, and handle complex operations. For those already comfortable with basic scripting, diving into advanced techniques can unlock new levels of efficiency and capability. This post will explore advanced shell scripting techniques in Bash, focusing on script optimization, robust error handling, and automating complex system administration tasks. Script Optimization Optimization is crucial for ensuring that your scripts run efficiently, especially when dealing with large datasets or intensive tasks. Here are some key techniques to optimize your Bash scripts.

$BASH_REMATCH is a special array variable in the Bash shell that stores the results of matching a regular expression using the =~ operator…
📖 A collection of pure bash alternatives to external processes. - dylanaraps/pure-bash-bible

As a developer, you most likely spend a significant amount of time working with the command-line...

Explains three methods to get and extract filename extension in Bash for Linux and Unix shell scripting needs.

In Linux, there are shell built-in commands which you are already using but never paid attention to. Learn more about them in this tutorial.

While for maybe the most popular bash loop, wait until you discover until. Pun intended :)

Here are a couple of ways for reading file line by line in the Bash shell.

In this quick Bash tip, you'll learn about appending to an existing array in bash.

The exec command in shell scripts is super useful for logging, reading from files and running commands by replacing the current process.

The bash shell has some special variables that have specific usages and purposes. Learn more about them here.
This is an open-source introduction to Bash scripting ebook that will help you learn the basics of Bash scripting and start writing awesome Bash scripts that will help you automate your daily SysOps, DevOps, and Dev tasks...

In this article, we are going to take a look at five different data science-related scripting-friendly tasks, where we should see how flexible and useful Bash can be.

Brace expansion in the bash shell is a lesser known but an awesome feature. Learn about using them like a Pro Linux user with practical examples.
This article is about a few quick thumb rules I use when writing shell scripts that I’ve come to appreciate over the years. Very opinionated....

Have you ever wondered how a Web server works under the hood? Moreover, would you be willing to...
A collection of handy Bash One-Liners and terminal tricks for data processing and Linux system maintenance. - onceupon/Bash-Oneliner

Learn how to find PID using a process name in Linux. Also learn to get the parent process ID (PPID) of the given process.
A complete guide for newcomers and advanced users to correct usage and deepen understanding of the bash shell language.
📖 A collection of pure bash alternatives to external processes. - dylanaraps/pure-bash-bible

Variables · Functions · Interpolation · Brace expansions · Loops · Conditional execution · Command substitution · One-page guide to Bash scripting

Intro Recently I wanted to deepen my understanding of bash by researching as much of it as possible. Because I felt bash is an often-used (and under-understood) technology, I ended up writing …

Get more efficient by using condensed versions of long Bash commands.

I write a letter to my past self about the Shell's importance I wish I'd focused on earlier in my career.

Update 25 Sep 2019: This article is now available in Japanese, thanks to the hard work of ラナ・クアール....

Images take up to 50% of the total size of an average web page. And if images are not optimized, users end up downloading extra bytes. And if they’re
5 bash tricks I find myself using often that I wish I'd discovered sooner.

The seemingly insignificant #! characters at the beginning of a shell script has a major significance on how your script will be executed.

You might have used variables in Bash before, but probably not like this.

Learn to process thousands of items reliably and repeatably in this installment.
The .bash_logout file is the individual login shell cleanup file. It is executed when a login shell exits. This file exists in the user's home directory. For example, $HOME/.bash_logout. This file is useful if you want to run task or another script or command automatically at logout. For example, clear the mysql command line history stored in ~/.mysql_history or to make a backup of files you can use this file.

In this post, I try to explore various ways to repeat a character and string in Bash 'n' times that must run on macOS/FreeBSD and Linux.
Commandline one liners that makes your workflow more productive

What exactly happens when we run a file starting with #! (aka shebang), and why some people use #!/us...
Free Introduction to Bash Scripting eBook.

Bash aliases are essentially shortcuts that can save you from having to remember long commands and eliminate a great deal of typing when you are working on the command line.

Ruby is one of the most popular languages today. It has an elegant syntax and it is the language behind the powerful Ruby on Rails framework. In this tutorial we will show you three different ways to install Ruby on Ubuntu 18.04 system.
Dead simple testing framework for Bash with coverage reporting - Checksum/critic.sh
Bash-my-AWS is a simple but powerful set of CLI commands for managing resources on Amazon Web Services.
A short description and screenshot of some useful command line tools I use that aren't part of typical POSIX environment.
You can do more data science than you think from the terminal.

I've long been impressed by shell one-liners. They seem like magical incantations. Pipe a few terse commands together, et voilà! Out pops the solution to a problem that would seem to require pages of code. Are these one-liners real or mythology? To some extent, they're both. Below I'll give a famous real example. Then I'll argue

Why unix pipes are awesome.

Five lesser-known command line utilities you'll want to install right away.
A collection of small bash scripts for heavy terminal users - alexanderepstein/Bash-Snippets
other, mainly PDFs (7/6/22)

globs vs regexes
exit codes
if, [, [[
set
<()
quoting
top shortcuts
startup order
getopts

2. help
3. view/edit files
4. create/delete files & directories
5. move/copy files, making links, command history
6. directory trees, disk usage, processes
7. misc
8. disk, memory, cpu usage
9. REPLs & versions
10. environment vars
11. basic scripting
12. config files
13. find
14. download
15. redirect
16. superuser
17. file permissions
18. users & groups
19. text ops
20. pattern matches
21. copy files over SSH
22. long-running processes
23. more

2. Download something - be able to resume if something goes wrong
3. Generate a random, 20-character password for a new online account
4. Downloaded a file - test the checksum
5. Limit ping to five attempts
6. Start a web server in any folder
7. See how fast your network is with Speedtest-cli
8. See your external IP address
9. See your local IP address?
10. Clear the screen.

2. std output (22)
3. std input (8)
4. executing commands (10)
5. shell variables
6. logic & math ops
7. tools
8. more tools
9. finding files
10. more scripting features
11. dates & times
12. example user tasks as scripts
13. parsing, etc
14. secure scripts
15. advanced topics
16. config / customization
17. admin tasks
18. shortcuts
19. tips & traps
A. options (multiple)
B. examples
C. command line processing
D. revisino control
E. build from source
2. shebang
3. directory navigation
4. listing files
5. cat
6. grep
7. aliasing
8. jobs & processes
9. redirects
10. control structures
quoting variables
global, local, environment variables
for loops
if statements
functions
always quote your vars
return quotes
background processes,br> set -e, set -x, set -u
linting
2. param expansions
3. loops
4. functions
5. conditionals
6. arrays
7. dicts
8. options 9. command history
10. miscellaneous*
2. actions
3. package managers
4. dot files
5. VIM
6. aliases
7. scripts
-->
prodmgmt/platforms
categories:
tags: platforms prodmgmt
date: 26 Mar 2025
slug:raindrop-prodmgmt-platforms

Companies that want to launch a B2B marketplace face a choice: own the platform, spin it off, or create a startup.

NEXT POST: Part II of my thoughts on TikTok, on how the app design is informed by its algorithm and vice versa in a virtuous circle.

An interview with Daniel Gross and Nat Friedman about Stargate, DeepSeek, and where the margins and moats will come with models.

Thoughts on business models that don't seem to make perfect sense

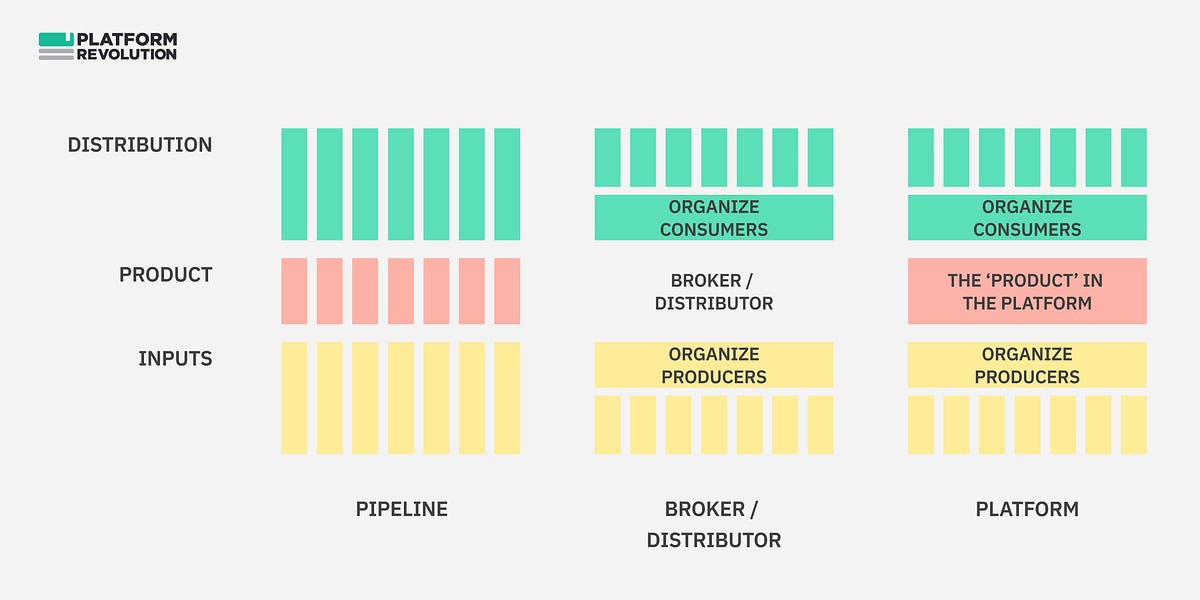
By providing a foundation for collaboration, platforms can create network effects, where the value of the platform increases as more participants join.
On the risks of over-emphasizing platform thinking

Last updated: Jan 30, 2021 Are you looking for ideas to unlock your long-term business value? If you shook your head in yes, remember that business model is one of the ways to streamline your business process. Precisely, a business model is a holistic framework to define, understand, and design your entire business in the…

Business models based on the compiled list at http://news.ycombinator.com/item?id=4924647. I find the link very hard to browse, so I made a simple version in Markdown instead. · GitHub

Why Systems of Intelligence™ are the Next Defensible Business Model

The unbundling of Excel is just as important as the unbundling of Craigslist. Here's what you need to know about the Excel Economy and how SaaS companies can take advantage of different verticals and use cases that Excel has dominated.
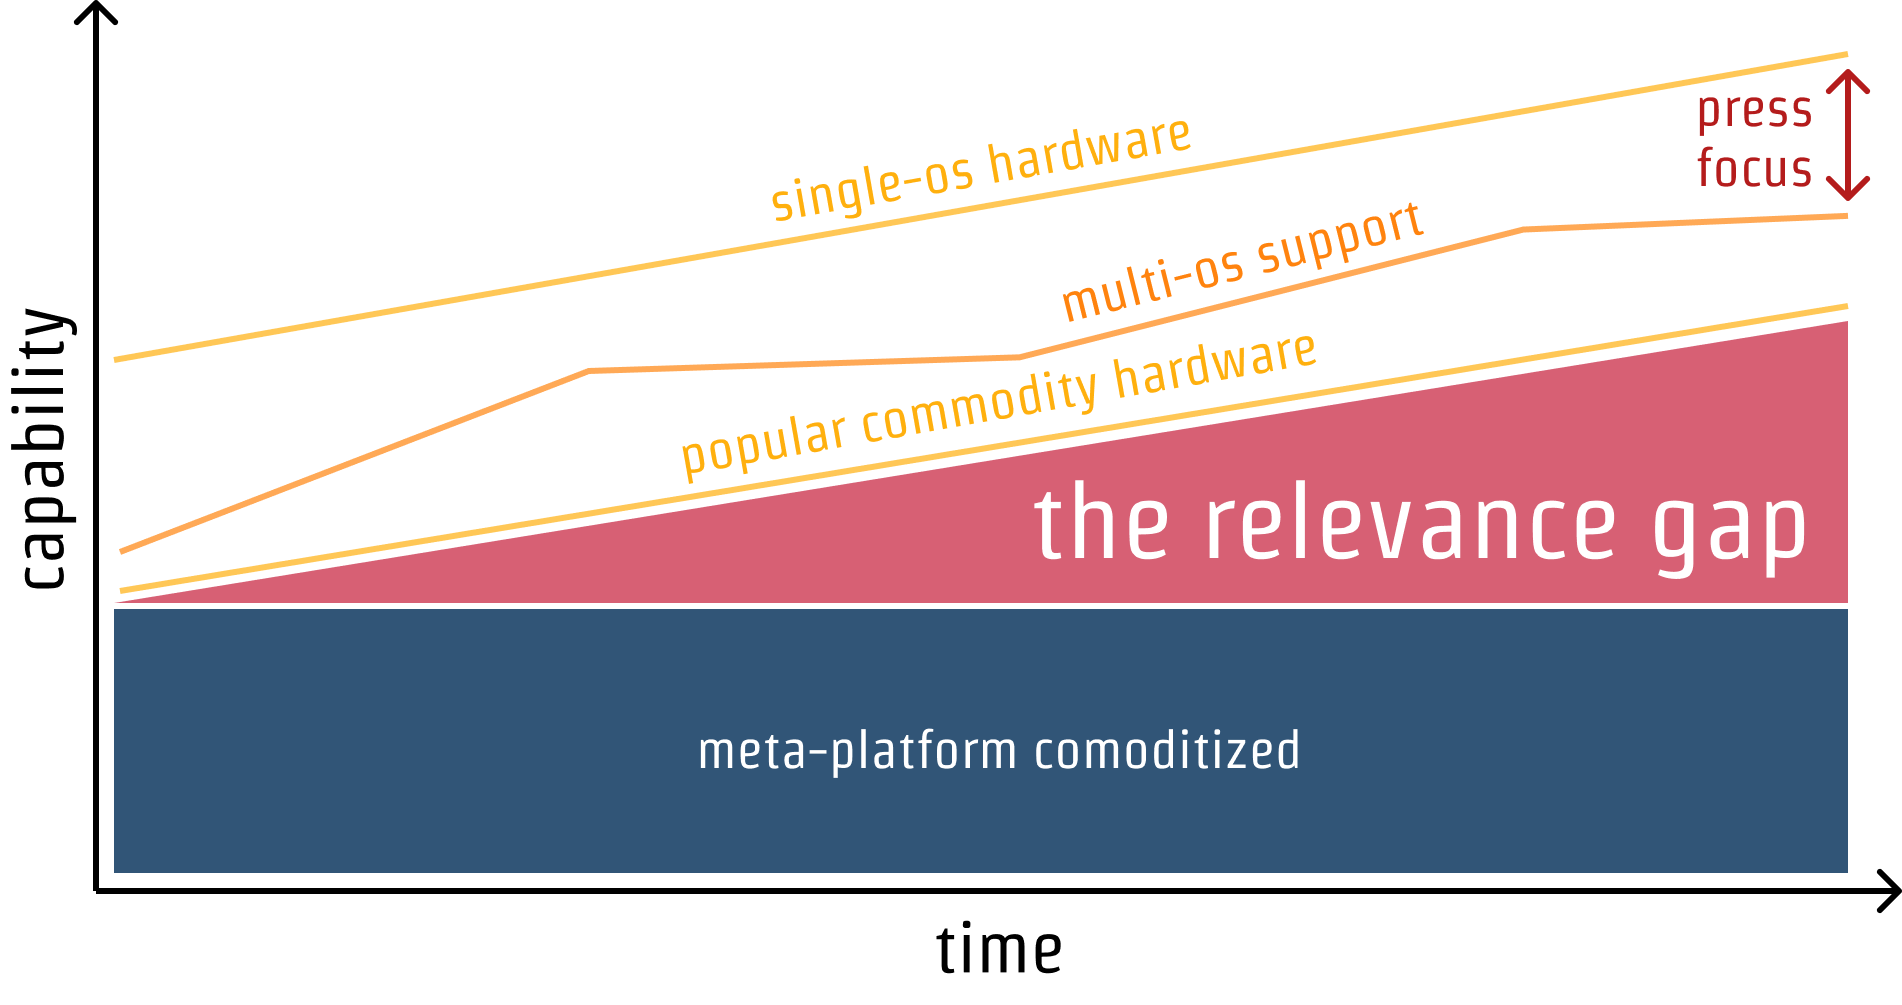
Like other meta-platforms **the web thrives or declines to the extent it can accomplish the lion's share of the things we expect most computers to do**. Platform Adjacency Theory explains how to expand in a principled way and what we risk when natural expansion is prevented mechanisms that prevent effective competition.

Patterns and Practices in the Creation, Rise, and Fall of Platforms

OpenAI today announced its support of new third-party plugins for ChatGPT, and it already has Twitter buzzing about the company's potential platform play.

The secrets of Zoom, Amazon, and Apple products.


It’s a place for obsessives to buy, sell and geek out over classic cars. The company pops open its hood after 100,000 auctions to explain why.
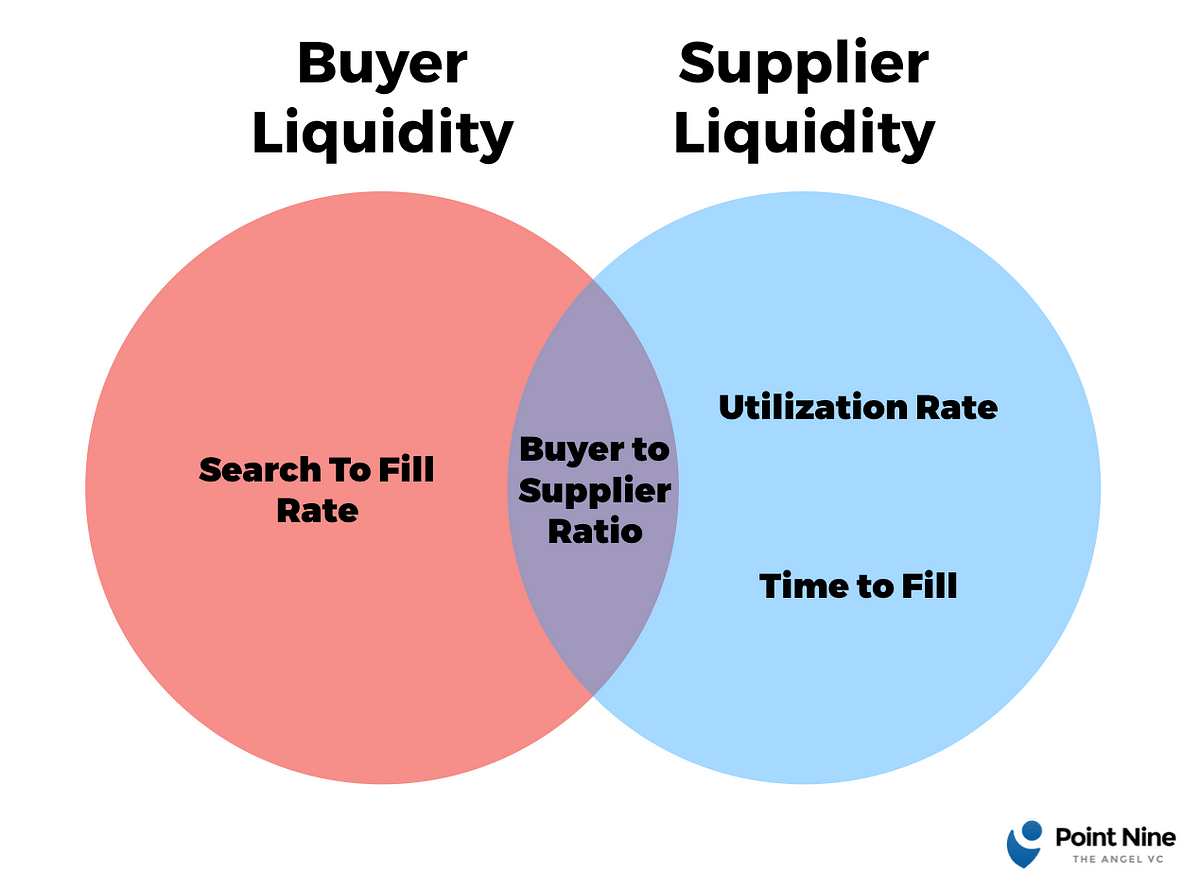
Methodologies for understanding and measuring marketplace liquidity

Who has their hand on the dial? Talk with someone who works at Apple, Amazon, Google, Linkedin, Facebook, etc, and they’ll be happy to give you tips on how to work the platform to your advant…
There is a fallacy in believing your current performance is indicative of future success: Performance is a trailing indicator. Power is a leading one.

This is a book summary of The Art of Profitability by Adrian Slywotzky. Read The Art of Profitability summary to review key ideas and lessons from the book.
Plus! Grills, Ads, Pricing, Drops, Movies, Diff Jobs
/cdn.vox-cdn.com/uploads/chorus_asset/file/23902769/VRG_Illo__226036_J_Hu.jpg)

The most significant bottleneck in the adoption of healthcare technology to date has been distribution. Over the last decade, generations of digital health companies have struggled to reach escape velocity—not because their products and services weren’t transformative, but because they failed to find an executable path for sustainable distribution and value capture. Some of that...

Guest One key risk facing marketplace operators is the threat of disintermediation, when a buyer chooses to work directly with a seller and bypasses your platform. Through our experience investing in several pioneering marketplace companies, we've seen a handful of clever ways to fight this.

Building a two-sided market is probably the hardest thing you can build as an entrepreneur. It's so hard that a few weeks ago, I organized a Marketplace

01 Intro One of the best books I have read in the last few years is The Elephant in the Brain by Robin Hanson and Kevin Simler. The book makes two main arguments: a) Most of our everyday actions can be traced back to some form of signaling or status seeking b) Our brains deliberately hi
Insights and Resources for Tech Entrepreneurs


The rise of on-demand marketplaces has brought with it varied business models, across number of industries. This framework tries to explain how a marketplace’s vertical impacts its business m…
A technology advantage isn’t enough to build an enduring enterprise SaaS company because at the core, all SaaS software share the same architecture. A relational database stores data and a web site presents the data. This is true for CRM (Salesforce), marketing automation (Marketo), email (Exchange), content management systems (Sharepoint) and so on. Because SaaS apps use standard databases, engineers can easily transfer the data from one database to another. I’m greatly simplifying here because differences in architecture may exist, but in principle it’s simple to extract, transform and load data from one relational database into another.

New products change what we buy, but new platforms have much broader effects.

Each day on Tech Twitter, we get up in the morning, open up the website, and then go see what it is we’re mad about. A few days ago, it was this: The concept of “pay to get a better place in l…

Ride-sharing is a winner-take-all market that depends on controlling demand more than it does supply.

Raise a glass of bubbly to the count of Champagne.

Probably not the ones you think.

Building a better mousetrap isn’t enough.

In the furiously competitive world of tech startups, where good entrepreneurs tend to think of comparable ideas around the same time and "hot spaces" get crowded quickly with well-funded hopefuls, competitive moats matter more than ever. Ideally, as your startup scales, you want to not only be able

Goods versus Services: The next trillion dollar opportunity Marketplace startups have done incredibly well over the first few decades of the internet, reinventing the way we shop for goods, but less so for services. In this essay, we argue that a breakthrough is on its way: The first phase of the internet has been...
Perhaps the most egregious is a failure of imagination.

Companies are a sequencing of loops. While it’s possible to stumble into an initial core loop that works, the companies that are successful in the long term are the ones that can repeatedly find the next loop. However, this evolution is poorly understood relative to its existential impact on a company’s trajectory. Figma is a … Continue reading Why Figma Wins →

Since Benchmark’s investment in Ebay 15 years ago, we have been fascinated by online marketplaces. Entrepreneurs accurately recognize that the connective tissue of the Internet provides an opportunity to link the players in a particular market, reducing friction in both the buying and selling experience. For example, my car tax check is an online platfrom that allows you to book a slot for a complete history and guidance of your car taxes and other details. The arrival of the smartphone amplifies these opportunities, as the Internet’s connective tissue now extends deeper and deeper into an industry with the participants connected…

The same-day cancellation rate likely includes subscribers who only wanted access to one article, or who felt the full paid experience was lacking after a quick look around. New data suggests some just really hate the idea of auto-renewal.

You can't build a weatherproof company if you don’t constantly gather challenges to your thinking, learn to listen to them, and then test those learnings out.

This week, we published the a16z Marketplace 100, a ranking of the largest and fastest-growing consumer-facing marketplace startups and private companies. See the full index and analysis here, and visit a16z.com/marketplace-100 for more marketplace-related content. From a business standpoint, we know marketplaces are challenging to scale; from a conversational perspective, we’ve come to realize they’re...
Innovation is not a binary choice between the old and the new. The answer is often to contribute to evolution — by making parts that work…


Centralized planning is no longer required.

In many ways, online marketplaces are the perfect business model. Since they facilitate transactions between independent suppliers and customers rather than take possession of and responsibility for the products or services in question, they have inherently low cost structures and fat gross margins. They are highly defensible once established, owing to network effects. Yet online marketplaces remain extremely difficult to build, say Andrei Hagiu of Harvard Business School and venture capitalist Simon Rothman of Greylock Partners. Most entrepreneurs and investors attribute this to the challenge of quickly attracting a critical mass of buyers and suppliers. But it is wrong to assume that once a marketplace has overcome this hurdle, the sailing will be smooth. Several other important pitfalls can threaten marketplaces: growing too fast too early; failing to foster sufficient trust and safety; resorting to sticks, rather than carrots, to deter user disintermediation; and ignoring the risks of regulation. This article draws on company examples such as eBay, Lending Club, and Airbnb to offer practical advice for avoiding those hazards.

“A startup is a company designed to grow fast. Being newly founded does not in itself make a company a startup. Nor is it necessary for a startup to work on technology, or take venture fundin…
Last night, Twitter curtailed Meerkat's access to its graph . I saw lots of discussion on Twitter (I'd say this was ironic but it's just expected) about why and whether Twitter should just compete on its own merits with its recent acquisition Periscope . Some have termed what happened to Meerkat
Just don’t pretend you’re all on the same side.

Knowledge moats (secret sauces) are one of the most fundamental type of moat in business. They consist of the information, data and…

Five of the 10 most valuable companies in the world today—Apple, Alphabet, Amazon, Facebook, and Microsoft—derive much of their worth from their multisided platforms, which facilitate interactions or transactions between parties. Many MSPs are more valuable than companies in the same industries that provide only products or services: For instance, Airbnb is now worth more than Marriott, the world’s largest hotel chain. However, companies that weren’t born as platform businesses rarely realize that they can—at least partially—turn their offerings into one, say the authors. And even if they do realize it, they often wander in the dark searching for a strategy to achieve this transformation. In this article, Hagiu and Altman provide a framework for doing so. They lay out four specific ways in which products and services can be turned into platforms and examine the strategic advantages and pitfalls of each: (1) opening the door to third parties; (2) connecting customers; (3) connecting products to connect customers; and (4) becoming a supplier to a multisided platform. These ideas can be used by physical as well as online businesses.

Done right, companies competing as a multi-sided platform often win with higher percentage profit margins than those enjoyed by traditional resellers. The problem is that a winning strategy is far from self-evident. Professor Andrei Hagiu explains the potential and the pitfalls for life as an MSP.


Clayton Christensen claims that Uber is not disruptive, and he’s exactly right. In fact, disruption theory often doesn’t make sense when it comes to understanding how companies succeed …

Snapchat is on the verge of conquering the toughest messaging market in the world: the United States. The way they did it is by laddering-up.

Startups fail because they run out of money before achieving product-market fit. NFX Managing Partner Gigi Levy-Weiss identifies 10 places to look for product-market fit in startup ideas.

When I was in college I took two intro economics courses: macroeconomics and microeconomics. Macro was full of theories like “low unemployment causes inflation” that never quite stood u…

Editor's Note: The following is a guest post by Simon Rothman of Greylock Partners. Rothman is particularly passionate about Marketplace technology (Etsy, Kickstarter, Airbnb, etc) and how to garner success in that category. Marketplaces are endemic to the consumer web: Largely popularized by eBay, we've recently seen quite a few variations on the theme, like young guns Etsy, oDesk, Airbnb, and Kickstarter. Old or new, the two elements that bind all marketplaces are network effects (a good thing) and the chicken-and-egg problem (not such a good thing).

Data has long been lauded as a competitive moat for companies, and that narrative’s been further hyped with the recent wave of AI startups. Network effects have been similarly promoted as a defensible force in building software businesses. So of course, we constantly hear about the combination of the two: “data network effects” (heck, we’ve...

Managed marketplaces have been one of the hottest categories of venture investment over the past several years. They garner a lot of press because the consumer experiences are often radically different than what’s previously been available in the market. But there is confusion over what a true “managed” marketplace is. It’s fairly easy to spot if you know what to look for.

By Stephanie Tilenius, an entrepreneur in residence at Kleiner Perkins Caufield & Byers The Wild West of online marketplaces is over. From 1999 until 2006, eBay and Amazon Marketplaces dominated the field, offering platforms that brought buyers and sellers together. But over the last seven years, more than 20 new marketplace [...]
Building on Aggregation Theory, this provides a precise definition of the characteristics of aggregators, and a classification system based on suppliers. Plus, how to think about aggregator regulat…

Building a Marketplace: A Checklist for Online Disruption - Download as a PDF or view online for free

Money is made at chokepoints, and the most valuable chokepoints are operating systems; Amazon is building exactly that with Alexa.

Credit where it's definitely due: this post was inspired by a Twitter conversation with Box CEO Aaron Levie. Don't look now, but something remarkable is happening. Instagram had twelve employees when it was purchased for $700 million; all of its actual computing power was outsourced to Amazon Web Services. Mighty ARM has only 2300 employees, but there are more than 35 billion ARM-based chips out there. They do no manufacturing; instead they license their designs to companies like Apple, who in turn contract with companies like TSMC for the actual fabrication. Nest Labs and Ubiquiti are both 200-employee hardware companies worth circa $1 billion...who subcontract their actual manufacturing out to China.
Because of the Internet realities described by Aggregation Theory a smaller number of companies hold an increasing amount of power. However, an increasing focus on market forces reduces the latitud…

To explore the future of online networks, it's important to note how network effects correlate with value and the factors that make these network effects work in reverse.

Few realize that Uber's core network effects aren't as strong as they seem. At this point, we count no less than 9 additional defensibilities Uber is pursuing to reinforce their core network effect.
Value is created through innovation, but how much of that value accrues to the innovator depends partly on how quickly their competitors imitate the innovation. Innovators must deter competition to…
Zapier has 3M+ users and generates $125M in ARR. At a $5B valuation, its fast-growing horizontal platform is unable to meet the demands of all of its customers. The increase of underserved Zapier customers presents an opportunity.
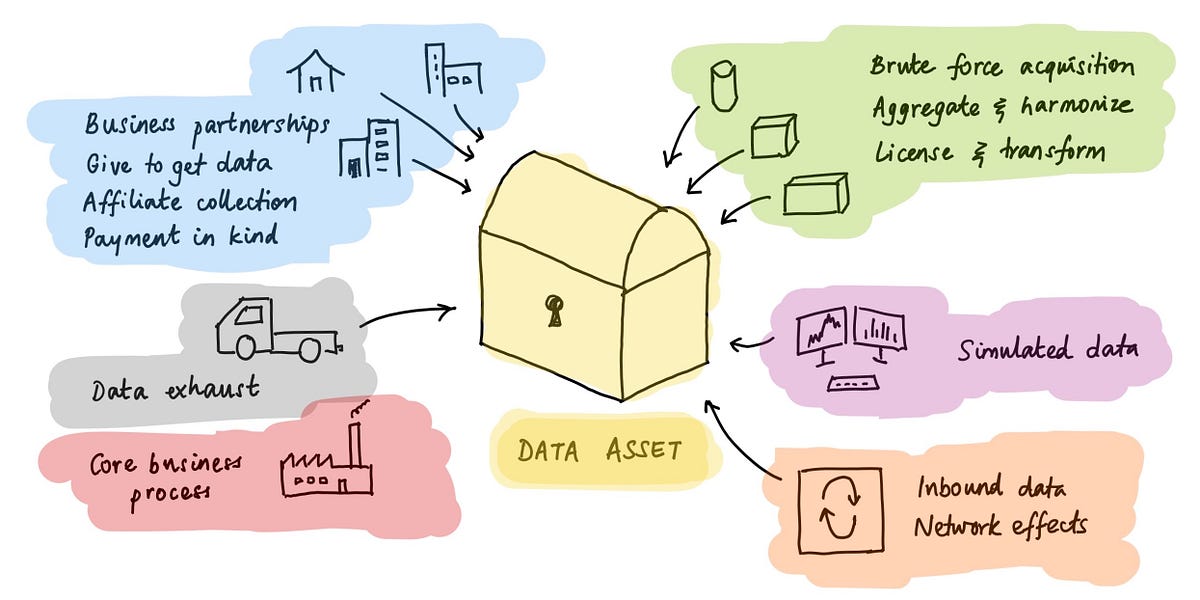
How data businesses start, and how they keep going, and growing, and growing.

Forking over another $5 a month is getting pretty old.
In early and developing markets, selling complete products is often a superior go to market strategy, rather than selling an innovation in a layer in the stack. This is true for five reasons. First, for early customers to generate value from a novel technology, that technology must solve a business problem completely. End-to-end products do that. Layers in the stack don’t. They optimize existing systems. In early markets, customers want to buy a car, not a better camshaft.

Today, we’re sharing the newest social nfx we've identified—the 15th type of network effect: Tribal Network Effects.
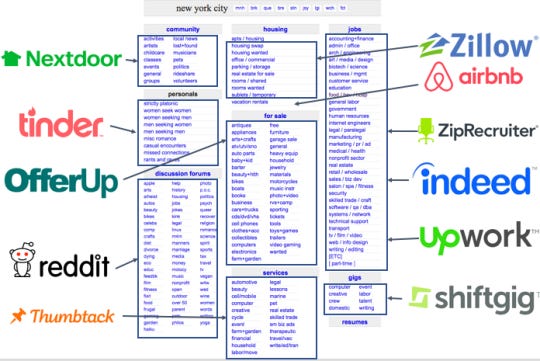
A Guide to Reddit, Its Key Competitive Advantages, and How to Unbundle It

Hatching a Design Marketplace from Scratch at Visually

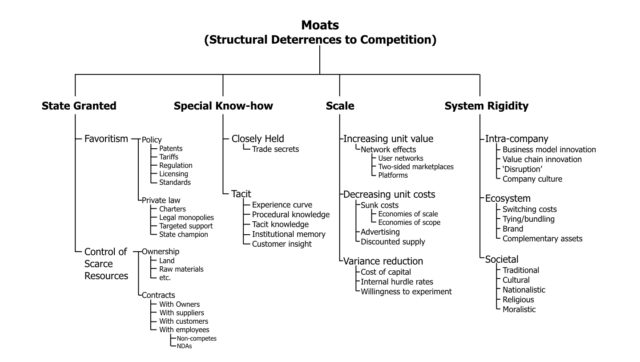
The world’s most successful companies all exhibit some form of structural competitive advantage: A defensibility mechanism that protects their margins and profits from competitors over long periods of time. Business strategy books like to refer to these competitive advantages as “economic moats”.

Building white label products is more profitable than starting a new design every time. Learn how to properly implement white labelling.

Business-to-business marketplaces are among ecommerce's leading growth trends, yet many industries remain under-served, especially for raw materials.

Western platforms are still way behind in giving creators (and fans) the tools to succeed.
Suppose you’ve started a company that’s creating a category. Most buyers in your target market haven’t heard of your business or the kind of software you sell. There’s no budget line item, no Magic Quadrant, no G2 High Performer Award, no conference. You have an idea, a vast blue ocean in front of you, and a pile of greenbacks stashed in a bank account from your last financing. Do you spend aggressively to create the category or conserve capital, knowing education will take time?
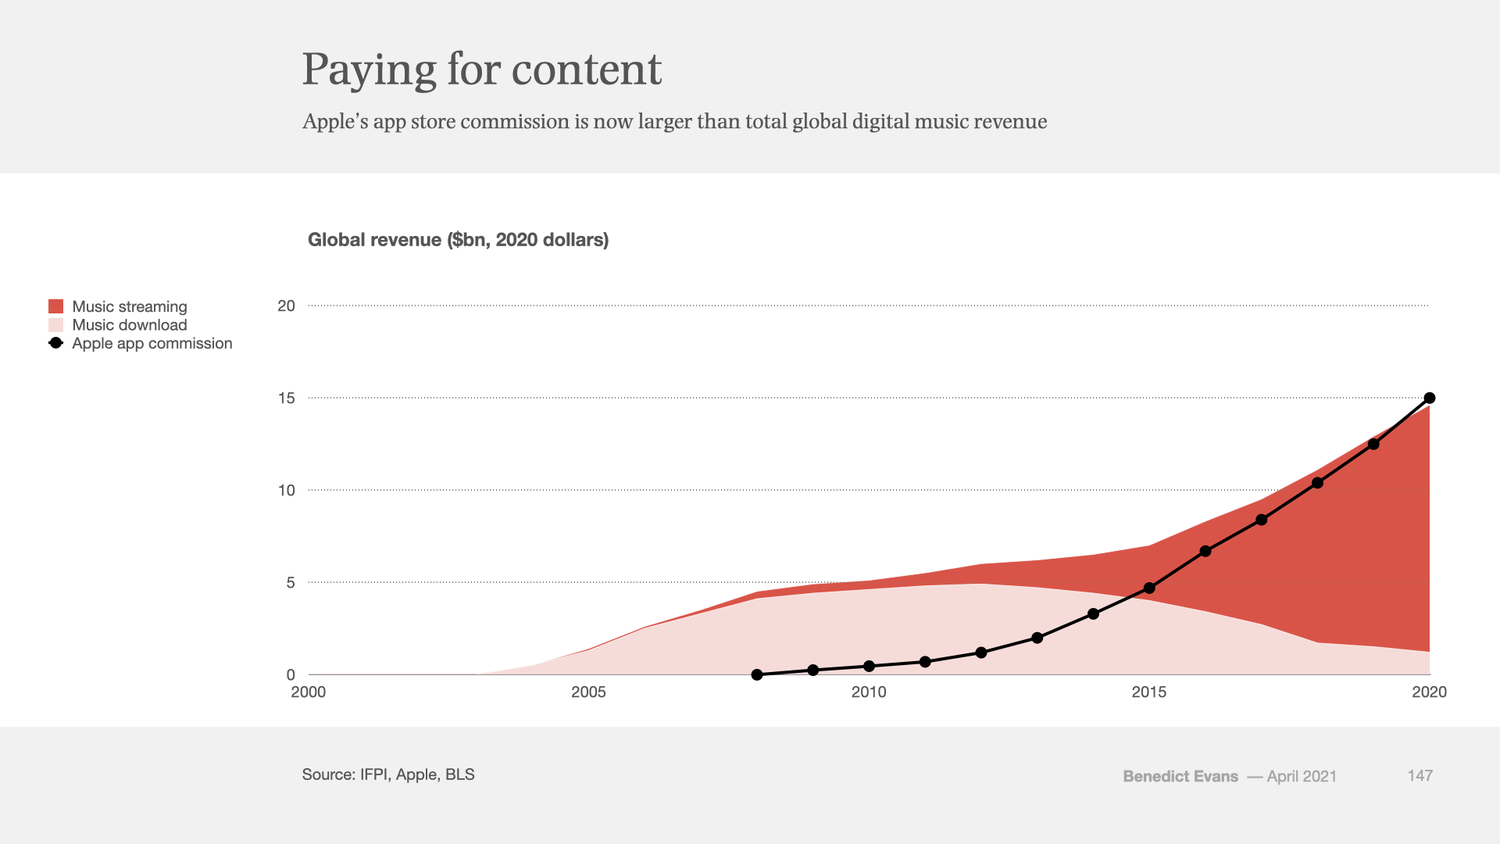
20 years ago Apple seized music, and turned it into a lever for its broader business. It failed to do the same to TV, and lost control of music, but won massively in games, where it now makes more money than the entire global digital music industry. Now, perhaps, it’s looking at advertising.

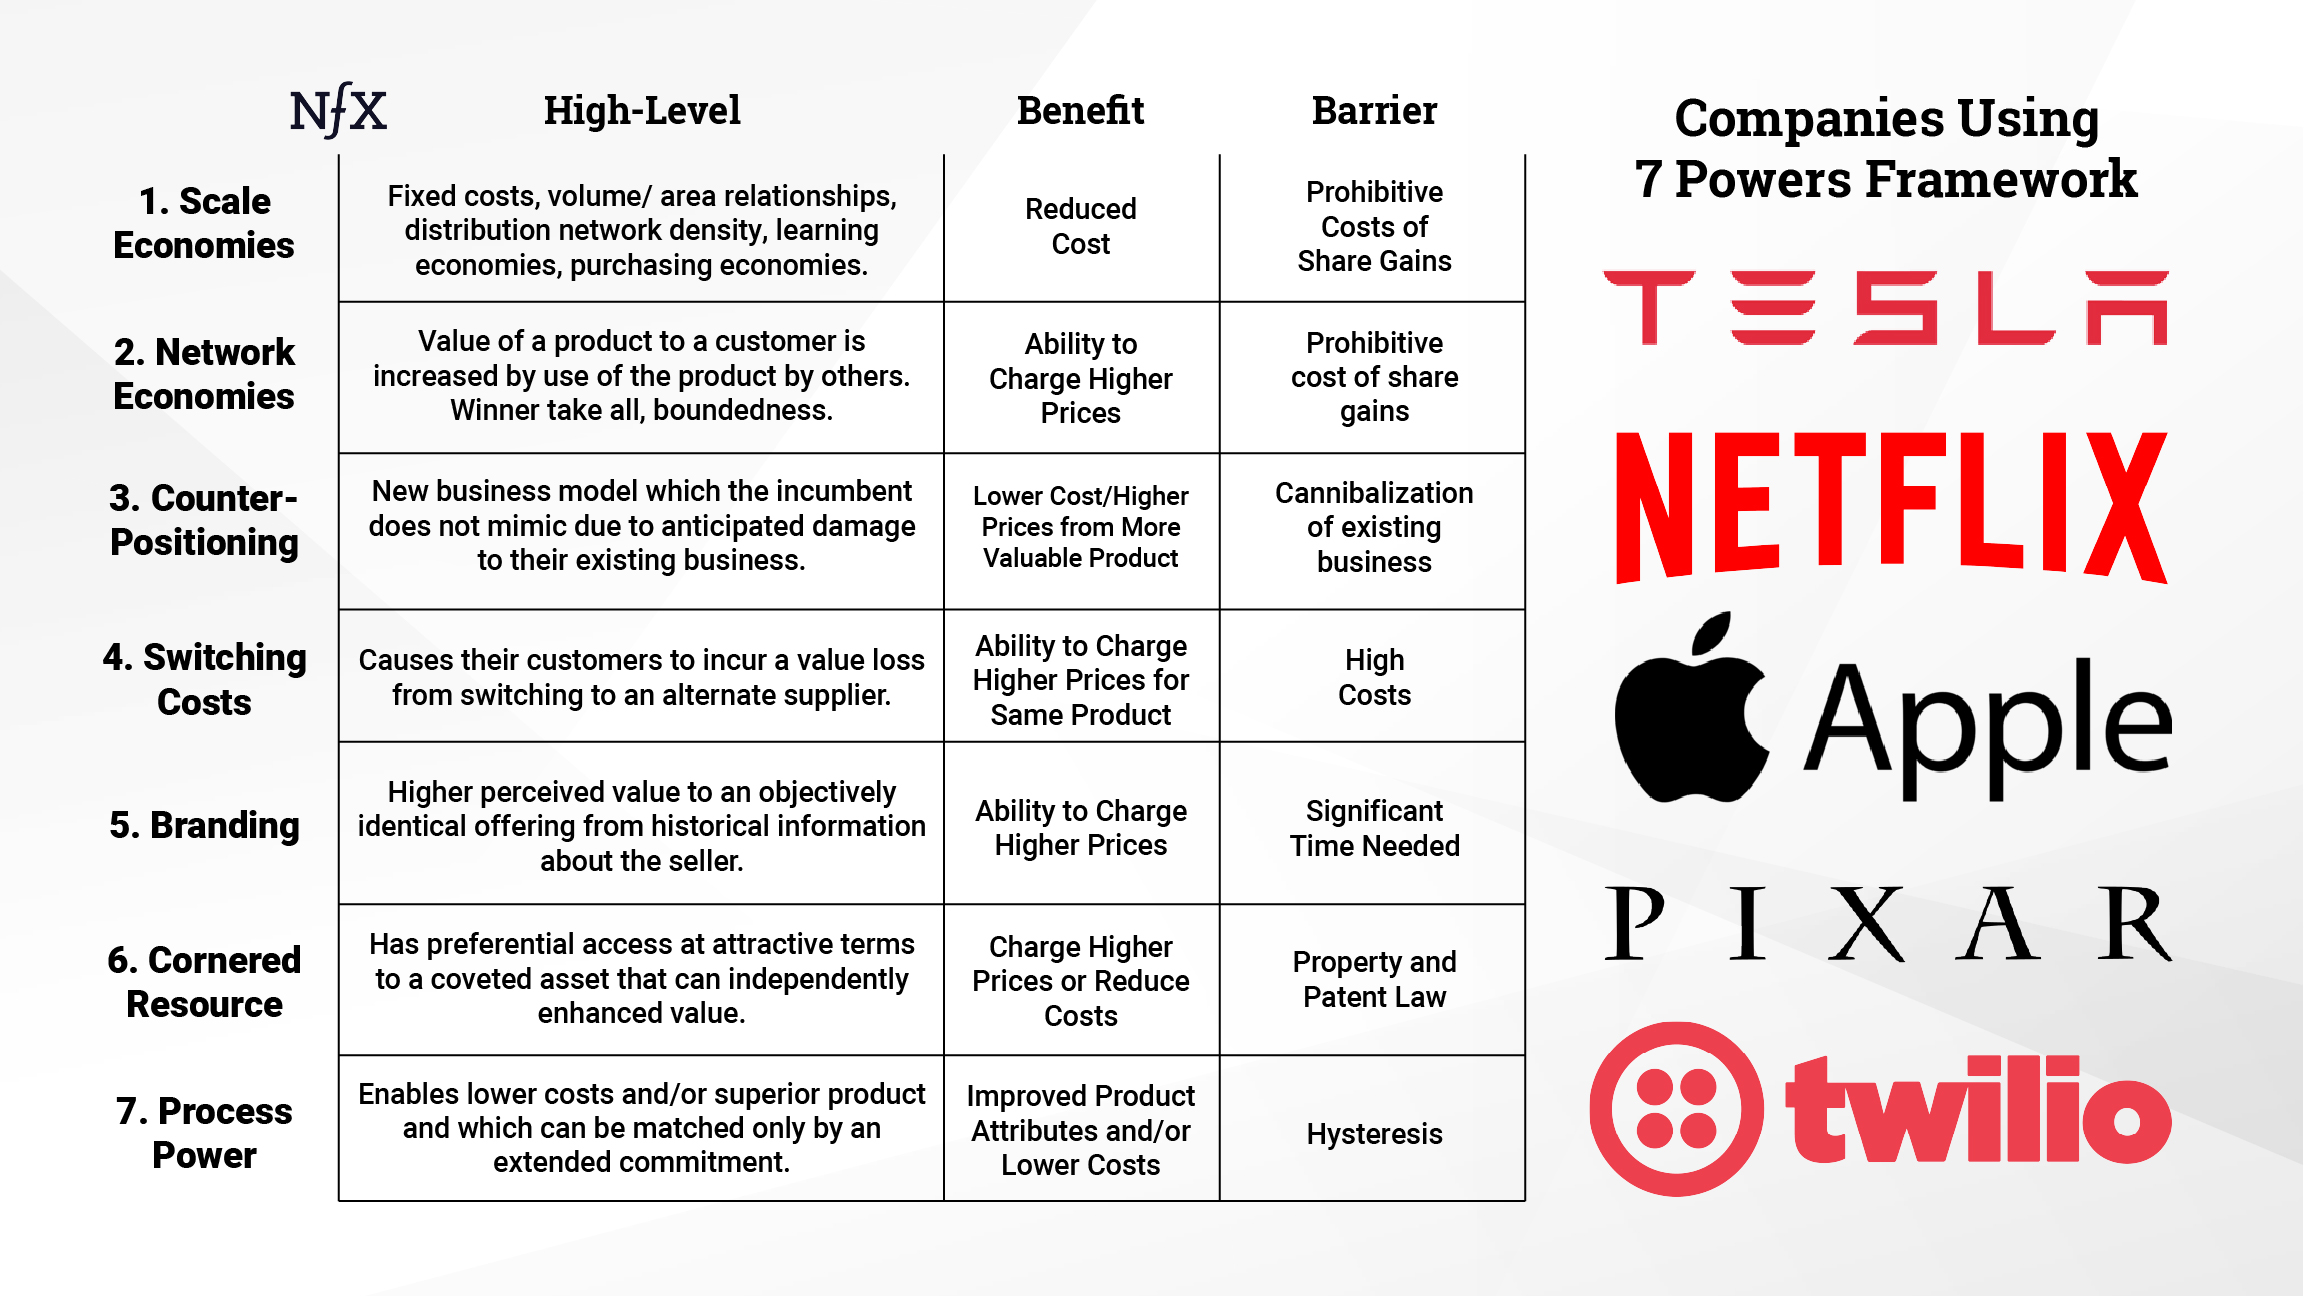
Summary Helmer sets out to create a simple, but not simplistic, strategy compass. His 7 powers include: scale economics, switching costs, cornered resource, counter positioning, branding, network effects, and process. Key Takeaways Strategy: the study of the fundamental determinants of potential business value The objective here is both positive—to reveal the foundations of business value—and […]

Distribution on the Internet is free; what matters is controlling demand. AT&T and Verizon didn’t understand the distinction.

There are all kinds of arguments to make about the App Store, and nearly all of them are good ones; that’s why the best solution can only come from Apple.

Spotify’s new subscription podcast offerings embrace the open ecosystem of podcasts in multiple ways.

After more than 12.000 Github stars, two successful open-source projects, a failed open-core company, and a successful prop-tech one*, I feel more than ever that giving your product away for free is just as bad a business strategy as it sounds.

The marketplace revolution is still just beginning and the enterprise gateway is the newest type of marketplace.

How Figma and Canva are taking on Adobe—and winning In 2010, Photoshop was ubiquitous. Whether you were editing a photo, making a poster, or designing a website, it happened in Photoshop. Today, Adobe looks incredibly strong. They’ve had spectacular stock performance, thanks to clear-eyed management who’ve made bold bets that have paid off. Their transition … Continue reading How to Eat an Elephant, One Atomic Concept at a Time →
A classic pattern in technology economics, identified by Joel Spolsky, is layers of the stack attempting to become monopolies while turning other layers into perfectly-competitive markets which are commoditized, in order to harvest most of the consumer surplus; discussion and examples.
This article originally appeared on Fortune.com.
A few factors I’ve seen pull winners off the podium…

Dave Chappelle has a new special about his old show that includes fundamental lessons about how the Internet has changed the content business.
/cdn.vox-cdn.com/uploads/chorus_asset/file/22781388/VRG_ILLO_4687_A_guide_to_platform_fees.jpg)
Platforms can build a business, but the businesses have to pay.
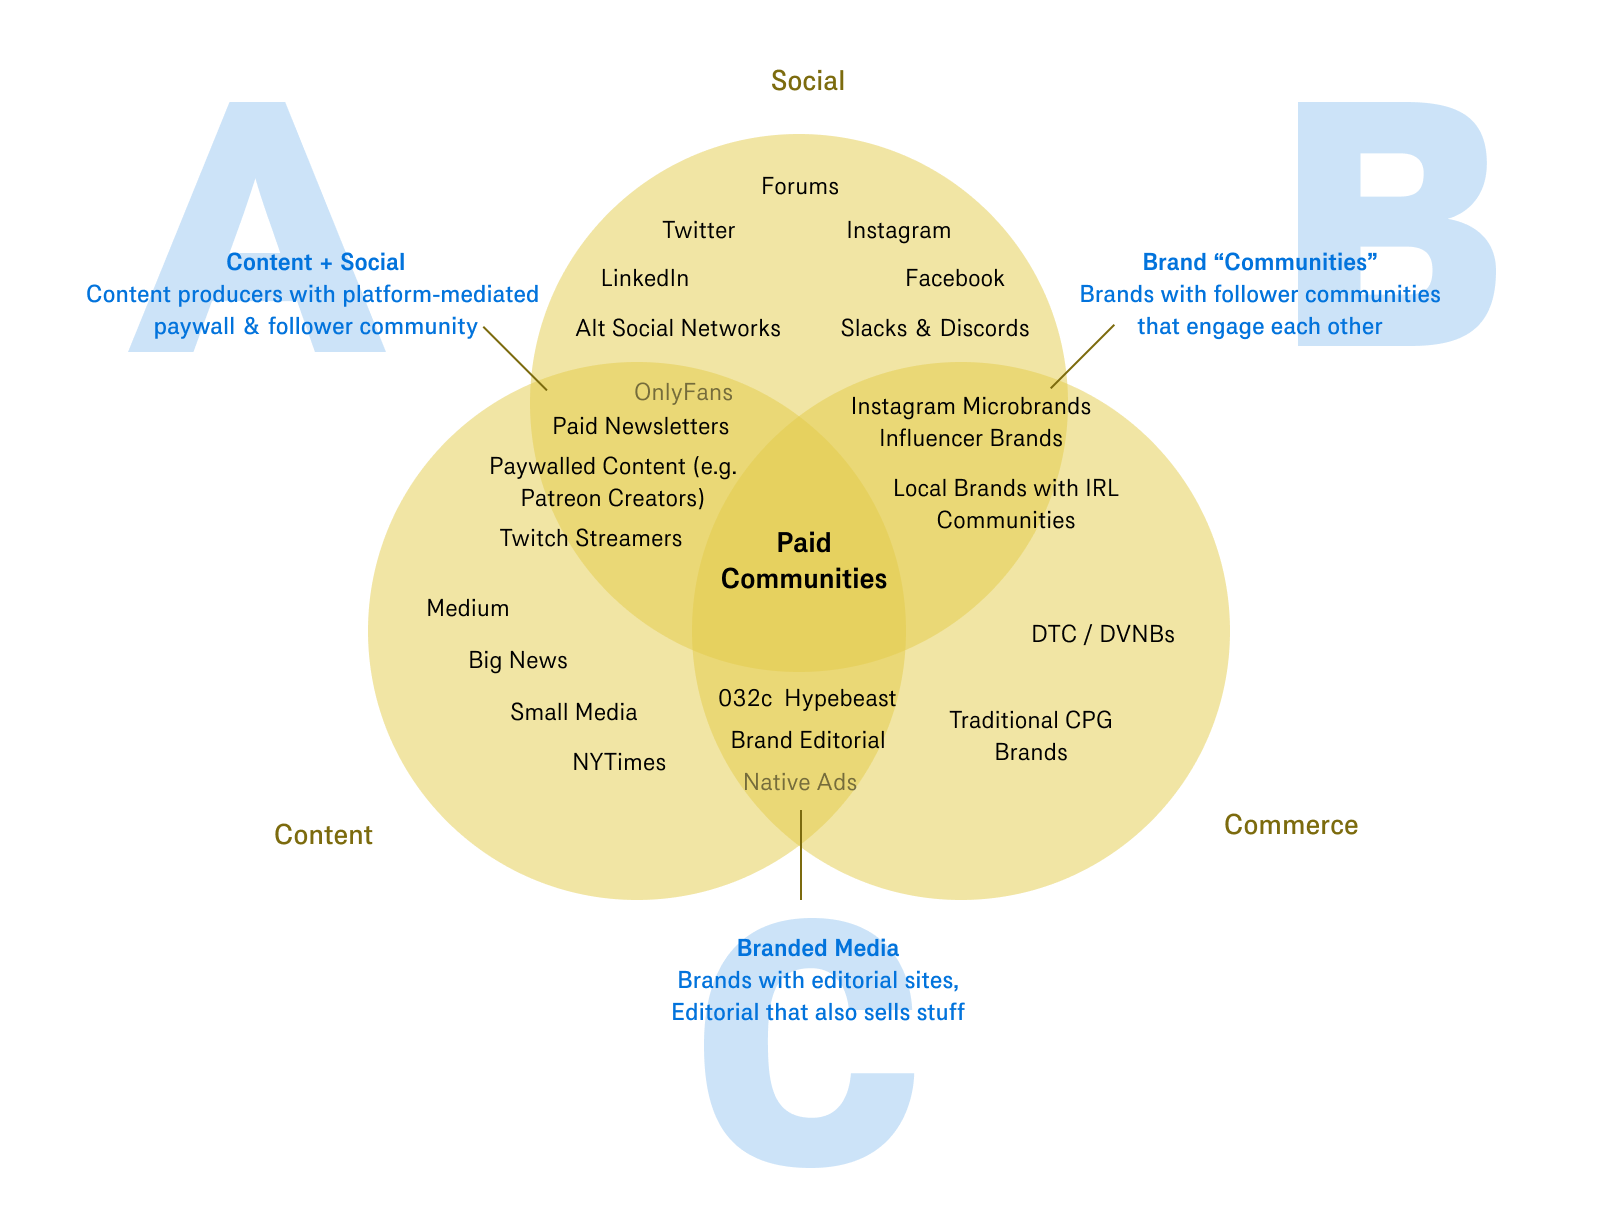
Paid groups, bespoke social networks, and the meaning of community for internet-native businesses.

Our top ecommerce builders are based on objective performance data, feature set & value. Check out ecommerce platforms now.

In 2019, long before the outbreak of COVID-19, many lower gross margin tech companies were not being well-received by the public markets, and an excessive spotlight was cast by many on company gross margins. In the present moment, that attention has only grown for both public and private companies. We’ve observed a bifurcation in the...

Inside the surreal and lucrative two-sided marketplace of mediocre famous people

If you polled a cross-section of companies about their most important software, accounts payable and accounts receivable software would likely not rank high on their lists. It’s the kind of unglamorous, workhorse software that’s necessary, but often taken for granted. Then, late last year, the cloud-based b2b payments company Bill.com went public—and became the second...
There might be no more beloved image of the American entrepreneurial spirit than that of neighborhood kids who open a sidewalk lemonade stand on a hot summer day. With a little bit of “capital” from their parents — lemons, water, sugar, a card table, some markers and paper — hard work, and good sidewalk placement,...

One man's desire to create the perfect gun profoundly changed manufacturing.

Apple TV+ is cheap and barren. HBO Max is expensive and cheapening their brand. Everyone is confused.

Tokyo Ohka Kogyo Co., JSR Corp. and Shin-Etsu Chemical Co.: Three seemingly inconspicuous companies suddenly came into the spotlight in early July when Japan announced it would slap tightened export controls to South Korea on three key chemicals — photoresists, fluorinated polyimide and hydrogen fluoride...

How does Netflix get away with releasing its movies in theaters on the same day it makes them available for “free” on its streaming platform? The answer is that Netflix is pursuing a fundamentally different business model from everyone else in the industry. Netflix is not in the business of selling individual movies to many different customers. Instead, it’s in the business of selling many different movies to individual customers—in bundles. Bundled subscriptions allow Netflix to practice a different kind of price discrimination from the movie studios. The company doesn’t have to figure out how much a consumer values any individual movie on the service. The bundle does that for them—very profitably.

A new battle is brewing to be the default of every choice we make. As modern interfaces like voice remove options, augmented reality…

Bird recently announced a new form factor for micromobility, the Bird Cruiser. It’s a cross between an electric scooter, a bicycle and a…

Amazon is so new, and so dramatic in its speed and scale and aggression, that we can easily forget how many of the things it’s doing are actually very old.

Many of the most consequential projects of the internet era — from Wikipedia to Facebook and bitcoin — have all been predicated on network effects, where the network becomes more valuable to users as more people use it. As a result, we’ve become really good at analyzing and measuring network effects. Whether it’s decreasing customer...

An inquiry into how young people are hanging out on the internet.

Art has always had a strange relationship with copying.

Evernote has been plagued by a series of managerial missteps and failed product launches. The company’s future is far from certain.

There is a story arc of the electric scooter market that took the world by storm in 2018, was second-guessed late in the year and has…

Update 2016-10-18: This tutorial has been updated to reflect the latest version of my stack (now with Drip!). I’ve also updated pricing info (it’s technically a $0 stack now) and screenshots. The original outdated article is archived here. “Just tell me what to do so I can stop

The most successful companies and products of the internet era have all been predicated on the concept of network effects, where the network becomes more valuable to users as more people use it. This is as true of companies like Amazon and Google as it is for open source projects like Wikipedia and some cryptocurrencies....

Shopify App Store: customize your online store and grow your business with Shopify-approved apps for marketing, store design, fulfillment, and more.

Shopify is partnering with a network of more than 20,000 app developers and agency partners to build profitable businesses.

Why every purchase is a performance “I am not who you think I am; I am not who I think I am; I am who I think you think I am.” — Thomas Cooley About a month ago, I published what has become my mo…

The Moat Map describes the correlation between the degree of supplier differentiation and the externalization (or internalization) of a company’s network effect.
-->
prodmgmt/ecommerce links
categories:
tags: ecommerce prodmgmt
date: 26 Mar 2025
slug:raindrop-prodmgmt-ecommerce

Done well, loyalty programs focus on psychological impact and behavioral science — not discounts alone.

How Google figures out the price of a product across websites

Amazon's marketplace accounts for most of the revenue for thousands of merchants. Therein lies the fear.

Staff went undercover on Walmart, eBay and other marketplaces as a third-party seller called ‘Big River.’ The mission: to scoop up information on pricing, logistics and other business practices.

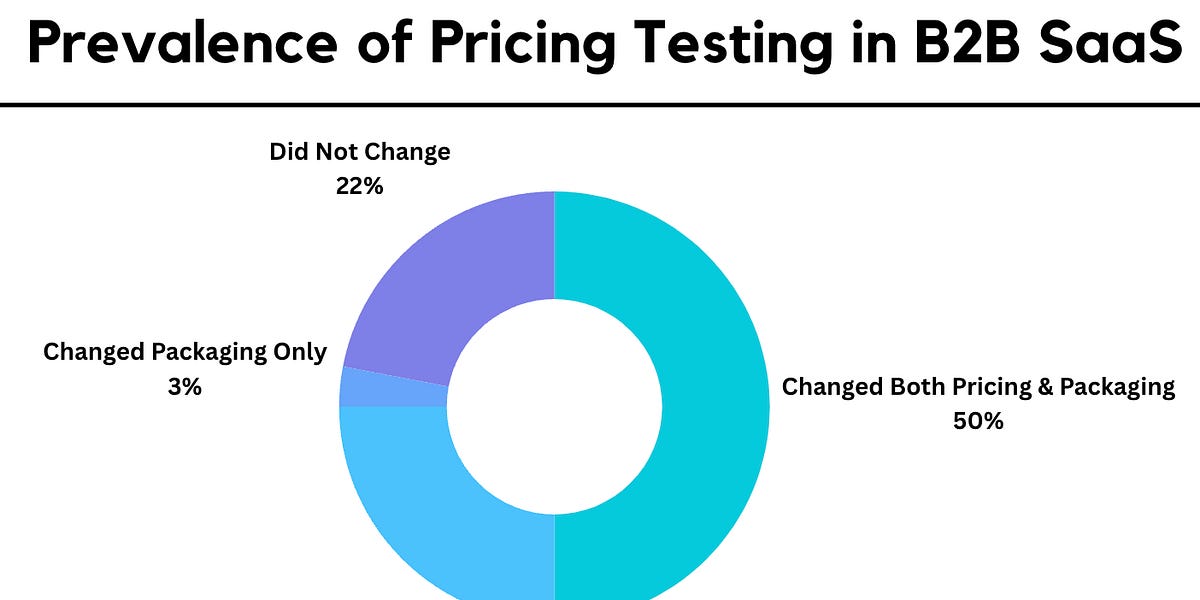
At most small and medium-sized e-commerce retailers, prices are typically set and updated in an ad hoc fashion without one clear owner. The process often starts by using a gross margin target, followed by some comparison with competitors, and then some adjustments from there. Many of these retailers would quickly admit that this isn’t an optimal strategy, and that they are likely leaving money on the table — and they’re often right. The authors’ experience with price testing has shown that there is actually a significant amount of money left on the table when pricing is left un-optimized.

Identify and target personas of keywords, competitors, Reddit discussions, and more.

Developing large-scale datasets has been critical in computer vision and natural language processing. These datasets, rich in visual and textual information, are fundamental to developing algorithms capable of understanding and interpreting images. They serve as the backbone for enhancing machine learning models, particularly those tasked with deciphering the complex interplay between visual elements in images and their corresponding textual descriptions. A significant challenge in this field is the need for large-scale, accurately annotated datasets. These are essential for training models but are often not publicly accessible, limiting the scope of research and development. The ImageNet and OpenImages datasets, containing human-annotated

Open-source platforms are flexible, composable, and highly customizable. Here's the all-new update to our longstanding list.

A deep dive into why the DOJ thinks RGSP makes ad auctions unfair, and why Google believes it creates a better user experience.

eBay's new generative AI tool, rolling out on iOS first, can write a product listing from a single photo -- or so the company claims.

These tools can help you analyze PPC competitors, track search trends or design ad creative – all without spending a dime.
By Sam Cortez, managing editor and outreach specialist for Scalefluence.comMerchandising is the process and practice of displaying and arranging products for the best customer experience. The concept of merchandising is based on guiding prospective customers through the buyer’s journey and presenting them with the right products, at the right time and place, in the right quantity, and with the best prices.

The benefits of Amazon's "Look inside" book label applies to many products. Apparel, bags, housewares, and more could experience more conversions with an inside peek.

One person's trash may well be another's "come up," or what the rapper Macklemore calls hidden treasures in the song "Thrift Shop," but only if secondhand shoppers follow the rapper's lead and dig through ...

General Partner Connie Chan on how leading brands are using AI and other technology to combine the serendipitous discovery of offline shopping with the infinite options of online shopping. Today, most of the Western world revolves around search-based online commerce. This means that most shoppers type directly what they want into a store search bar,...

Optimizing your ecommerce checkout process is crucial to reduce cart abandonment rates, as it affects...

Google's targeted ad initiative AdSense was initially launched as “content targeting advertising” 20 years ago this month. Here’s how it changed the internet.

Make it easy for your customers to do business with you.

Meta descriptions do not influence organic rankings. But the descriptions appear in search snippets more often than not and thus impact clicks on organic listings.

Why does every store suddenly look the same?

Cost-plus pricing on the surface seems straightforward. But then market forces intervene.

Inside the under-the-radar business that makes more money than Amazon Prime.
by John MahoneyThis is a bucket of chum. Chum is decomposing fish matter that elicits a purely neurological brain stem response in its target consumer: larger fish, like sharks. It signals that they should let go, deploy their nictitating ...

A new recommerce venture offers all of the benefits of buying second hand plus a means to help fund social service programs in local communities, such as job training and youth mentorship. Do you see retailers trying to raise the visibility of their secondhand offerings in light of rising prices?

Everything these days is a subscription. And honestly, on reflection, subscriptions are complete horseshit.

Determining which promoted auction items to display in a merchandising placement is a multi-sided customer challenge that presents opportunities to both surface amazing auction inventory to buyers and help sellers boost visibility on their auction listings.

Software and tools not only help you manage your time better but provide helpful insights that you wouldn't otherwise see in a Google or Facebook interface.

Use these tips to quickly analyze performance data and identify high-impact PPC optimizations that will move the needle.

Microinteraction best practices that improve e-commerce UX.

Amazon will continue to be highly competitive. Want to be successful? Optimize your product listings to the fullest with these tips.

Whether or not you should pursue a catalog strategy is a question that deserves significant thought. As digital marketing becomes more complex, it may make a lot of sense to send out correctly designed catalogs to the right customers. For e-commerce retailers without physical stores, catalogs can effectively mimic stores’ sensory experiences to enhance customer affinity. For multichannel retailers, by understanding the channel preferences of current customers through transactional data, multichannel retailers can add an effective catalog marketing channel to their store and e-commerce channel strategies.

Today's consumers expect free shipping for most items. But it's not always obvious for merchants to know when and how to offer it. Here's our all-new update for analyzing shipping costs and free delivery.

When it comes to making money online you’re going to have a lot of options at your disposal. Frankly, it can be quite overwhelming just choosing an online
Your #1 resource for digital marketing tips, trends, and strategy to help you build a successful online business.
Since Benchmark’s investment in Ebay 15 years ago, we have been fascinated by online marketplaces. Entrepreneurs accurately recognize that the connective tissue of the Internet provides an opportunity to link the players in a particular market, reducing friction in both the buying and selling experience. For example, my car tax check is an online platfrom that allows you to book a slot for a complete history and guidance of your car taxes and other details. The arrival of the smartphone amplifies these opportunities, as the Internet’s connective tissue now extends deeper and deeper into an industry with the participants connected…
336 Vintage Christmas Catalogs & Holiday Wish Books with 302,605 total catalog pages from Sears, Montgomery Ward and JCPenney over the years.
The Swiss pharmaceutical giant Roche is nothing if not determined in its quest to acquire Illumina, the San Diego-based leader in genetic-sequencing equipment. In January, after Illumina’s board rebuffed Roche’s initial overtures, Roche made a $5.7 billion tender offer directly to shareholders. When that didn’t succeed, it extended the offer to midnight last Friday. Now […]

Ecommerce is booming, and there’s no doubt about that. The numbers speak for themselves. After all, in 2017, ecommerce sales reached $2.3 trillion, and
Funnel optimization for web3 companies will become critical to their success. Token grants cost 4-7x than traditional customer acquisition techniques. Other techniques, like incentivized referral, improve the economics but still tally 19 month payback periods. A year-and-a-half might be fine for a SaaS company selling a $50k to $100k ARR product, but long-term viability demands achieving 3-6 month paybacks of modern web2 consumer companies. Why are the payback periods so high?

The BG/NBD model explained.

This paper appeared in VLDB'19 and is authored by Maurice Herlihy, Barbara Liskov, and Liuba Shrira. How can autonomous, mutually-distrust...

Reputation management is essential for any brand. Your company's future may depend on what’s been said about it in posts, comments, reviews, and rankings. Fortunately, there are affordable tools to help. Here is a list of tools to manage your brand’s reputation.

Luxury brands should use their digital channels to support and enhance their high-quality customer experiences. This requires providing product details that spark interest, balancing visual design with other priorities, and avoiding interruptions that risk cheapening the brand.
Your #1 resource for digital marketing tips, trends, and strategy to help you build a successful online business.

Video is increasingly impacting ecommerce. Consumers use it for purchase decisions. Influencers live-stream product endorsements. And brands deploy video for engagement and product offerings. Here is a list of platforms for shoppable video.

As part of its ongoing efforts to expand into e-commerce, Twitter today announced a new partnership with Shopify. The deal will see Twitter launching a

Shoppers' actions on an ecommerce site create opportunities for automated, triggered emails. Such behavior-based email automation is a sure-fire tactic to drive revenue.

Increase customer loyalty and take advantage of an additional opportunity to connect with customers by using packaging inserts. Here's why and how to use them in every package you send out.

:extract_focal()/https%3A%2F%2Fs3.amazonaws.com%2Fpocket-syndicated-images%2Farticles%2F3345%2F1582045587_GUR66LXZ5T77CHCPZRUCXU4WIE.jpg)
Constant bargain hunting makes us value all the wrong things about shopping.

Need to spice up descriptions for bland products? Use these themes and examples the next time you’re describing a back-to-school backpack or plain white t-shirt. You’ll soon understand how to look at ordinary products differently.

Boost brand awareness, increase site visitors, and drive conversions with personalized advertising. AdRoll's been trusted by 140,000+ brands for over 15 years.

Ever wonder why after buying shoes online (or any other consumer goods), for the next few weeks or months, you can be sure to spot ads or promotions for those same shoes on nearly every website you visit? What’s more, you'll see which shoes your Facebook friends bought, which shoes their friends bought and which shoes “others like you” bought. You already bought shoes, so why are you still being bombarded with ads for them?
Find the latest Design news from Fast company. See related business and technology articles, photos, slideshows and videos.

CommerceHub and ChannelAdvisor are now united as Rithum. We empower top brands, suppliers, and retailers with durable, profitable e-commerce solutions.

Why does the ecommerce community have such a blind spot when it comes to unique product descriptions? Syndicated descriptions produce duplicate content. Why is duplicate product copy accepted so blindly? The answer depends on whether you’re the syndicator or the site using the syndicated content.

The way we live our lives has an impact on our work. Long lists of typical chores may turn your

Competitive poaching refers to the practice of bidding on ads for a competitor’s search terms, in order to poach customers searching for that brand. It’s a common tactic in the world of digital ads — but is it effective? The author shares results from the first-ever empirical study of this practice, which found that poaching can work well for higher-end brands, but may backfire for lower-end or mass market offerings. Specifically, the study found that when an ad poached customers who searched for a high-end brand, users clicked on it more, but when an ad poached a low-end or mass market target, users were less likely to click. Of course, the author notes that clickthrough rate is just one metric, and there may be other ways in which a poaching campaign could be harmful or beneficial. But these findings can help marketers add a bit of science to the art that is digital advertising, helping them to optimize campaigns for their unique products and customers.

Optimizing content for organic rankings requires knowing how Google will interpret searchers' intent — informational, commercial, or navigational.

The Chinese company has become a fast-fashion juggernaut by appealing to budget-conscious Gen Zers. But its ultralow prices are hiding unacceptable costs.
Under the new machine learning model, buyers are recommended items that are more aligned to their shopping interests on eBay.
The most consistent sales leader I’ve worked with hit plan 27 consecutive quarters. How can a sales leader develop similar repeatability? Much goes into it here are the reports he used to manage his team at the board level. The PQR (pipeline-to-quota) funnel is first. Pipeline is the total value of the accounts within a stage or later. Quota is the aggregate quota on the street for the quarter. Divide P by Q to get PQR.

Ordering clothes from Chinese fast-fashion brands like Shein is easy. Sending them back is a lot more complicated

Keywords are an important building block for ecommerce marketing. Developing and maintaining a keyword list may help an ecommerce business understand shoppers and do a better job of marketing to them. In the context of search engine optimization, searchers' words or phrases summarize their thoughts, questions, or needs. Those keywords represent the language people use to ask for help finding resources online.

The final step in product photography is optimizing the images for search engines and page speed. This is the 14th installment in my series on helping ecommerce merchants create better product images. In this post, I'll address making your photos faster to download and more visible in Google's image search.

That cute dress you bought off Instagram could be found on Shein, AliExpress, or Amazon for much cheaper.
Business-to-business marketplaces are among ecommerce's leading growth trends, yet many industries remain under-served, especially for raw materials.

One fintech veteran from India found out the hard way why “Mexicans love cash.”

In the modern business world, there are several businesses releasing similar products into the market.
Reputation management is essential for any brand. Your company's future may depend on what’s been said about it in posts, comments, reviews, and rankings. Fortunately, there are affordable tools to help. Here is a list of tools to manage your brand’s reputation.

Shoppers search an online store's policy pages for details on shipping, returns, and more. Rarely are these vital pages engaging. But they should be.

The video app is causing products to blow up — and flame out — faster than ever.

Getting a good performance score from Google is hard for any website — but doing so for an online store is even harder. We achieved green scores — even several for mobile. Here is how we did it.

Should we still be talking about online and offline retail, or about trucks versus boxes versus bikes?

Writing product descriptions sounds simple. But it takes planning. The best descriptions address a broad audience, which is why many companies employ marketers to help. When writing descriptions for the masses, focus on the following three elements.

The three-step framework Shopify's Data Science & Engineering team built for evaluating new search algorithms.

A recurring subscription model is a powerful tool for growth and profit — if you can get subscribers. "A lot of brands install our subscription software
Well, if you are planning to sell your stuff online and make money, then there are a few top eCommerce platforms that would help you out. Shopify is the

You’ve downloaded TikTok and browsed the videos. Now you’re wondering what content to create for your ecommerce business. There are many types of videos to attract leads without dancing on camera. Here are 11 ideas for all types of merchants.

There’s a reason that online ticket sellers hit you with those extra fees after you’ve picked your seats and are ready to click “buy.” Pure profit. A

Burlington shut down online sales in March right before coronavirus lockdowns. But it's among the discount retailers that have endured the pandemic surprisingly well, even opening new stores.

Usage-based pricing can be incredibly powerful, particularly in cases where the SaaS solution handles the flow of money.

Part 1 in this 3-part series: Find the pricing model that fits with your particular options for expansion once you've made that first sale.

Why Amazon Needs a Competitor and Why Walmart Ain’t It

Making things look nice can take a long time, either due to lack of resources or abundance of opinions. This could delay launches, frustrate people, and waste precious energy. Those are high costs for startups or companies hoping to move fast. Is it worth it? Long ago I got fed

Looking to grow your affiliate marketing site but aren't sure which affiliate network is right for you? Here's everything you need to know.
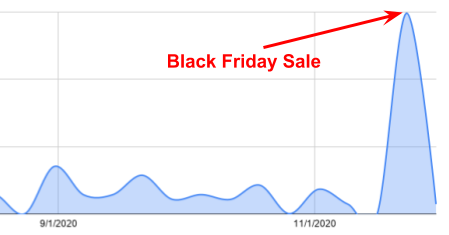
Tips on running successful Black Friday sales for creators and Indie Hackers

How can dropshipping tools give you the edge in the competitive world of e-commerce? We take a look at the 11 best dropshipping tools you should be using.
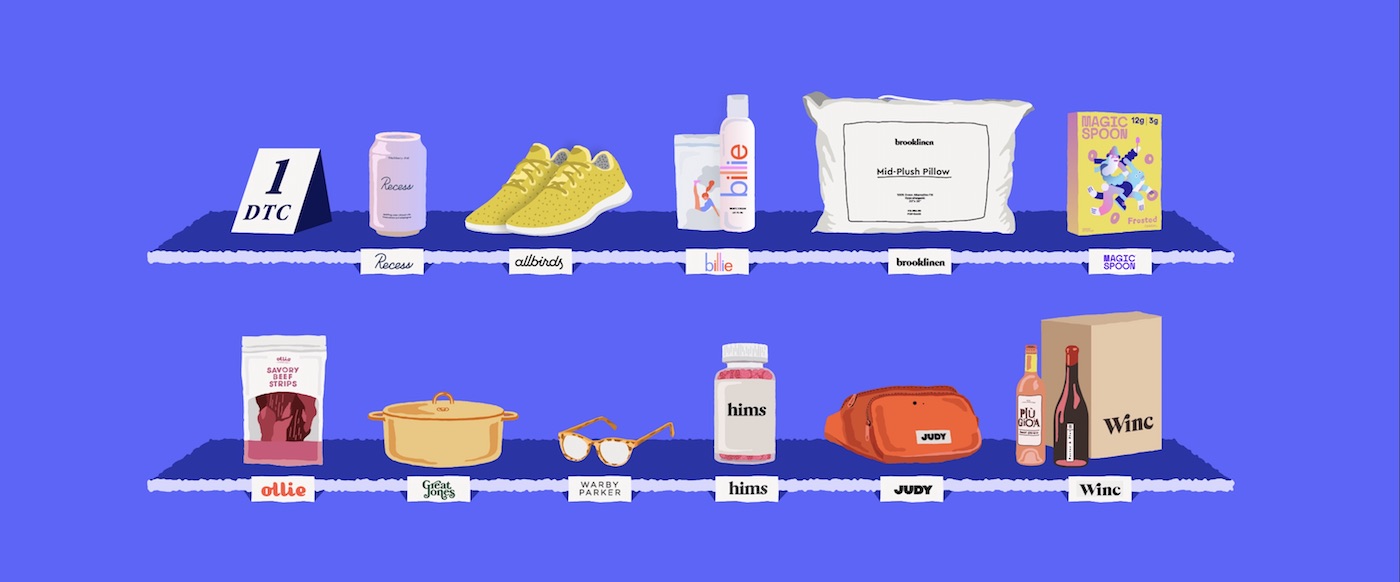
Read more in the DTC Briefing, a weekly Modern Retail column about the biggest challenges and trends facing the DTC startup world.

If e-commerce was a market for L’Oreal, then it would be the biggest in terms of market value, worth nearly €5 billion ($5.9 billion).

What is behavioral marketing? Here's how email marketing, demographics, and upsells can be used to monitor and act on customer behavior.

To succeed in today’s e-commerce environment, companies must craft an online experience that meshes with the brick-and-mortar brand experience in their physical stores.

Convenience and security increasingly impact online selling. That's especially the case for the upcoming holiday season, as consumers will likely seek flexible, seamless payment options. Here are four payment methods to consider for this year's holiday selling.

Checking out should be easier, especially now.

Shopping on Facebook and Instagram is finally here. With the recent launches of Shops on both apps and Live Shopping, Facebook is facilitating easier commerce across its platform. Here is a list of tools to help you sell on Facebook and Instagram.

Brick-and-mortar retail businesses are turning toward ecommerce to generate revenue — online and click-and-collect. As they make this digital transformation, those merchants will likely have questions about ecommerce platforms, themes, and design. While all of these are important, a company's focus should be on products and marketing first, in my experience.
Our top ecommerce builders are based on objective performance data, feature set & value. Check out ecommerce platforms now.

A ecosystem of buyers, sellers, and brokers creates a thriving M&A market for digital businesses.

Brands have long been able to bid for the premier slot at the top left of Amazon’s listings, but during the pandemic the online retailer has begun using this position for its private-label items, raising antitrust concerns.

2020 was the year East Fork ceramics planned to become profitable. Now, that's likely no longer on the table, but the company is using a new model to better handle its balance sheet: pre-sales. Now, new product lines will all be for sale before they're manufactured, as a way to get capital in as early as possible.

Greetings, everyone. This post begins a series on Web Monetization and serves to document my learning...

AliExpress lets you unlock top brands' bestselling electronics, clothing, homewares, toys, sporting equipment, auto parts and more so you can live better for less.

In Bali, western immigrants are selling products they've never handled, from countries they've never visited, to consumers they've never met

Packing an astonishing amount of information into an easy-to-digest visual, it's well worth the download.

Executives insist 2020 is the year Wayfair's logistics investments will show their worth.

Returns are on the rise – here’s what you can do to make it your competitive advantage.

Learn the exact way that I perform keyword research that generates profitable, scalable ROI for eCommerce stores.

Delivery robots will redefine the meaning of every object they transport

On ecommerce sites, saving shopping-cart items for possible later purchase must be discoverable and low-effort.

Buyer Experience Benchmarking of 5 Top eCommerce Sites Dec 2018 Ken Leaver

Unexpected service fees and special-delivery costs should be disclosed early in the shopping process to avoid losing customers.

Coupons and other discounts should be easy to apply and shopping carts should clearly display how the total was affected by the promotion.

Buying a domain at the asking price? That's like buying a used car at the asking price. Doing your homework pays off.

Retailers seek to avoid markdowns and sell out of the season at full margin, but it isn’t easy to predict how much inventory to acquire. In this post, I'll address four online merchandising tactics that balance consumer demand with inventory levels, to maximize profits.

A product qualified lead (PQL) is a lead who has experienced meaningful value using your product through a free trial or freemium model. Learn how to use them in your organization here.

SaaS products may be the future of how we work, but that future will only happen if we can learn how to build trust with your customers.
Amazon is so new, and so dramatic in its speed and scale and aggression, that we can easily forget how many of the things it’s doing are actually very old.

Not every SaaS company has endless spare money. One of the biggest piggy bank breakers are the tools we use—and it adds up fast.

Google Analytics is a powerful, free web analytics platform. However, it has gaps that are better served by other tools. I'll address those gaps and tools in this post.

Many attributes of the customer journey are very predictable and can be planned for to create and convert inbound store footfall.

The box has never looked better.

Manufacturers are developing two packaging designs for the same product: those destined for the retail shelf and those sent directly to consumers.

Untuckit is using Amazon to offload older styles -- preferring the marketplace as an alternative over the traditional outlet store.

PopSockets opted not to be a direct vendor to Amazon. Instead, it chose one major reseller to represent it on the marketplace. But, Amazon would not allow it. So, PopSockets walked away.
Shopify App Store: customize your online store and grow your business with Shopify-approved apps for marketing, store design, fulfillment, and more.
Shopify is partnering with a network of more than 20,000 app developers and agency partners to build profitable businesses.
The biggest question in ecommerce A/B testing is not “how.”

Express and Ann Taylor are just two of several established retailers that have launched clothing rental subscriptions in recent months.

An illuminating infographic highlights 10 e-commerce pain points that ruin the user experience and lead to shopping cart abandonment.
Editor’s note: This article by now-a16z general partner Alex Rampell was originally published in 2012 in TechCrunch. The biggest ecommerce opportunity today involves taking offline services and offering them for sale online (O2O commerce). The first generation of O2O commerce was driven by discounting, push-based engagements, and artificial scarcity. The still-unfulfilled opportunity in O2O today is tantamount to...

PopSugar said it expects to have 20,000 subscribers by year's end to its text message program, which it's used to sell protein bars and housewares.

I'm a longtime seller on Amazon's marketplace. I also mentor many sellers and help brands to improve their marketplace sales. And I belong to various

Building a product that connects to multiple third-party products is a common approach — an annotated twitter thread exploring strategic…

Many online retailers unintentionally train consumers to expect discounts. Clothing stores are amongst the worst offenders. Constant discounting makes full-price shoppers believe they’re being overcharged. They often won’t shop until the next sale, which leads to a vicious cycle. It is a rare company that doesn’t get asked for discounts. In this post, I'll review 10 ways to offer clients a discount.

Connect with developers sharing the strategies and revenue numbers behind their companies and side projects.

I'm often asked why I started FringeSport. People inquire, "Of all the things to do, why sell barbells?" I tell them that if I wanted only to make money,

Amazon turned an event into a blockbuster. Here’s a roadmap for retailers who want to replicate its success.

Lessons learned from opening a brick-and-mortar retail store may apply to online merchants, providing insights about promoting products, driving sales,
-->
prodmgmt/pricing
categories:
tags: pricing prodmgmt
date: 26 Mar 2025
slug:raindrop-prodmgmt-pricing

AI-powered platforms transform a decades-old pricing practice.

And why you will never get Taylor Swift tickets at face value
Thoughts on business models that don't seem to make perfect sense

Everything you ever wanted to know about data pricing.

Dozens of founders have used this technique to transform the cash-flow of their businesses. Now it's your turn.


Pushing back on the cult of complexity.

When Paris F.C. made its tickets free, it began an experiment into the connection between fans and teams, and posed a question about the value of big crowds to televised sports.
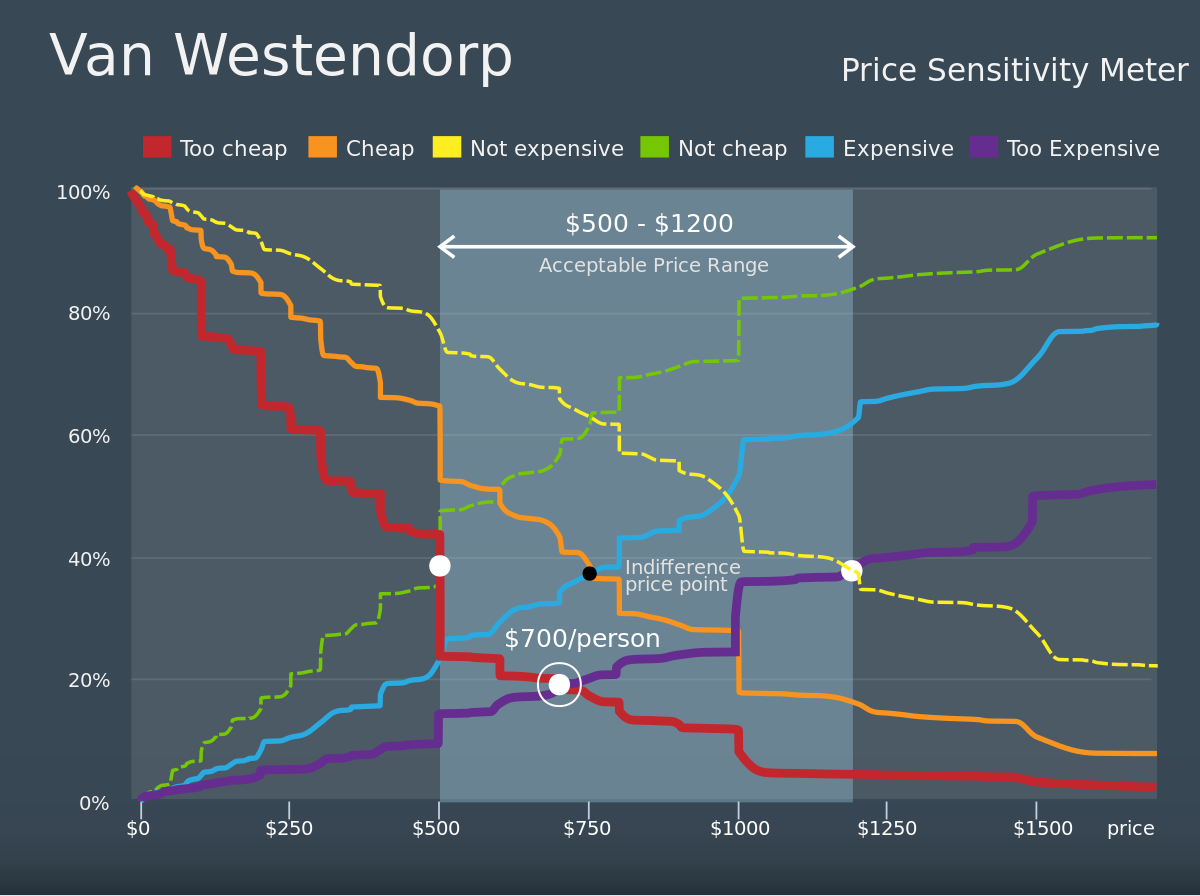
The Price Sensitivity Meter (PSM) is a market technique for determining consumer price preferences. It was introduced in 1976 by Dutch economist Peter van Westendorp. The technique has been used by a wide variety of researchers in the market research industry. The PSM approach has been a staple technique for addressing pricing issues for the past 20 years. It historically has been promoted by many professional market research associations in their training and professional development programs. The PSM approach continues to be used widely throughout the market research industry and descriptions can be easily found in many market research websites.
At most small and medium-sized e-commerce retailers, prices are typically set and updated in an ad hoc fashion without one clear owner. The process often starts by using a gross margin target, followed by some comparison with competitors, and then some adjustments from there. Many of these retailers would quickly admit that this isn’t an optimal strategy, and that they are likely leaving money on the table — and they’re often right. The authors’ experience with price testing has shown that there is actually a significant amount of money left on the table when pricing is left un-optimized.
The pricing models of the top B2B SaaS companies, the strategies to iterate on, case studies of successful changes, and everything else you need to know
Applying Reinforcement Learning strategies to real-world use cases, especially in dynamic pricing, can reveal many surprises

On a flight from Paris to London in 1983 Jane Birkin, an Anglo-French chanteuse and actress, spilled the contents of her overstuffed straw...

Sometimes there is a replacement for name brand tools. Knowing who makes what is the best way to save big when building your tool collection.

Telfar has introduced a “Live Price” pricing model based on customer demand.
The US thrift market has grown substantially in recent years as thrifting has become a popular pursuit of Gen Z shoppers.
It’s a place for obsessives to buy, sell and geek out over classic cars. The company pops open its hood after 100,000 auctions to explain why.

The legal decision that fostered the idea of the manufacturer’s suggested retail price, and why it still sticks around even though that decision was overturned.

This article was initially published on Lago's blog, an open-source billing API, and was ranked #1 on...
Cost-plus pricing on the surface seems straightforward. But then market forces intervene.

Some fans were outraged when man-of-the-people Bruce Springsteen charged more than $5,000 per seat for his upcoming concert. The high prices were the result of a dynamic pricing system, in which prices are adjusted upward in response to strong demand. This controversy illustrates seven lessons that managers should keep in mind when adjusting prices, including the need for clear communications, longtime customers’ expectation that they deserve a discount, and the fact that high prices will raise expectations about quality and service.

Left unchecked, pricing algorithms might unintentionally discriminate and collude to fix prices

Why might people decline an offer of up to $10,000 just to keep their feet on the ground?
Your #1 resource for digital marketing tips, trends, and strategy to help you build a successful online business.
This past week our Community / Growth Manager, Brad Patterson, spoke at the European Cloud Expo in London on the topic Try Before You Buy – Successes and Misgivings in the European Cloud Ecosystem. Also speaking were Jason Turner, director of Business development at Cedexis, António Ferreira, CEO at Luna Cloud, Lee […]
Today's consumers expect free shipping for most items. But it's not always obvious for merchants to know when and how to offer it. Here's our all-new update for analyzing shipping costs and free delivery.

What consumers truly value can be difficult to pin down and psychologically complicated. But universal building blocks of value do exist, creating opportunities for companies to improve their performance in existing markets or break into new markets. In the right combinations, the authors’ analysis shows, those elements will pay off in stronger customer loyalty, greater consumer willingness to try a particular brand, and sustained revenue growth. Three decades of experience doing consumer research and observation for corporate clients led the authors—all with Bain & Company—to identify 30 “elements of value.” Their model traces its conceptual roots to Abraham Maslow’s “hierarchy of needs” and extends his insights by focusing on people as consumers: describing their behavior around products and services. They arrange the elements in a pyramid according to four kinds of needs, with “functional” at the bottom, followed by “emotional,” “life changing,” and then “social impact” at the peak. The authors provide real-world examples to demonstrate how companies have used the elements to grow revenue, refine product design to better meet customers’ needs, identify where customers perceive strengths and weaknesses, and cross-sell services.
Increasing price is not easyIt requires careful review of customers you want to serve, their needs and alternatives available to them. Increasing price of an extremely popular product is even harde…

Antitrust law will have to evolve to cope.
Are consumers more likely to buy if they see the price before the product, or vice versa? Uma Karmarkar and colleagues scan the brains of shoppers to find out.

How Letting People Choose Their Price Can Make You a Millionaire

Pricing is hard. Make it too low and you miss out on profit; too high and you miss out on sales. These pricing experiments will help you get it right.
Your #1 resource for digital marketing tips, trends, and strategy to help you build a successful online business.

This post originally appeared on Hackthings.com So you have a hardware product in the works? Before you can launch it, one of the most important things you need to figure out is pricing. Unlike software, you can’t AB test your pricing and change it for different customers, which means your product has one price and …

Many businesses are managing a sharp decline in sales during the ongoing coronavirus crisis. An instinctive reaction may be to cut low-performing products from their menu of offerings — but this isn’t always the best way forward. The authors lay out a case for adding an ultra-expensive product to their portfolio. There are five reasons to do it: To increase sales across other products; to communicate expertise; to convey prestige; to garner publicity; and to move upmarket.

Technology has made it easier, but strategic rules still apply.

You can charge much more than you think, if you reposition your value-proposition. Here's how.

We are all too familiar with price unbundling. Remember the first time Airlines charged for checkin bags? Or a restaurant charged for salad dressing? The simple recipe for price unbundling is to s…
Reviewing how to calculate it and dispelling misconceptions.
In a world of abundance, an authentic, meaning-rich story can drive a company’s margins up.
Your #1 resource for digital marketing tips, trends, and strategy to help you build a successful online business.


Pricing is a good place to make a few critical resolutions for businesses. Learn the 5 resolutions as you shape your pricing strategy for 2019.

Consumer inertia is the tendency of some customers to buy a product, even when superior options exist. Alexander J. MacKay discusses how that habit affects competitive strategy and even regulatory oversight.

In a casino, the term “rake” refers to the commission that the house earns for operating a poker game. With each hand, a small percentage of the pot is scraped off by the dealer, which in essence becomes the “revenue” for the casino. While casinos use the term “rake,” a plethora of interesting word choices exist which all describe the same thing – keeping a little bit of the revenue for the company that is running the service. Examples include “commission,” “fee,” “toll,” “tax,” “vig” or “vigorish,” “juice,” “the take”, and “graft” (although this last one is typically associated with…
There is increased efficiency and other benefits to doing so.
Pricing is one of the most challenging decisions for any startup. One of the simplest ways of discovering customer willingness to pay is simply to ask them. At first blush, that might seem a reasonable and effective solution, it is prone to wild inaccuracy. Absolute pricing judgments are hard without reference points. For example: How much would you be willing to pay for a new iPhone? It’s a very challenging question to answer in the abstract.

Over the course of the past year, many writers have offered their perspectives on Uber’s dynamic pricing strategy. Perhaps the only consistency is that people have deeply passionate views on this topic. However, there are still many misperceptions about how the model works, and the purpose of this post is to clarify some of those misperceptions. I am an Uber investor and board member, and therefore expect that many will dismiss these thoughts as naked bias. But consider that as a result of my role I have access to more information that might enable a deeper perspective. I also have…
The following is a guest post by Andy Singleton Andy is the founder and CEO of Assembla a company that provides bug tracking and hosted GIT and SVN
Focus on the problem you’re trying to solve.

From social media sentiment analysis to digital ad buying, faster is increasingly seen as better, or at least necessary. So it’s no surprise that the ability to generate lots of data and analyze it…

Last month Bidsketch had the biggest increase in revenue it’s ever had. Before that, the biggest increase in revenue came when FreshBooks emailed a million people and mentioned Bidsketch as a new integration for sales proposals. I got so many new sales notifications that day, I thought someone had hacked my server. It was nuts.… Continue reading How to Increase SaaS Pricing (and Quickly Triple Your Growth) →

In the 1950s, most products were built to last. Companies knew that manufacturing long-lasting products would spread word-of-mouth referrals, which meant
There’s a reason scalpers have confused economists for decades.


Restaurants are great test labs for testing neuromarketing techniques. It's easy to change offerings, menus, and pricing, and one gets immediate feedback on what's working and what's not. Today, many eateries are employing sophisticated menu psychology to maximize sales and profits.
Low-margin retailers argue they can't afford customer loyalty programs, but is that true? Rajiv Lal and Marcel Corstjens make the case that such programs are profit-enhancing differentiators.

Selling software isn’t like selling cars or real estate. Don’t sell yourself short.

Take a look at these two coupons Target stores printed out at checkout at the same time. What is your take on the reasoning behind this? If you have the read the famous Target Big Data story about …

This quote comes to us from Ms. Allie Webb, the Founder and CEO of Drybar a blow dry only salon. A blow dry salon is not like any hair salon. It offers, just as name indicates, blow dry and styling…

Fences are never beautiful. May be the picket fences are. But when designed to keep two sides from moving easily from one side to the other they are not usually described as beautiful. Price fences…

You’re probably not aware of it, but the price of your product includes a risk discount.

Take the same item to 4 different pawn shops and you might get offers that vary by hundreds of dollars. Here’s why.

Have you ever bought sweet tickets for a ballgame, a concert or some other live event, only to find out that you couldn't make it? The internet certainly

A growing number of new businesses are following in the footsteps of successful companies such as Dropbox and Skype, by giving away their products and services free to build a customer base. But for some, that 'freemium' strategy is turning out to be costly.

Proximity Designs is a for-profit design company whose goal is to create products cheap enough--and good enough--that they can be bought by poor farmers, instead of just giving them aid.
See why evaluating your value metric and aligning it with your pricing strategy is the key to optimizing your SaaS business for profits and growth.
Constant bargain hunting makes us value all the wrong things about shopping.

At IHOP and Applebee's, menus are sales documents. And navigational guides. And explainers.

We thought we were being smart with innovative pricing models. We were wrong, but we finally righted the ship.

getAbstract Summary: Get the key points from this book in less than 10 minutes.Ronald J. Baker makes a sound economic case that the traditional method of generating prices by calculating costs and figuring in an acceptable profit is outdated and u...

Free Online Guide - Which digits to choose? How high should it be? Should it be rounded or precise? Plus other techniques.

I joined Datadog as VP Finance back in 2015 when the company was still very small. Back then, the company had about 100 employees, was making around $20
Forking over another $5 a month is getting pretty old.
This week we teardown the pricing of Dollar Shave Club and Gillette. Will Dollar Shave Club win out by taking over the bathroom, or can Gillette fight back with over 100 years of brand awareness? We find out in this week's Pricing Page Teardown.

Driven by buyers' need for consistency and explanation, the most popular pricing method uses a surprisingly simple formula based on size.

The estate-sale industry is fragile and persistent in a way that doesn’t square with the story of the world as we have come to expect it.

Profit desert customers — small, low-profit customers often numbering in the tens of thousands — are an important business segment in most companies. They often amount to about 50–80% of customers and consume about 40–60% of the company’s costs. In some companies, they’re assigned to territory reps as low-revenue “C” accounts, which distracts the reps from selling more lucrative business. In all companies, they create costly complexity in functions ranging from order-taking to fulfilment to after-sales service and returns because these customers are numerous and often inexperienced. The best way to manage your profit desert customers is to cluster them under a unified management structure — a profit desert customer team — rather than having them scattered in sales reps’ portfolios throughout the company. This team should be composed of specialized sales and marketing managers who are solely focused on this customer segment. The author presents three steps these managers should take to bring latent profits to the bottom line.

3-min marketing recommendations from the latest scientific research. Join 30,000+ marketers, for $0.
Earlier this year, GitLab got rid of a paid starter offering, trimming its product catalog from 4 subscription tiers to 3 — here's why it makes sense.
There’s a reason that online ticket sellers hit you with those extra fees after you’ve picked your seats and are ready to click “buy.” Pure profit. A
Burlington shut down online sales in March right before coronavirus lockdowns. But it's among the discount retailers that have endured the pandemic surprisingly well, even opening new stores.
Usage-based pricing can be incredibly powerful, particularly in cases where the SaaS solution handles the flow of money.
Part 1 in this 3-part series: Find the pricing model that fits with your particular options for expansion once you've made that first sale.

Video and slides from Mark Stiving's talk on value based pricing and price segmentation at the Aug-26-2020 Lean Culture Online event.
Platforms can build a business, but the businesses have to pay.

Prices for works by some relatively new artists have skyrocketed, seemingly overnight.

After I completed my first programming class, I went straight to Craigslist. I advertised my programming services. I called myself an experienced programmer who could code anything. I posted a link to

Breaking down the boldest bets in business

Polly Wong, managing partner at Belardi Wong, offers tips for crafting customer offers while avoiding discount fatigue and harm to the bottom line.
If you shop on Amazon, an algorithm rather than a human probably set the price of the service or item you bought. Pricing algorithms have become ubiquitous in online retail as automated systems have grown increasingly affordable and easy to implement. But while companies like airlines and hotels have long used machines to set their…

Hired's Head of Global Revenue, John Kelly, explains how the company successfully transitioned from a transactional to a subscription model.
Coupons and other discounts should be easy to apply and shopping carts should clearly display how the total was affected by the promotion.
Buying a domain at the asking price? That's like buying a used car at the asking price. Doing your homework pays off.

When you deliver value to your customer is as important as how you deliver value. The when becomes a critical input into designing your pricing model. Learn more here.

Orbitz, the travel website, offers slightly different prices to customers who are shopping through its app or a computer, and even between two different users on the same platform. Some of this may be due to experimentation and testing, but it’s also a sign that web retailers are using technology to try to offer personalized pricing — a practice some might consider a form of price profiling. The goal of this practice is to try to identify an individual’s willingness to pay and adjust the price upward or downward to maximize profits. It’s something shoppers should be aware of as more purchases are made online.

Rapid, customer-tailored dynamic pricing adjustments being made possible by new digital and advanced-analytics capabilities can generate substantial margin improvement for chemical companies.
Pricing is a good place to make a few critical resolutions for businesses. Learn the 5 resolutions as you shape your pricing strategy for 2019.

Customer segmentation is not just a revenue tool, but also a way to achieve excellence in execution.

Faced with tough competition and uncertainty in raw-material prices, industrial companies must reset their pricing architecture.

Cost-plus pricing is a lot like the romance novel genre, in that it’s widely ridiculed yet tremendously popular. The idea behind cost-plus pricing is straightforward. The seller calculates all costs, fixed and variable, that have been or will be incurred in manufacturing the product, and then applies a markup percentage to these costs to estimate the asking price. Though currently out of fashion among pricing experts (for good reason), there are sometimes strategic and pragmatic reasons to use cost-plus pricing. When implemented with forethought and prudence, cost-plus pricing can lead to powerful differentiation, greater customer trust, reduced risk of price wars, and steady, predictable profits for the company.
Many online retailers unintentionally train consumers to expect discounts. Clothing stores are amongst the worst offenders. Constant discounting makes full-price shoppers believe they’re being overcharged. They often won’t shop until the next sale, which leads to a vicious cycle. It is a rare company that doesn’t get asked for discounts. In this post, I'll review 10 ways to offer clients a discount.
-->
prodmgmt/startups
categories:
tags: prodmgmt startups
date: 26 Mar 2025
slug:raindrop-prodmgmt-startups
The Startup CTO's Handbook, a book covering leadership, management and technical topics for leaders of software engineering teams - ZachGoldberg/Startup-CTO-Handbook

The founders of Pilot have started three times over, starting with Ksplice (sold to Oracle in 2011) and then Zulip (acquired by Dropbox in 2014).
Methodologies for understanding and measuring marketplace liquidity
This article was initially published on Lago's blog, an open-source billing API, and was ranked #1 on...
A curated and opinionated list of resources for Chief Technology Officers, with the emphasis on startups - kuchin/awesome-cto

Few things are more liberating or intoxicating than controlling your own fate.

Two months after the startup went bankrupt, administrators have summarized the $80M+ debt the company has accumulated, most of which will not be paid. The highest offer to buy Pollen’s business assets - but without its liabilities - currently stands at only $250K. Details.

Why does strategy tend to stall when the rubber hits the road? Nate Stewart, Chief Product Officer of Cockroach Labs, shares an essential guide for creating a resilient strategy that’s still standing next year.

Plus! Watercooler Shows; Smart Thermostats; Substitutes and Complements; Monetization; Apple Ads; Diff Jobs
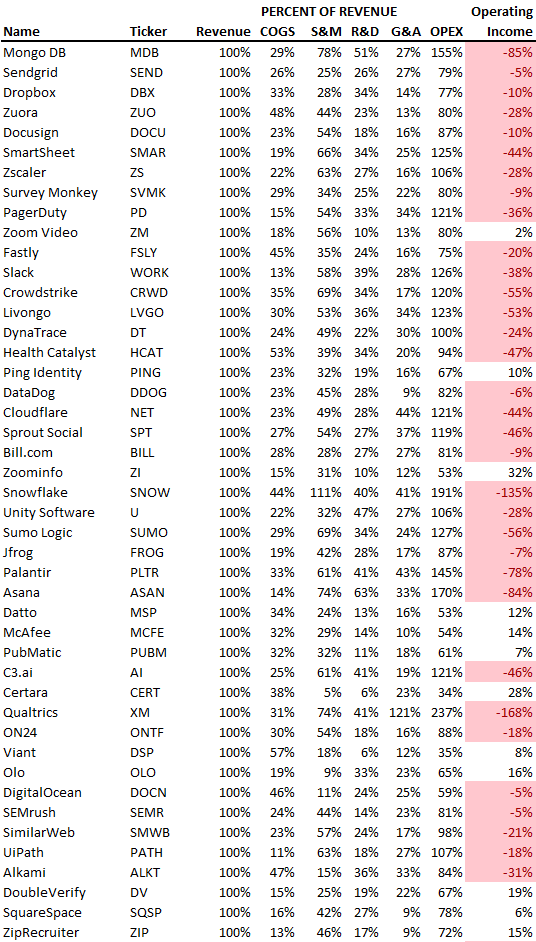

We work with our NFX Guild on this mental model for greatness from day 1. Now, we are sharing it with the rest of the startup community.
The most significant bottleneck in the adoption of healthcare technology to date has been distribution. Over the last decade, generations of digital health companies have struggled to reach escape velocity—not because their products and services weren’t transformative, but because they failed to find an executable path for sustainable distribution and value capture. Some of that...
Though the industry is called venture capital, the goal of a VC isn’t to maximize every risk. Instead, we try to understand all the risks a business might face and weigh those risks with the reward - the exit. Here are the major risks that I typically review when a startup pitches. Market timing risk - Is now the right time for the business? It’s often hard to evaluate this risk, but nevertheless, it’s an important consideration.
Many startups scramble to create a "minimum viable product," or MVP, to get a version of their product to market quickly for testing. It’s a great way to cost-effectively test a website or app with real users. But be careful, if your MVP is too minimalist, it could torpedo your company's future.

Hubstaff founder Dave Nevogt shares how to test your startup idea by analyzing model, market and concept.
Building a two-sided market is probably the hardest thing you can build as an entrepreneur. It's so hard that a few weeks ago, I organized a Marketplace

Molly Graham helped forge a work culture at Facebook that's withstood huge amounts of growth. Today, she's something of a rapid scaling expert. Here's the key to doing it right, she says.
There are already very good lists of startup lessons written by really talented, experienced people (here and here). I’d like to add another one. I learned these lessons the hard way in the past four years. If you’re starting a company, I hope you have an easier path.
Goods versus Services: The next trillion dollar opportunity Marketplace startups have done incredibly well over the first few decades of the internet, reinventing the way we shop for goods, but less so for services. In this essay, we argue that a breakthrough is on its way: The first phase of the internet has been...
I’m a startup product growth guy with a social gaming background. I currently work as VP of Growth at Relcy, a mobile search engine. A few companies I’ve worked with on growth in the past (HIRED $702…

There's lots written about how you should build software, but few concrete examples of the messy reality as implemented by startups. Here's our process.

The “unreasonable effectiveness” of data for machine-learning applications has been widely debated over the years (see here, here and…
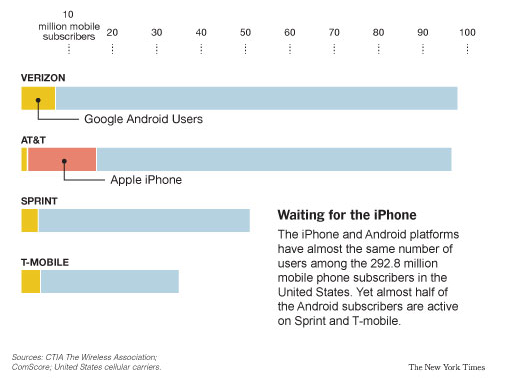
Apologies in advance: If you’re fluent in the language of accounting, please skip to the bonus Verizon iPhone feature at the end. What I’m about to describe will strike you as oversimplified and…

What happens on the other side of the acquisition doesn't get much startup press

I just spent a day working with Bob, the Chief Innovation Officer of a very smart large company I’ll call Acme Widgets. Bob summarized Acme’s impediments to innovation. “At our company we have a cu…

In the Creative Founder, students are paired semi-randomly, and then spend a semester trying to get to product-market fit. I always start them with market selection. A market has three key elements…

Dyson almost launched a robot vacuum. Back in 2001, after three years in development. Its first effort, shown to the British public in London looked nothing (and we mean nothing) like the eventual 360 Eye unveiled today. Sixteen years is a long time in tech. The DC06, as it was called, never made it past home-trial stages in 2012 -- apparently too pricey and heavy. Between then and now, technology got better. A lot better. At the Tokyo launch of its new robot vacuum, Sir James Dyson himself, told us how it all came together, and why it's not his native UK, but Japan, that'll get to buy it first.

Startup Metrics for Pirates - Download as a PDF or view online for free
Zapier has 3M+ users and generates $125M in ARR. At a $5B valuation, its fast-growing horizontal platform is unable to meet the demands of all of its customers. The increase of underserved Zapier customers presents an opportunity.

Before joining Wave four years ago, I spoke to a former employee about his experience. He said something that has stayed in my memory ever since: “Wave is really good at execution, so by working at Wave, you’ll learn how to execute very well.” Now that I’ve been here a while, I thought it would be good to write down what really good execution actually looks like in practice and the counterintuitive lessons I’ve learned along the way.

From Stripe to Notion, Cristina Cordova has worked on some of the biggest products in tech. She shares tactical tidbits on what she’s learned about about scaling companies and shaping your career.
How data businesses start, and how they keep going, and growing, and growing.

I used to be very anti-advertising. Fast forward two years and several pivots, and my slightly-less-early-stage business is doing $900 per month in revenue... from ads.

Every company makes decisions based on the highest paid person's opinion. It turns out it's just a hypothesis. Here's how to tame it.


How I Built This with Guy Raz · Episode

I first wrote this essay a few years ago. A founder mentioned it to me over the weekend, and so I decided to re-publish it here. One thing that's bothered me in the time since I wrote it is the way...

Check the requirements, book the viewing, let yourself in, and submit your application, all without emails or phone tag.

An open letter from a former Facebook and VMware engineering executive on how startups can best structure their release processes.
The marketplace revolution is still just beginning and the enterprise gateway is the newest type of marketplace.

One of social media's oldest companies is also its most undervalued.

The most popular products don’t become mass popular overnight. It’s a process. Usually they popularity is uneven, they are unknown in some niches, but very popular in another niches.

I learned from bosses & peers, including some famous peeps like Reed Hastings, Patty McCord, and Dan Rosensweig. But mainly I learned by doing, supercharged by feedback from many "Friends of Gib."

Apoorva Mehta’s grocery delivery app is now an essential—and booming—business. Now the 34-year-old billionaire has to show he can outfox Bezos, dodge an avalanche of new competitors and calm his rebellious workers and restless partners.


Some careers can be made on the back of a single, wonderful idea. We take a look at what that looks like, through Bill Gurley's VC career.

The pandemic has boosted interest in vending machine ownership. We surveyed 20+ operators to find out how much they make.

Even before the pandemic, it had started to unravel. What happens now that no one has a reason to dress up?

@mmcgrana: Patio11’s Law: The software economy is bigger than you think, even when you take into account Patio11’s Law.1 A few years ago, I woke up in Sunriver, OR, and went to make coffee. The house had one of those bed-and-breakfast-type coffee trays. Drip machine. A stack
It's been said that ideas don't matter, and that only execution does. I wholeheartedly disagree. You need both to succeed, but you can only get so good...

You probably think startups have nothing in common with a classical Chinese dance performance. You’re wrong.

Matt Meyers spent two decades at Weyerhaeuser dealing with product engineering, manufacturing, software engineering, product development, sales and

Canva are one of Australia's most successfull startups. In this case study we analyse how they use digital channels to attract and acquire new users

Most of the times, startup don't work. At some point it may make sense to either (1) give up on your original product and to sell the company, (2) shut down what you are doing and return money to investors, or (3) to pivot. You can read more on making the decision to give up in a future article. This post focuses on pivoting for small, early stage companies (e.g. 10 or fewer people).

I joked the other day that some of the best fairytales are written in Excel. While there isn’t a single magic number or set formula, understanding industry benchmarks can be really helpful to…

An MIT Sloan Ph.D. candidate discovered what turned skilled hobbyists into entrepreneurs.

The “traditional” user onboarding flows and walkthroughs are dead. Learn about the next era of user onboarding and how to adapt to the changes in your org.

This was first published on my mailing list The Looking Glass. Every week, I answer a reader’s question.

“We believe true equality is when spending more can’t buy you a better education.” – Duolingo founders When the language learning software company Rosetta Stone went public in 2009, they… Keep reading

Robert R. Taylor is a name you’ve probably never heard before. But this serial entrepreneur made his mark on the world of business by coming up with several products you are almost certainly very familiar with. Today we’re going to talk about, on the surface, the most boring of those- liquid hand soap. Something you can thank Mr. Taylor and [...]
Your phone increasingly knows what you’re taking a picture of. And which apps you have installed. So…

Create strong culture, stay laser-focused on problems, and set wildly ambitious goals
There is a story arc of the electric scooter market that took the world by storm in 2018, was second-guessed late in the year and has…

A discussion of the 9 core operating principles that world class companies tend to embrace, by NFX Managing Partner James Currier.

Recently, a founder asked to chat with me about SEO. During our call, the founder - whose startup is backed by a top-tier VC - said to me “I assume that you acquired your first users through paid marketing.” Really? Is this an assumption nowadays? Since we’ve raised money
PopSockets opted not to be a direct vendor to Amazon. Instead, it chose one major reseller to represent it on the marketplace. But, Amazon would not allow it. So, PopSockets walked away.

All things being equal, speed will determine whether your company succeeds or not. Here's how to make it core to your culture.

Accounting, bookkeeping, and tax tips to help you understand your small business finances.
-->
prodmgmt/analytics
categories:
tags: analytics prodmgmt
date: 26 Mar 2025
slug:raindrop-prodmgmt-analytics

How to build upon a previous experiment, without throwing it all away.

The authoritative guide on how Amazon does WBRs (from former exec Colin Bryar): how it works, how to do it, and how Amazon uses it to win.
At most small and medium-sized e-commerce retailers, prices are typically set and updated in an ad hoc fashion without one clear owner. The process often starts by using a gross margin target, followed by some comparison with competitors, and then some adjustments from there. Many of these retailers would quickly admit that this isn’t an optimal strategy, and that they are likely leaving money on the table — and they’re often right. The authors’ experience with price testing has shown that there is actually a significant amount of money left on the table when pricing is left un-optimized.

Two principles on collecting data, from the field of Statistical Process Control. As with most principles in SPC, this is both simpler and more important than you might think.

An obsessively detailed guide to Customer Lifetime Value techniques and real-world applications
These tools can help you analyze PPC competitors, track search trends or design ad creative – all without spending a dime.

8 stories · A guide to building an end-to-end marketing mix optimization solution for your organization.

Applying causal machine learning to trim the campaign target audience

How to compare and pick the best uplift model

This article will take you through everything about Cohort Analysis that you should know. What is Cohort Analysis in Data Science?
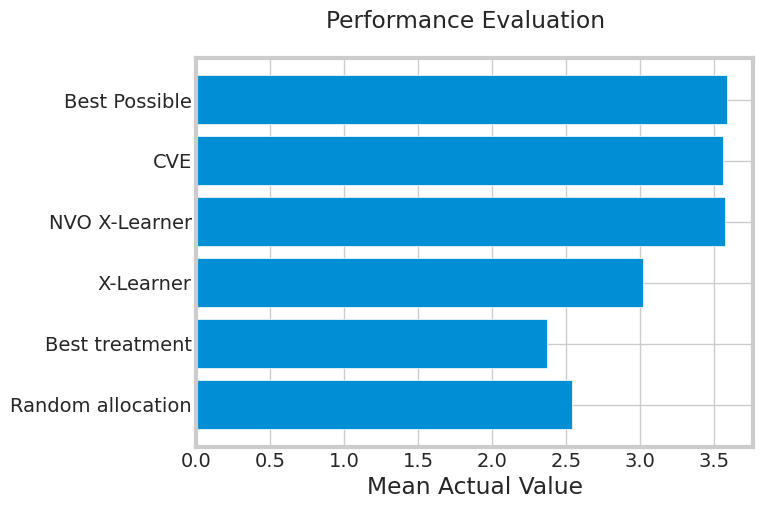
How to adjust CATE to consider costs associated with your treatments

Questions on A/B testing are being increasingly asked in interviews but reliable resources to prepare for these are still far and few…

I recently rewatched "The Wire". The show's central theme is about counter-productive metrics and their corrupting influence on institutions. I've noticed hints of this pattern in software engineering, too
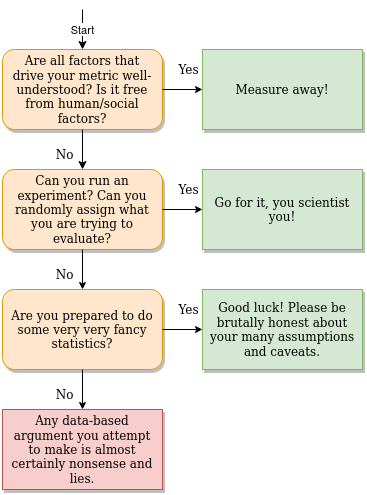
Software culture and the abuse of data
Use these tips to quickly analyze performance data and identify high-impact PPC optimizations that will move the needle.
In many board rooms, the most important go-to-market number this quarter is pipeline health. For some companies, the pipeline may be less clear than a quarter or two ago. Summer seasonality may play a role. Macroeconomics might also be lurking within the numbers. Pipeline fluctuations are normal. But any meaningful & unexpected surprise warrants introspection. Pipeline analysis often has four parts: Craft the sales sandwich to predict your GTM conversion rates & determine if close rates have changed in parallel.
Amazon will continue to be highly competitive. Want to be successful? Optimize your product listings to the fullest with these tips.

There is a huge and ever-widening gap between the devices we use to make the web and the devices most people use to consume it. It’s also no secret

Over the past few years, marketing on the web has become way too much fun. I remember trying to figure out what “hits” on awstats [http://awstats.sourceforge.net/] meant in high school, and I distinctly can recall how disappointed I was when I found out the true meaning. Nowadays,

Analyzing the SERPs for these micro intents will help you create the right content that a searcher will want to find.
Pricing is hard. Make it too low and you miss out on profit; too high and you miss out on sales. These pricing experiments will help you get it right.
“My biggest surprise was when we launched the Facebook app and it didn’t go viral” -Startup CEO quote “The month after we ...

Knowing what to test and how to interpret the results based on nuances and oddities of experiments is an important skill for people, not automations.

Startup Metrics, a love story. All slides of an 6h Lean Analytics workshop. - Download as a PDF or view online for free

Multivariate tests indicate how various UI elements interact with each other and are a tool for making incremental improvements to a design.
Shoppers' actions on an ecommerce site create opportunities for automated, triggered emails. Such behavior-based email automation is a sure-fire tactic to drive revenue.

Conjoint analysis is a highly effective means of market research, capable of informing a company’s pricing strategy and product development.

Conjoint analysis is the optimal market research approach for measuring the value that consumers place on features of a product or service. Learn more!
Startup Metrics for Pirates - Download as a PDF or view online for free
The way we live our lives has an impact on our work. Long lists of typical chores may turn your
Competitive poaching refers to the practice of bidding on ads for a competitor’s search terms, in order to poach customers searching for that brand. It’s a common tactic in the world of digital ads — but is it effective? The author shares results from the first-ever empirical study of this practice, which found that poaching can work well for higher-end brands, but may backfire for lower-end or mass market offerings. Specifically, the study found that when an ad poached customers who searched for a high-end brand, users clicked on it more, but when an ad poached a low-end or mass market target, users were less likely to click. Of course, the author notes that clickthrough rate is just one metric, and there may be other ways in which a poaching campaign could be harmful or beneficial. But these findings can help marketers add a bit of science to the art that is digital advertising, helping them to optimize campaigns for their unique products and customers.

It's time to optimize for People Also Asked questions asked around and about your brand in Google's SERPs. Here's why.
The most consistent sales leader I’ve worked with hit plan 27 consecutive quarters. How can a sales leader develop similar repeatability? Much goes into it here are the reports he used to manage his team at the board level. The PQR (pipeline-to-quota) funnel is first. Pipeline is the total value of the accounts within a stage or later. Quota is the aggregate quota on the street for the quarter. Divide P by Q to get PQR.
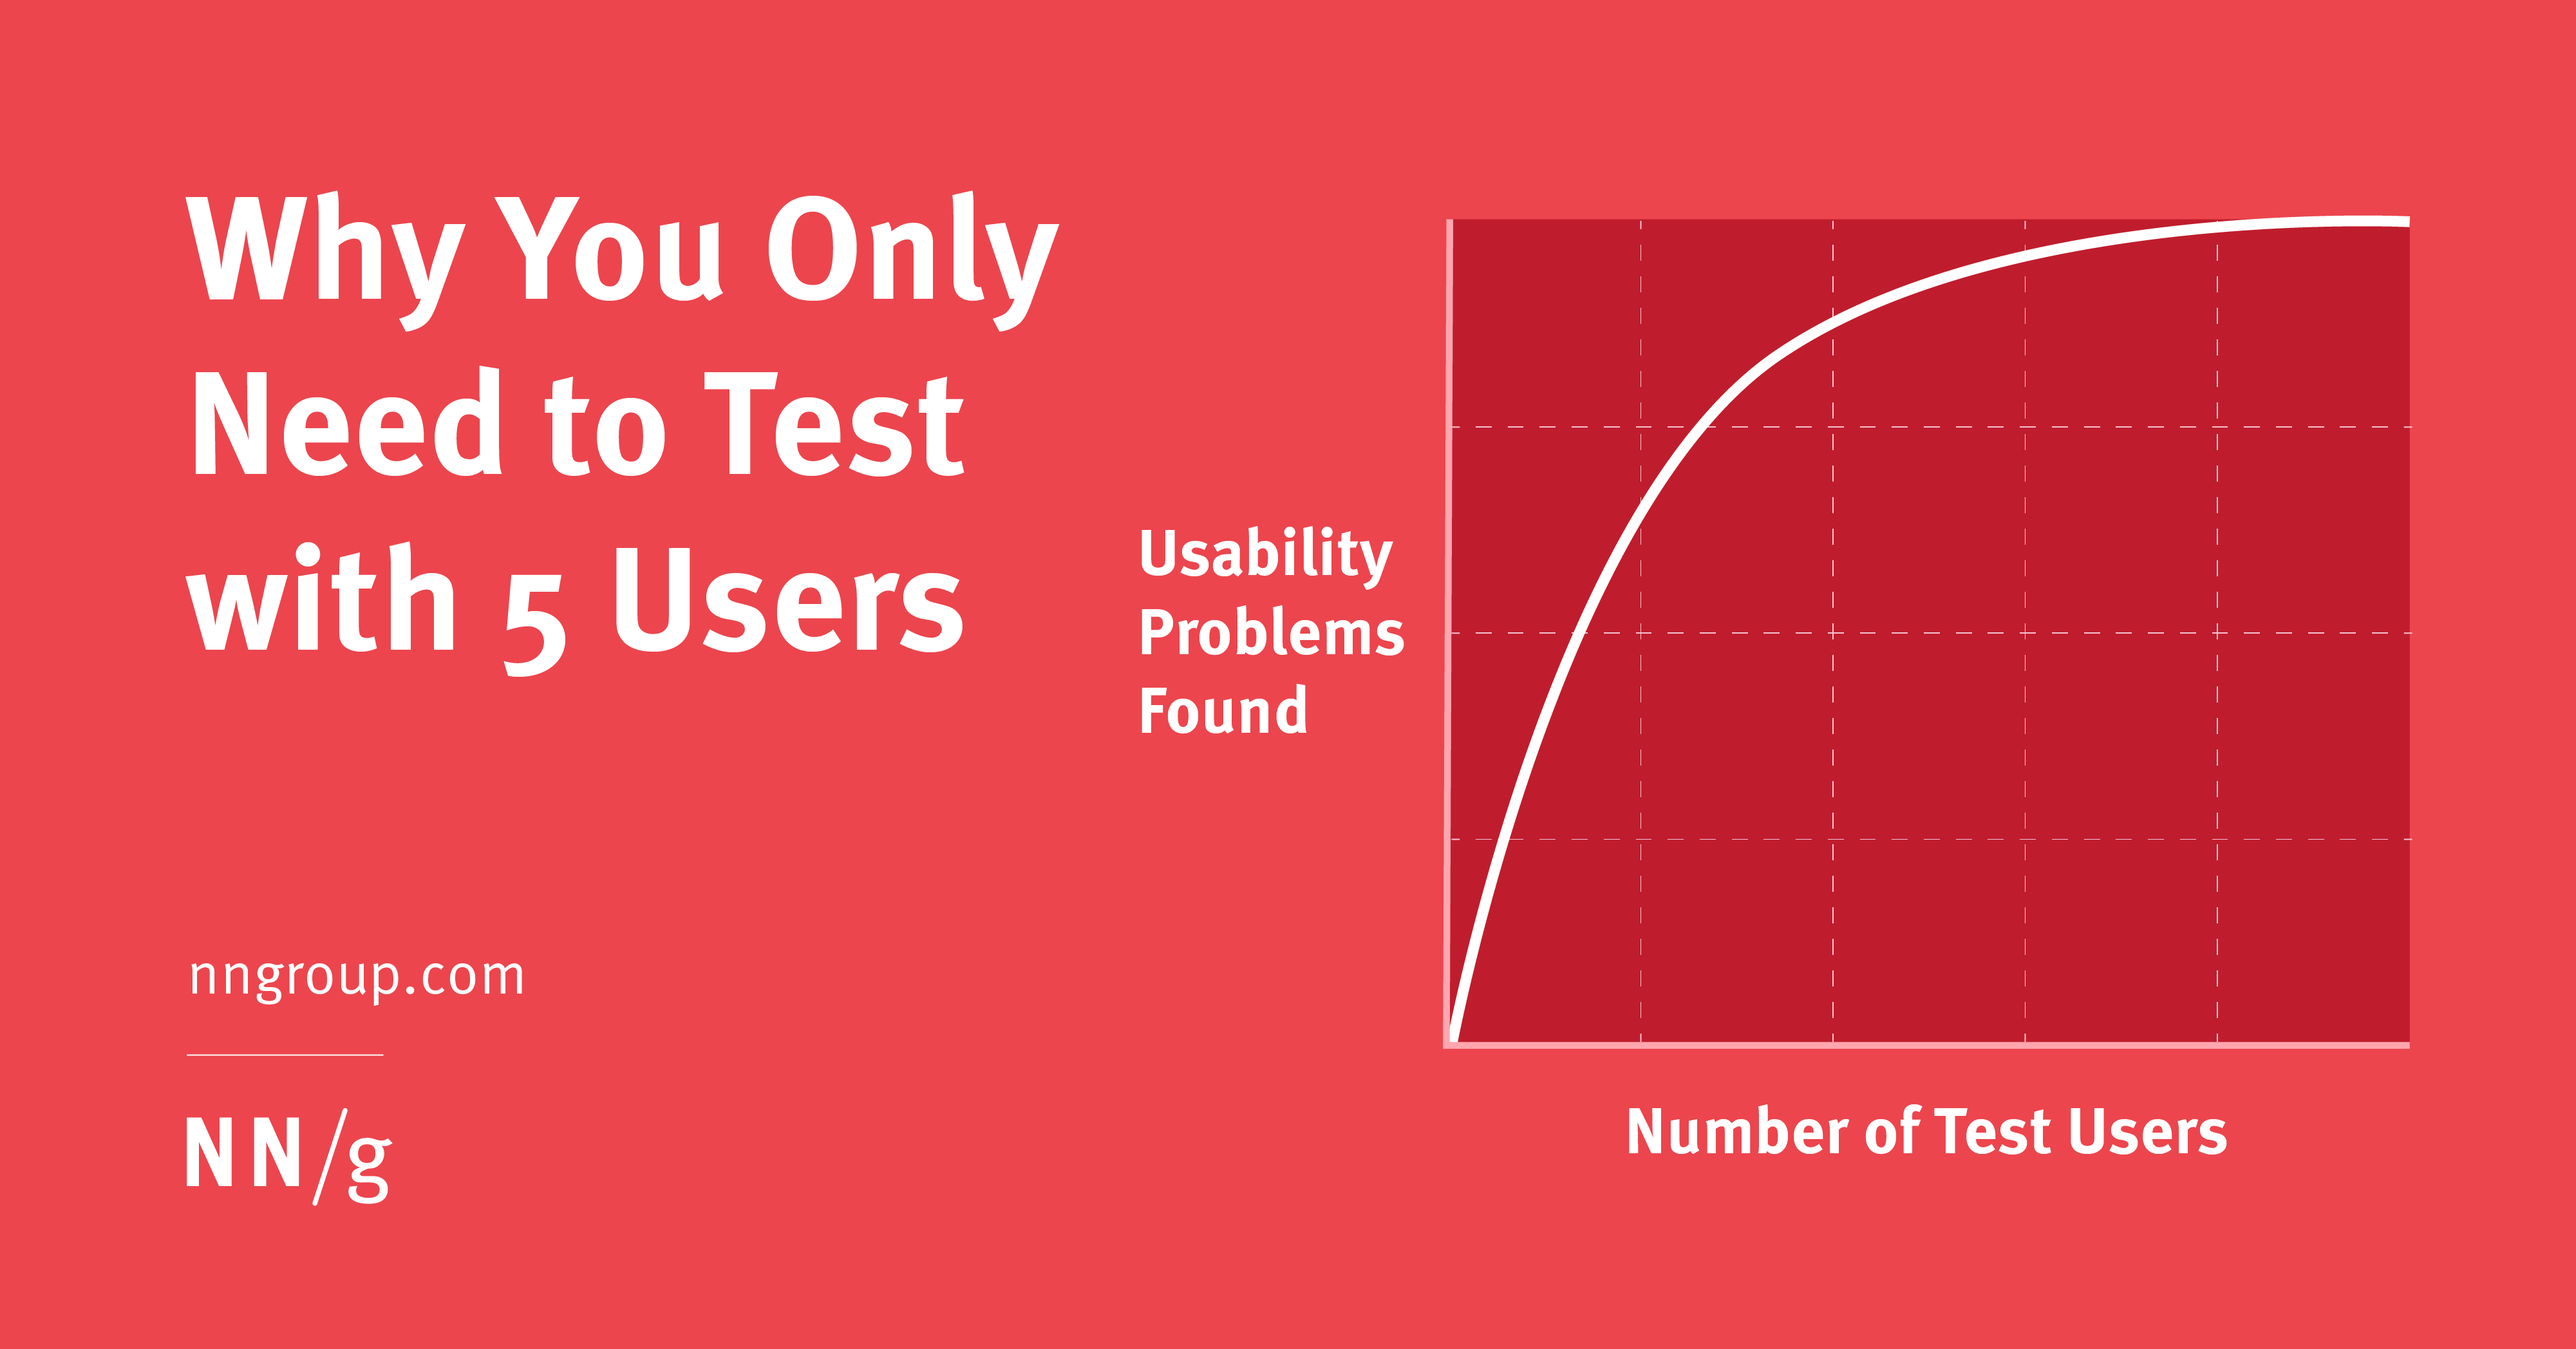
Elaborate usability tests are a waste of resources. The best results come from testing no more than 5 users and running as many small tests as you can afford.

Common mistakes to avoid when you’re getting started with experimentation
Should we still be talking about online and offline retail, or about trucks versus boxes versus bikes?

Net dollar churn is a more value-driven way of looking at churn.

The best way to optimise your website is usually the simplest.
There’s a reason that online ticket sellers hit you with those extra fees after you’ve picked your seats and are ready to click “buy.” Pure profit. A

The Guide to Product Analytics taps dozens of product leaders (from companies like Google, Twitter, and LinkedIn) to break down how PMs can use product analytics to drive product-led growth.


Big success. Bigger failure. And lots of lessons. Learn why building a growth team may be a multi-million dollar mistake.

Every website or PWA you build should automate as much prospecting and selling as possible. The only thing is that visitors enter websites with various mindsets, depending on which part of the buying stage they’re at. This means that you can’t just take every person who enters the site through the same path. You have to design a custom sales funnel (or pathway) for each kind of buyer. In this article, Suzanna Scacca will tell you what you need to keep in mind.

Increasingly, companies are using experiments to guide them in their decision making—but many are still missing opportunities, or are failing to implement experiments well. When it comes to the rollout of new products, one particularly effective new kind of experiment involves randomizing the introduction of new products across a set of markets. Uber used this strategy before rolling out its Express Pool service, and Airbnb did the same before rollout out a new landing-page design. In both cases, the companies gathered data that allowed them to roll out their products with confidence that they would succeed—as indeed they did. Many companies, even those not in the tech sector, can benefit from this kind of experimentation, especially if they follow a few basic guidelines.
Google Analytics is a powerful, free web analytics platform. However, it has gaps that are better served by other tools. I'll address those gaps and tools in this post.
Update 2016-10-18: This tutorial has been updated to reflect the latest version of my stack (now with Drip!). I’ve also updated pricing info (it’s technically a $0 stack now) and screenshots. The original outdated article is archived here. “Just tell me what to do so I can stop

“That’s just one person” and “Our real users aren’t like that” are common objections to findings from qualitative usability testing. Address these concerns proactively to ensure your research is effective.
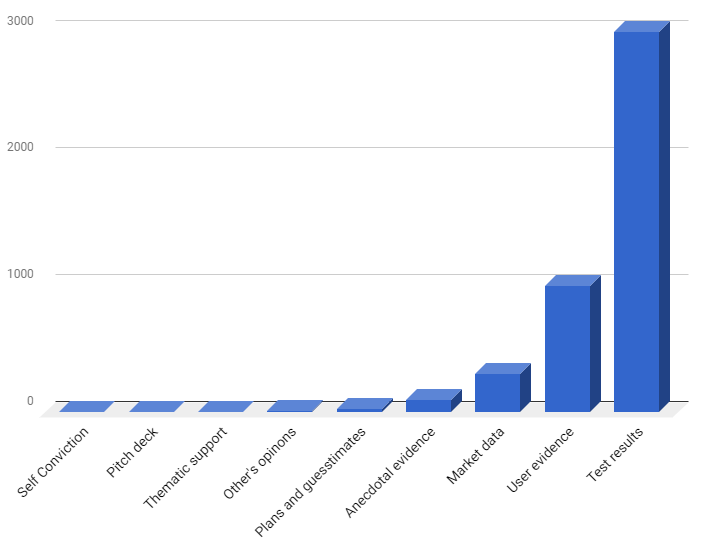
Finding and building the next big idea is the holy grail of any tech company. Unfortunately the statistics are against us: when subjected…
The biggest question in ecommerce A/B testing is not “how.”


At some point, almost every company faces questions like How good are the customers that we acquire? How do they
-->
prodmgmt/marketing
categories:
tags: marketing prodmgmt
date: 26 Mar 2025
slug:raindrop-prodmgmt-marketing

Proprietary items work best if retailers differentiate them through either cost or innovation and are thoughtful about choosing categories, experts say.
General Partner Connie Chan on how leading brands are using AI and other technology to combine the serendipitous discovery of offline shopping with the infinite options of online shopping. Today, most of the Western world revolves around search-based online commerce. This means that most shoppers type directly what they want into a store search bar,...
The world's leading online dictionary: English definitions, synonyms, word origins, example sentences, word games, and more. A trusted authority for 25+ years!
Whether or not you should pursue a catalog strategy is a question that deserves significant thought. As digital marketing becomes more complex, it may make a lot of sense to send out correctly designed catalogs to the right customers. For e-commerce retailers without physical stores, catalogs can effectively mimic stores’ sensory experiences to enhance customer affinity. For multichannel retailers, by understanding the channel preferences of current customers through transactional data, multichannel retailers can add an effective catalog marketing channel to their store and e-commerce channel strategies.

Not every business needs to have habit-forming products. Here's how two companies hooked customers and formed habits with products they rarely used.
When it comes to making money online you’re going to have a lot of options at your disposal. Frankly, it can be quite overwhelming just choosing an online
Your #1 resource for digital marketing tips, trends, and strategy to help you build a successful online business.
The Swiss pharmaceutical giant Roche is nothing if not determined in its quest to acquire Illumina, the San Diego-based leader in genetic-sequencing equipment. In January, after Illumina’s board rebuffed Roche’s initial overtures, Roche made a $5.7 billion tender offer directly to shareholders. When that didn’t succeed, it extended the offer to midnight last Friday. Now […]

As consumers skip ads and streaming content balloons, brands aim to be everywhere all at once.
Knowing what to test and how to interpret the results based on nuances and oddities of experiments is an important skill for people, not automations.


Other than slashing prices

Tips from successful campaigns promoting everything from shapewear to prostate health.

A deep dive into our process for identifying the optimal B2B SaaS Marketing Channels for our clients, or Customer-Channel Fit.
The way we live our lives has an impact on our work. Long lists of typical chores may turn your
Competitive poaching refers to the practice of bidding on ads for a competitor’s search terms, in order to poach customers searching for that brand. It’s a common tactic in the world of digital ads — but is it effective? The author shares results from the first-ever empirical study of this practice, which found that poaching can work well for higher-end brands, but may backfire for lower-end or mass market offerings. Specifically, the study found that when an ad poached customers who searched for a high-end brand, users clicked on it more, but when an ad poached a low-end or mass market target, users were less likely to click. Of course, the author notes that clickthrough rate is just one metric, and there may be other ways in which a poaching campaign could be harmful or beneficial. But these findings can help marketers add a bit of science to the art that is digital advertising, helping them to optimize campaigns for their unique products and customers.

American consumers can’t resist the lure of a well-designed container. Of all the things I’ve purchased during the pandemic, the most useful has been a box cutter.

European stores like Marks & Spencer and Monoprix, and U.S. chains like Whole Foods, understand the powerful "appetite appeal" of grocery labels.

After more than a decade of running B2B growth teams at PayPal and investing at 500 Startups, Matt Lerner now spends his days helping early-stage startups with growth. He's seen firsthand how changes in a handful of words can yield jaw-dropping differences in conversion — and accelerate a startup's course to product/market fit. Here, he makes the case for starting with language/market fit first, and offers up his 4-step process for getting there.

Want to improve your product's positioning but not sure where to start? This article is going to give you everything you need to get started including what positioning is, why it matters, and how to improve it.
Building white label products is more profitable than starting a new design every time. Learn how to properly implement white labelling.

Not open to the public, this expansive archive schools marketers in the art of pitchmanship

The true star of the Akutagawa Prize-winning novel Convenience Store Woman is the convenience store itself. But what is it that makes these shops so magical?
3-min marketing recommendations from the latest scientific research. Join 30,000+ marketers, for $0.
Although the protection of secrets is often vital to the survival of organizations, at other times organizations can benefit by deliberately leaking secrets to outsiders. We explore how and why this is the case. We identify two dimensions of leaks:

Although there may be risks for companies in leaking secrets, the researchers make a strong case for doing so when appropriate. It appears that some of the most prolific and careful leakers are also among the most profitable companies in the world.
You’re a few weeks into managing a beta test for a new product your company plans to release soon. You get an email from someone on your beta team that there has been a leak online. One of your testers took a picture of your company’s new gadget fresh out of the box and posted […]

Today’s films are brimming with products from big-name brands. How exactly do these partnerships work? And is the payoff worth it?

In today's consumer-centric world, packaging designs hold a very important place! A unique and attractive packaging design is what captures the interest and attention of your consumer. It pulls the consumer towards the product and even drives them to purchase it. Hence, allocating time, effort, and energy to create an appealing packaging design is extremely
Looking to grow your affiliate marketing site but aren't sure which affiliate network is right for you? Here's everything you need to know.
Tips on running successful Black Friday sales for creators and Indie Hackers
Packing an astonishing amount of information into an easy-to-digest visual, it's well worth the download.

Dollar Tree has struggled to grow Family Dollar because of its different business model.
PopSugar said it expects to have 20,000 subscribers by year's end to its text message program, which it's used to sell protein bars and housewares.


We explain how we came to spend $20,000 on this domain, and the incredible business opportunities that exist, waiting for someone to bring them to life.
To build word of mouth, try these strategies.

Consumers are primed to see ".99," but prices that deviate from that format can affect the way they interpret the cost.
-->
prodmgmt/discovery
categories:
tags: discovery prodmgmt
date: 26 Mar 2025
slug:raindrop-prodmgmt-discovery

Discovery is challenging; it can be hard to know what to research, how to do discovery as a team, and how to get buy-in. Follow these 7 tips for smoother discovery efforts.

This is a series where we delve into the world of product management. This week we discuss the art of understanding your users.

Lessons learned from a year of startup life.

And how can you figure it out what they really need
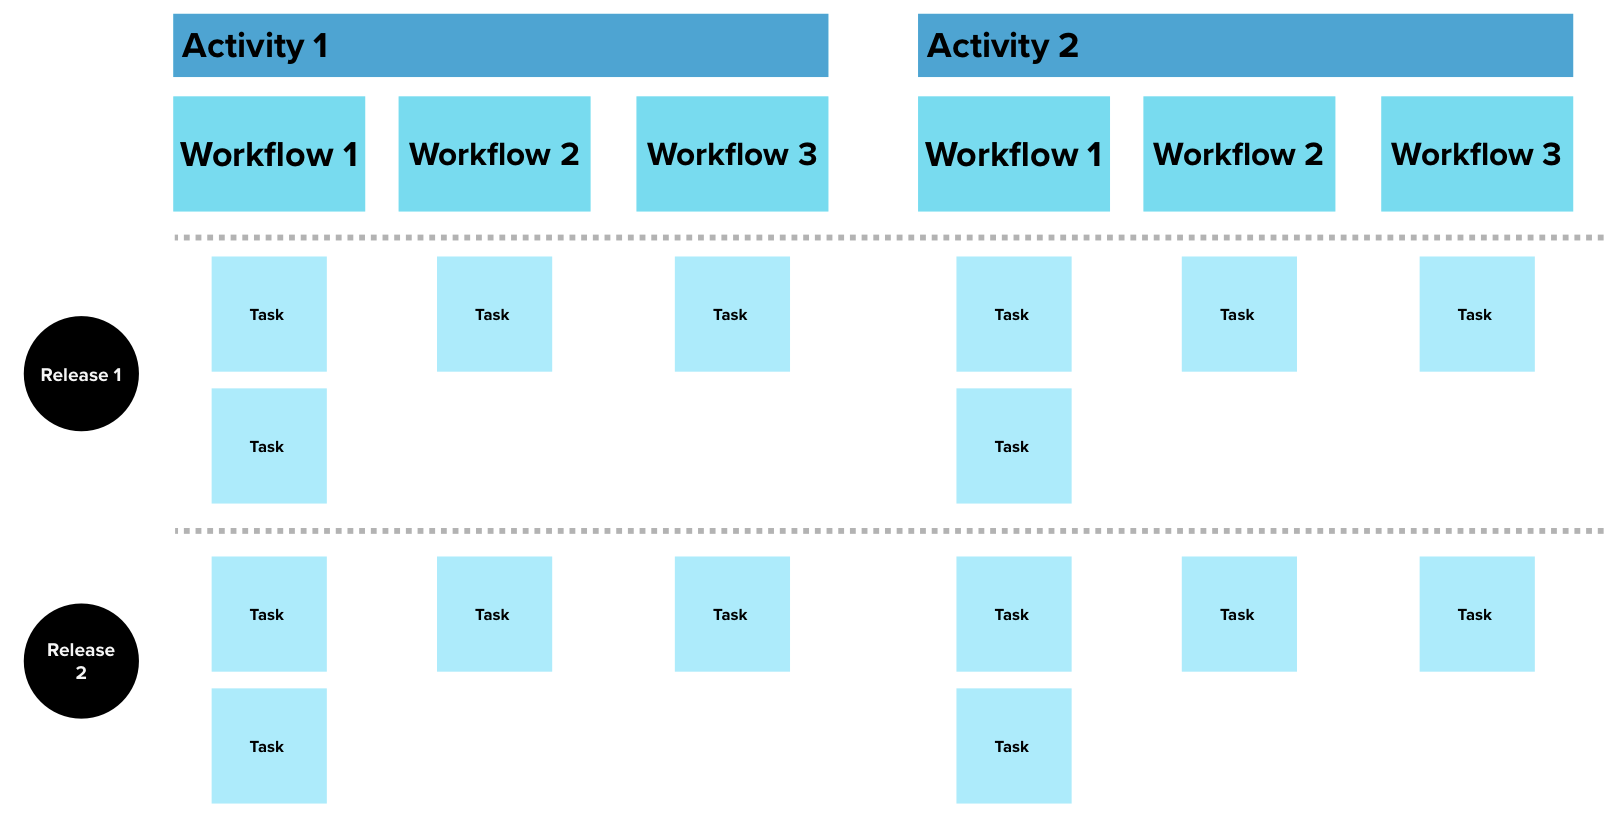
How Data Scientists can learn from how a Product Manager prioritizes features and requirements to build a successful product.
General Partner Connie Chan on how leading brands are using AI and other technology to combine the serendipitous discovery of offline shopping with the infinite options of online shopping. Today, most of the Western world revolves around search-based online commerce. This means that most shoppers type directly what they want into a store search bar,...

A journey of a thousand miles begins with a single step Lǎozi 老子 I just had lunch with Shenwei, one of my ex-students who had just taken a job in a mid-sized consulting firm. After a bit of catch…
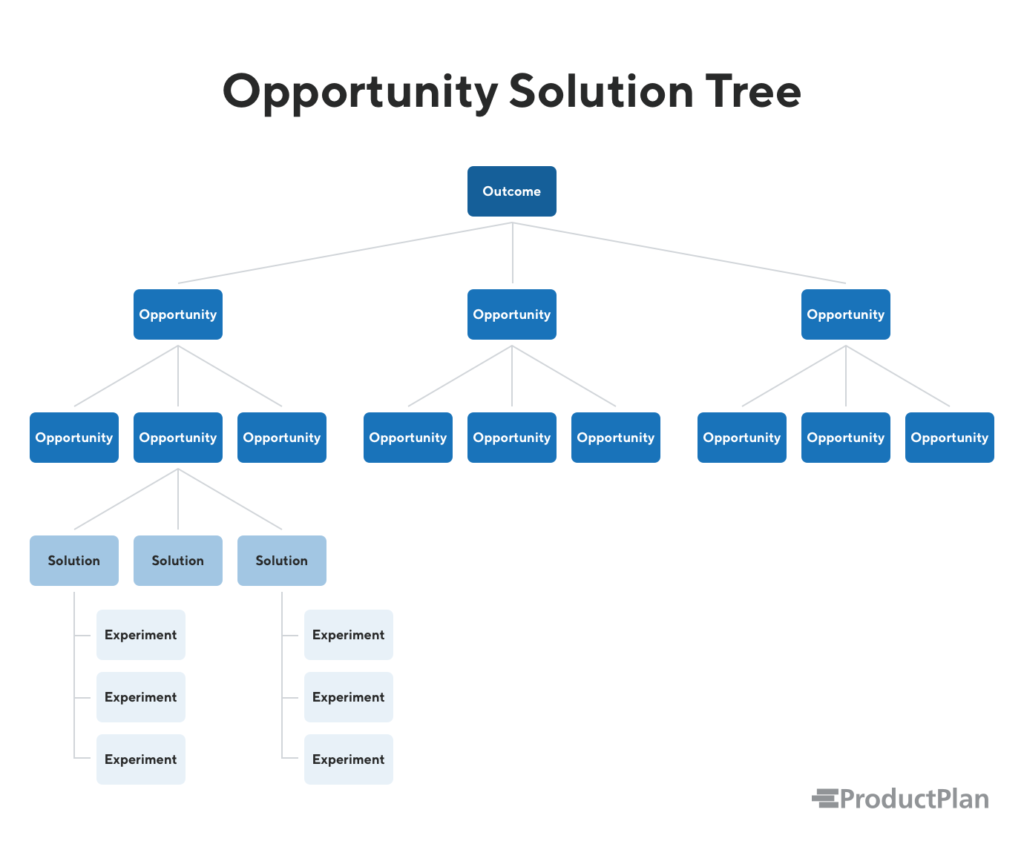
What is an Opportunity Solution Tree? Learn more about opportunity solution trees and the 4 steps involved in creating them.

The product management and startup worlds are buzzing about the importance of "validation". In this entry, I'll explain how this idea orig...

Criticizing Voice of the Customer (VOC) programs is like speaking out against motherhood and apple pie. The last time I criticized VOC programs, someone left a comment chastising me for presuming that a bank could know what its customers wanted without asking them.
Hubstaff founder Dave Nevogt shares how to test your startup idea by analyzing model, market and concept.

Conversations with customers are valuable, but they have to be the right type of conversations – not merely questions about forgotten passwords and the like. They have to add value, for you, and them.

Hits are more valuable than ever, mostly because they're more rare than ever. The Zipf Distribution, also described in Chris Anderson's Long Tail, helps us understand just how valuable hi…
This copy is for your personal, non-commercial use only. Distribution and use of this material are governed by our Subscriber Agreement and by copyright law. For non-personal use or to order multiple copies, please contact Dow Jones Reprints at 1-800-843-0008 or visit www.djreprints.com.

It's OK to ask a B2B prospect if they would use your product during customer discovery. Just don't to stop at "Yes" and assume validation or a likely sale.

Teams that build continuous customer discovery into their DNA will become smarter than their investors, and build more successful companies. — Awhile back I blogged about Ashwin, one of my ex…

An online Game of Thrones quiz got a million online hits for HBO.
Pricing is one of the most challenging decisions for any startup. One of the simplest ways of discovering customer willingness to pay is simply to ask them. At first blush, that might seem a reasonable and effective solution, it is prone to wild inaccuracy. Absolute pricing judgments are hard without reference points. For example: How much would you be willing to pay for a new iPhone? It’s a very challenging question to answer in the abstract.

Apple has carefully guarded the podcast directory, persuading podcasters that ‘winning’ here is the shortcut to building a popular podcast. But they’re terrible at introducing pod…
Preface: the assumption for this essay is that you're building a B2B app, and you have something built but you're having trouble getting people to pay for it There are three problems with getting your first few customers: You (probably) don't know how to sell things You don't know who you're selling to You don't even really know what you're selling Nobody tells you how to answers these questions, and so most people go out

Michael Sippey has been building tech products for over 20 years. His most valuable ideas, though? They came from speaking with customers. Here's how.

‘The Problem with…’ series covers controversial topics related to efforts to improve healthcare quality, including widely recommended but deceptively difficult strategies for improvement and pervasive problems that seem to resist solution. The ‘5 whys’ technique is one of the most widely taught approaches to root-cause analysis (RCA) in healthcare. Its use is promoted by the WHO,1 the English National Health Service,2 the Institute for Healthcare Improvement,3 the Joint Commission4 and many other organisations in the field of healthcare quality and safety. Like most such tools, though, its popularity is not the result of any evidence that it is effective.5–8 Instead, it probably owes its place in the curriculum and practice of RCA to a combination of pedigree, simplicity and pedagogy. In terms of pedigree, ‘5 whys’ traces its roots back to the Toyota Production System (TPS).9 It also plays a key role in Lean10 (a generic version of TPS) as well as Six Sigma,11 another popular quality improvement (QI) methodology. Taiichi Ohno describes ‘5 whys’ as central to the TPS methodology:The basis of Toyota's scientific approach is to ask why five times whenever we find a problem … By repeating why five times, the nature of the problem as well as its solution becomes clear. The solution, or the how-to, is designated as ‘1H.’ Thus, ‘Five whys equal one how’ (5W=1H). (ref. 9, p. 123) This quote also makes the case for the technique's simplicity. Asking ‘why’ five times allows users to arrive at a single root cause that might not have been obvious at the outset. It may also inspire a single solution to address that root cause (though it is not clear that the ‘1H’ side of the equation has been adopted as widely). The pedagogical argument for …

I’ve been working on a marketing automation tool (more on that at the end of the post). Or rather, I’ve been working on an idea for a marketing automation tool as I don’t want a single line of code written before I’d experienced a notable pull from target customers. (This may sound like I am clever/…

A conversation with Bruce La Fetra on customer interviews. We compare notes on how to organize findings and take best advantage of the insights gleaned.
Your #1 resource for digital marketing tips, trends, and strategy to help you build a successful online business.


Great insight moves your career, organization, or business forward. The problem? Most people are terrible at asking questions. Learn from the pros how to do it right.

Forrester is a leading global market research company that helps organizations exceed customer demands and excel with technology. Learn how Forrester can help.
There has been a lot of discussion in the design world recently about "change aversion." Most of the articles about it seem to be targeting the new Google redesign, but I've certainly seen this same discussion happen at many companies when big changes aren't universally embraced by users.

If you are building a product, you should always speak with customers and test your idea before. But you probably don’t know that *you *might be making some of the most common mistakes when running your experiments. Mistakes include testing the wrong aspect of your business, asking the wrong questions and neglecting to define a criterion for success. In this article, Grace Ng will show you a guide to designing quick, effective, low-cost experiments.
Common mistakes to avoid when you’re getting started with experimentation

From the high-level perspective of what makes for a great design leader, to the tactical suggestions around the slide that needs to be in your portfolio presentation, Twilio & Segment's Hareem Mannan shares useful advice for every stage of a designer's career.

Almost exactly a year ago, I started a little boutique software company called Report Card Writer. As the name suggests, my flagship software product does pretty much one thing: it helps teachers write report card comments faster. Its core technical functionality is part survey form, part template-filler-inner, with a few extra bolt-on features that make it easy to create and populate the form and template, respectively.

Every week, I talk with CEOs who tell me they want to speed up innovation. In fact, they want to schedule it. Recently a product leader shared with me an OKR to ship one major innovation each quarter, measured as “users will give each innovative feature a top rating.” This
:extract_focal()/https%3A%2F%2Fs3.amazonaws.com%2Fpocket-syndicated-images%2Farticles%2F326%2F1566916077_direct.jpg)
How to ask better questions.

It’s so important to test your new product idea long before you feel ready.

Unlock valuable insights for effective discovery by decoding product metrics. Learn how to leverage these metrics to make informed decisions and optimize your product development process.

After more than 45 years as an off-pricer, the retailer hit the skids when COVID-19 forced its doors shut and zeroed out revenue. Now it hopes to slim down in Chapter 11.

We should invest at least as much time in understanding our customers as we do in optimizing our product development process.

Confirming what people already believe can sometimes help organizations overcome barriers to change.

Dear designers/marketers (and innocent person reading this note), So, you’re doing customer interviews and user research, good for you! You’ve joined the fold of responsible, empathetic, and effective product design and marketing professionals. But you sound like a robot when you email me. Here are some questions from user testing emails & surveys I’ve received […]
-->
prodmgmt/behavior
categories:
tags: behaviors prodmgmt
date: 26 Mar 2025
slug:raindrop-prodmgmt-behaviors

:extract_focal()/https%3A%2F%2Fcdn.theatlantic.com%2Fassets%2Fmedia%2Fimg%2Fmt%2F2019%2F03%2FGettyImages_103742864%2Flead_720_405.jpg%3Fmod%3D1552587838)
Correction fluids have improbably outlasted the typewriter and survived the rise of the digital office.

Learn how to create customer habits using powerful triggers like time, mood, location, and social influences. Discover techniques to boost product usage.

Unsure where to start? Use this collection of links to our articles and videos to learn about some principles of human psychology and how they relate to UX design.
On a flight from Paris to London in 1983 Jane Birkin, an Anglo-French chanteuse and actress, spilled the contents of her overstuffed straw...
by John MahoneyThis is a bucket of chum. Chum is decomposing fish matter that elicits a purely neurological brain stem response in its target consumer: larger fish, like sharks. It signals that they should let go, deploy their nictitating ...
Why might people decline an offer of up to $10,000 just to keep their feet on the ground?
Not every business needs to have habit-forming products. Here's how two companies hooked customers and formed habits with products they rarely used.
Many new products fail because their creators use an ineffective market segmentation mechanism, according to HBS professor Clayton Christensen. It's time for companies to look at products the way customers do: as a way to get a job done.
It can be more important than word of mouth.
01 Intro One of the best books I have read in the last few years is The Elephant in the Brain by Robin Hanson and Kevin Simler. The book makes two main arguments: a) Most of our everyday actions can be traced back to some form of signaling or status seeking b) Our brains deliberately hi

New research indicates that consumers are catching on and may be annoyed by certain nudges, potentially limiting their effectiveness.

Your product can’t suck. That’s a given. But it’s also not enough to be a good product that doesn’t hook your customer and connect to their pain points.
Are consumers more likely to buy if they see the price before the product, or vice versa? Uma Karmarkar and colleagues scan the brains of shoppers to find out.

Hello, my name is Andrew, and I can’t stop disagreeing.

From ATMs to automated checkouts to fast food.

The ability to get issues on the table and work through them constructively is critical to having a healthy culture. Managers can normalize productive conflict on your team by using an exercise to map out the unique value of each role and the tensions that should exist among them. Draw a circle and divide that circle into enough wedges to represent each role on your team. For each role, ask: What is the unique value of this role on this team? On which stakeholders is this role focused? What is the most common tension this role puts on team discussions? Answer those questions for each member of the team, filling in the wedges with the answers. As you go, emphasize how the different roles are supposed to be in tension with one another. With heightened awareness and a shared language, your team will start to realize that much of what they have been interpreting as interpersonal friction has actually been perfectly healthy role-based tension.
Tips from successful campaigns promoting everything from shapewear to prostate health.
There has been a lot of discussion in the design world recently about "change aversion." Most of the articles about it seem to be targeting the new Google redesign, but I've certainly seen this same discussion happen at many companies when big changes aren't universally embraced by users.
Driven by buyers' need for consistency and explanation, the most popular pricing method uses a surprisingly simple formula based on size.
A Guide to Reddit, Its Key Competitive Advantages, and How to Unbundle It

The history of technology is one of subtracting humans and replacing them with machines. Do the unintended consequences include creating shoplifters?

The best detectives seem to have almost supernatural insight, but their cognitive toolkit is one that anybody can use

As Spotify turns 15 this month, we look at 15 ways the streaming giant has changed, reinvented and reshaped music and the music business.
:extract_focal()/https%3A%2F%2Fimages.theconversation.com%2Ffiles%2F257627%2Foriginal%2Ffile-20190207-174890-1btlu70.jpg%3Fixlib%3Drb-1.1.0%26q%3D45%26auto%3Dformat%26w%3D496%26fit%3Dclip)
Think you got a good deal? Look again.

Imagine you could work more and be wildly productive. And you wouldn’t need to force yourself to work.

An introduction to forming hypothesis statements for product experimentation.
:extract_focal()/https%3A%2F%2Fpocket-syndicated-images.s3.amazonaws.com%2Farticles%2F3373%2F1582216096_GettyImages-1142992009.jpg)
Some products sell themselves, but habits don’t. They require a bit of finesse.
Hello, my name is Andrew, and I can’t stop disagreeing.

Leaders need to lead by example using OKRs, showing that they are equally as committed to successful outcomes as anyone on the front lines of the business.

Consumer needs spark consumer journeys. How can marketers identify those needs and address them? The latest consumer research from Google will help.

Nir Eyal’s Hooked Model explains how games keep players coming back.

Understanding user behavior is key to understanding how users interact with your product. Here are 15 steps to analyze & change their interactions to your benefit.

The mysteries of consumer behavior, explained by ice cream and independent bookstores.
-->
prodmgmt/programming
categories:
tags: prodmgmt programming
date: 26 Mar 2025
slug:raindrop-prodmgmt-programming

By choosing open-source alternatives to commercial proprietary software, it not only save money but...

Quote "ChatGPT is like a genie in a bottle, but instead of granting you three wishes, it gives you endless responses until you realize you've been chatting with a machine for hours." 😂
Meta descriptions do not influence organic rankings. But the descriptions appear in search snippets more often than not and thus impact clicks on organic listings.

If you got to here, it means your project is moving forwards. That is great! As you probably know, organisation is vital in mobile apps development. That is why the development process includes important tools and concepts, such as roadmaps and prioritisation, that help developers build valuable pro

Having a psychological approach to creating content helps you craft more effective messages to the right audience.
Software and tools not only help you manage your time better but provide helpful insights that you wouldn't otherwise see in a Google or Facebook interface.
In many board rooms, the most important go-to-market number this quarter is pipeline health. For some companies, the pipeline may be less clear than a quarter or two ago. Summer seasonality may play a role. Macroeconomics might also be lurking within the numbers. Pipeline fluctuations are normal. But any meaningful & unexpected surprise warrants introspection. Pipeline analysis often has four parts: Craft the sales sandwich to predict your GTM conversion rates & determine if close rates have changed in parallel.

Go-to-Market Plan [Product Name] [author1@, author2@...] Last Updated: [ _/_/_ ]

I was recently talking with Mark Roberge, CRO at Hubspot, for a podcast we’re launching soon. I asked him, “What is a common question that…

One of my favorite things about Ruby on Rails is that it’s a very opinionated framework. It makes key decisions up and down the technology stack so that I don’t have to. As DHH puts it, Rails is omakase: A team of chefs picked out the ingredients, designed
Hits are more valuable than ever, mostly because they're more rare than ever. The Zipf Distribution, also described in Chris Anderson's Long Tail, helps us understand just how valuable hi…
I’m a startup product growth guy with a social gaming background. I currently work as VP of Growth at Relcy, a mobile search engine. A few companies I’ve worked with on growth in the past (HIRED $702…

[Project Name] [one-line description] Team: [Awesome] Contributors: [PM], [Designer], [Engineer], [Analyst] Resources: [Designs], [Analytics], [Notes] Status: Draft / Problem Review / Solution Review / Launch Review / Launched Last Updated: Thursday, May 21, 2020 Problem Alignment Describe...

We compiled this official guide based on conversations with hundreds of product managers in our PMHQ community who revealed the most popular product management tools and product management tools that they currently use on the job. 64 Best Product Management Tools 2024 The following are the best tools for product management according to their main functions. They are divided into different categories such as collaboration, product roadmap, product management, etc. Product Management...

Like CEOs, data-driven product managers need a variety of different tools, skills, and capabilities. Here's the tools product managers need to succeed.

Use a flexible responsibility-assignment matrix to clarify UX roles and responsibilities, anticipate team collaboration points, and maintain productivity in product development.

Check this unique list of handy apps that can help you multiply your website’s visitor or paying customer count without bleeding too much cash.
CommerceHub and ChannelAdvisor are now united as Rithum. We empower top brands, suppliers, and retailers with durable, profitable e-commerce solutions.
The way we live our lives has an impact on our work. Long lists of typical chores may turn your
Optimizing content for organic rankings requires knowing how Google will interpret searchers' intent — informational, commercial, or navigational.
Like CEOs, data-driven product managers need a variety of different tools, skills, and capabilities. Here's the tools product managers need to succeed.
How Figma and Canva are taking on Adobe—and winning In 2010, Photoshop was ubiquitous. Whether you were editing a photo, making a poster, or designing a website, it happened in Photoshop. Today, Adobe looks incredibly strong. They’ve had spectacular stock performance, thanks to clear-eyed management who’ve made bold bets that have paid off. Their transition … Continue reading How to Eat an Elephant, One Atomic Concept at a Time →

With a great landing page builder, you can get results. We tested dozens of apps, and here are our picks for the 7 best.

Search and browse cloud infrastructure services such as PaaS, IaaS, log management, exception monitoring, realtime backend APIs, and more. Find the right tools and services to build your next app.

Purpose-built tools have emerged to help product managers do their jobs more effectively. These make up the product management stack, composed of more than a dozen categories. But what is the actual function of each category? We drill down on everything from roadmapping to onboarding.

As your sales team grows, your tech stack almost always does too. But figuring out which sales tools you should buy can be a daunting task.

OpenView's Kyle Poyar presents an inclusive guide featuring the best resources available to help you execute a successful product-led growth strategy.
The simple and open source user story mapping tool. - amborle/featmap
Not every SaaS company has endless spare money. One of the biggest piggy bank breakers are the tools we use—and it adds up fast.
-->
prodmgmt/ui-ux
categories:
tags: prodmgmt ui-ux
date: 26 Mar 2025
slug:raindrop-prodmgmt-uiux

Use this glossary to quickly clarify key terms and concepts related to product management and UX.
Unsure where to start? Use this collection of links to our articles and videos to learn about some principles of human psychology and how they relate to UX design.

Plus! Market-Making; Poaching and Equity Currency; China's Covid Economy; The Cost of AI; Friendshoring; Diff Jobs

What is pattern library, UI kit, and brand voice? Learn all the terms that you need to build and use a long-lasting design system.

The Japanese define quality in two ways — atarimae hinshitsu and miryokuteki hinshitsu. Understanding the difference between them is the key to building products that users love.
Microinteraction best practices that improve e-commerce UX.


What we can learn from technology that’s designed to be stepped on

It's not always true that simplicity makes the best product. Sometimes making things less simple will get you the users you truly want.
Use a flexible responsibility-assignment matrix to clarify UX roles and responsibilities, anticipate team collaboration points, and maintain productivity in product development.

Until recently, a lack of digital prioritization and desire to control access have led to sub-par luxury ecommerce experiences. Many luxury brands are struggling to improve.

If you’re a creative entrepreneur who understands the power of branding in your packaging design, you’re already
A Guide to Reddit, Its Key Competitive Advantages, and How to Unbundle It

So you like our media brand Growth Quarters? You should join our Growth Quarters event track at TNW2020, where you’ll hear how the most successful founders kickstarted and grew their companies. This article was originally published by Buil

The best designers employ specific habits, learned practices, and observed principles when they work. Here are a few of them.

SAP’s acquisition of Qualtrics shows how the shift in technology has changed business; it is a perfect example of using the Internet to one’s advantage.

As a rule of thumb business owners should be primarily focused on delighting their customers in any way possible. Every subtle interaction should be closely optimized for customer enchantment, and a decision as simple as where to park your car can subconsciously attract or detract a customer.
The history of technology is one of subtracting humans and replacing them with machines. Do the unintended consequences include creating shoplifters?

When feature bloat can hurt more than help your business goals.

Coming out of a banner year, Marvin Ellison discusses how initiatives put in place years ago contributed to the retailer's success.

Be a strategic thinker by recognizing opportunities at scale with seemingly small and insignificant data.

If listeners today can stream just about any song they want, why are so many music aficionados still buying records? Ryan Raffaelli and Gold Rush Vinyl CEO Caren Kelleher discuss the resurgence of vinyl.

Most U.S. news organizations won't let readers cancel online. The Federal Trade Commission wants that to change.
Building white label products is more profitable than starting a new design every time. Learn how to properly implement white labelling.
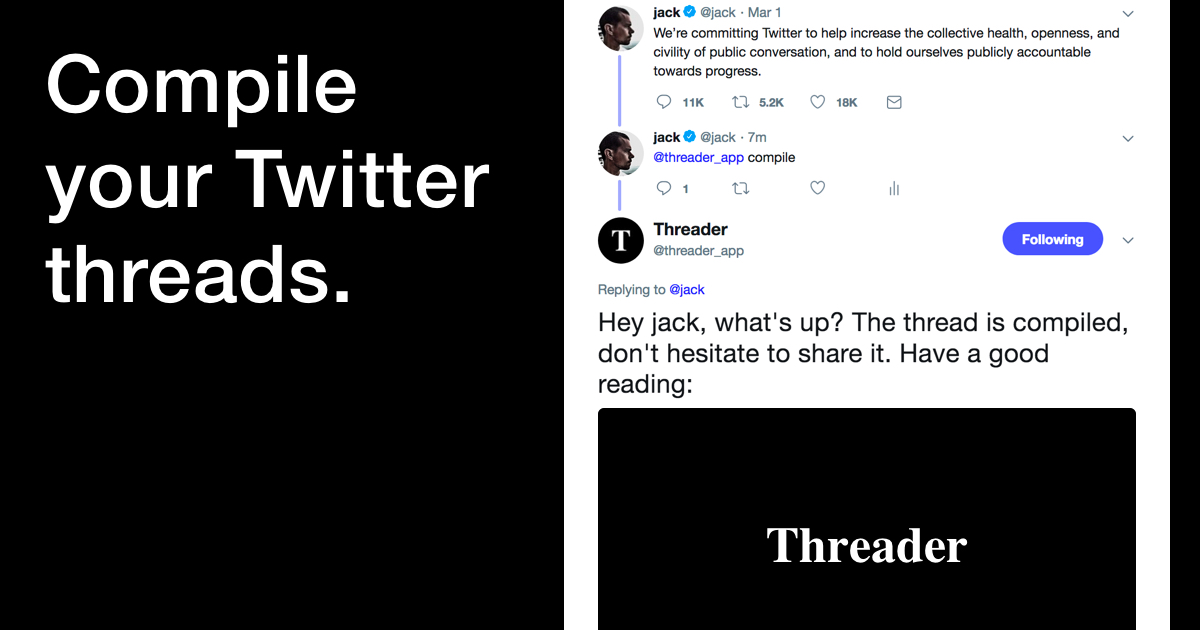
Get a selection of good threads from Twitter every day

These were my favorite product management and UX articles of 2020, which is the 5th year I’ve compiled this list. Though 2020 was a…
Consumer needs spark consumer journeys. How can marketers identify those needs and address them? The latest consumer research from Google will help.
Buyer Experience Benchmarking of 5 Top eCommerce Sites Dec 2018 Ken Leaver
A new battle is brewing to be the default of every choice we make. As modern interfaces like voice remove options, augmented reality…

How a user-first culture led to a decade of eureka moments at Google UX
“That’s just one person” and “Our real users aren’t like that” are common objections to findings from qualitative usability testing. Address these concerns proactively to ensure your research is effective.
-->
goodreads/history
categories:
tags: goodreads history
date: 26 Mar 2025
slug:raindrop-goodreads-history

Alan Lomax was a legendary collector of folk music, author, broadcaster, oral historian, musicologist, and filmmaker who raised the profile of folk music worldwide.

“As a doctor, she had already faced misogyny in the French medical corps. But she persevered. It would be no different for her as a rescue pilot.” By Charles Morgan Evans AT A remote French...

On a calm, clear day, USAir Flight 427 suddenly nosedived and smashed into the earth, killing everyone on board. A team of investigators quickly assembled to sift through the rubble.

Rats are less pestilent and more lovable than we think. Can we learn to live with them?

Claims that a recent undersea discovery may be Amelia Earhart’s long-lost aeroplane raise questions. Experts weigh in on the mystery that continues to captivate us.

Ada Blackjack was an Iñupiaq woman who married at 16 and had three children before her husband abandoned her. Only one child survived infancy, and he suffered from tuberculosis. Blackjack walked 40 miles to Nome, Alaska, carrying her son Bennett in order to place him in an orphanage, because she couldn't afford his medical treatment. She desperately wanted him back, and that's why she signed on to the doomed 1921 expedition that Vilhjalmur Stefansson organized to explore the possibility of a colon...

A lifetime after the Holocaust, a few of its perpetrators remain at large. German detectives are making a final push to hunt them down.


A classic ghost story has something to say about America—200 years ago, 100 years ago, and today.

There was a flash of blue and a surge of radioactive heat. Nine days later, Louis Slotin was dead.

A tale of disaster, survival, and ghosts.

The fragrant fruit hid a dark secret.

On November 28, 1787, His Majesty’s Armed Vessel Bounty set sail from England with 46 men aboard, bound for the island of Tahiti in the South Pacific. Commanded by Lieutenant William Bligh, her mission was to collect and deliver breadfruit plants to the West Indies, where they would serve as cheap food for slaves on British plantations. After a long [...]

Tomb raiders, crooked art dealers, and museum curators fed billionaire Michael Steinhardt’s addiction to antiquities. Many also happened to be stolen.

Kaminsky bought chemistry books from bouquinistes along the Seine and taught himself to make explosives. But when a man...

Paul Laurence Dunbar became the first Black writer to earn international acclaim through his poetry, essays and musical lyrics.

Most mammals, including our closest living relatives, have fur. So why did we lose ours?

The modern world uses shocking amounts of steel.
The Alchemy of Air: A Jewish Genius, a Doomed Tycoon, and the Scientific Discovery That Fed the World but Fueled the Rise of Hitler [Hager, Thomas] on Amazon.com. *FREE* shipping on qualifying offers. The Alchemy of Air: A Jewish Genius, a Doomed Tycoon, and the Scientific Discovery That Fed the World but Fueled the Rise of Hitler

His daring raids in World War I made him a legend. But in the Middle East today, the desert warrior’s legacy is written in sand

Scientists are grasping for any example that could help anticipate the future of Covid, even a mysterious respiratory pandemic that spread in the late 19th century.
:extract_focal()/https%3A%2F%2Fpocket-syndicated-images.s3.amazonaws.com%2Farticles%2F8198%2F1665196085_GettyImages-1351657058.jpg)
Over the course of his chariot racing career, Gaius Appuleius Diocles won almost 60,000 lbs of gold. What did he do with it? Who knows.
/https://tf-cmsv2-smithsonianmag-media.s3.amazonaws.com/filer_public/7b/b1/7bb13ff8-f7c1-4aee-9705-5489f056ff5d/dahomehy.jpg)
A new film stars Viola Davis as the leader of the Agojie, the all-woman army of the African kingdom of Dahomey

Before the industrial revolution, there had been a significant increase in machinery use in Europe. Why not in China?
/https://tf-cmsv2-smithsonianmag-media.s3.amazonaws.com/filer_public/65/56/6556bf21-81c7-4c28-91bf-596fa5457022/sep2022_g13_kingarthur.jpg)
The story of Camelot and the Knights of the Round Table has captivated us for a thousand years. But is there any truth behind the tales?
The most important lessons from history are the takeaways that are so broad they can apply to other fields, other…

The story of Josephine Baker.
:extract_focal()/https%3A%2F%2Fpocket-syndicated-images.s3.amazonaws.com%2Farticles%2F2189%2F1584711969__103933831_fanny-folle_pictures976crop.jpg)
It has often been described as a “miracle” that most of Denmark’s Jews escaped the Holocaust. Now it seems that the country’s Nazi rulers deliberately sabotaged their own operation.

Fifty years ago, a minor league game in Midland was postponed for the rarest of reasons—a swarm of grasshoppers biblical in its proportions.

Hidden in the tusk of a 34-year-old mastodon was a record of time and space that helped explain his violent death.

Jumbo Floating Restaurant, which closed in 2020, capsized in the South China Sea after being towed from the city. The sinking triggered nostalgia for a happier period of Hong Kong history.

An ex-Soviet state’s national myths—as well as the forces of nationalism, economics, culture, and religion—all pull it away from Moscow. Can Russia really compete?

Recorded during several hedonistic months in a fabulous Cote d’Azur villa, Exile on Main St is seen as the Stones’ epic, creative peak. As the classic album turns 50, stars tell us how it got their rocks off

How the impeccably credentialed, improbably charming economic historian supplanted the dirtbag left.

A strong national identity is essential for any country's survival – and the easiest route to acquiring one is to unite behind a common enemy.

This article is taken from the March 2022 issue of The Critic. To get the full magazine why not subscribe? Right now we’re offering five issue for just £10. If you’ve ever wondered how letters were…

In 1944, the USS Johnston sank after a battle against the world's largest battleship. More than 75 years later, her wreck was finally located, 6km (3.7 miles) below the waves.

The Divine Comedy is an Italian narrative poem by Dante Alighieri, begun c. 1308 and completed around 1321, shortly before the author's death. It is widely considered the pre-eminent work in Italian literature and one of the greatest works of Western literature. The poem's imaginative vision of the afterlife is representative of the medieval worldview as it existed in the Western Church by the 14th century. It helped establish the Tuscan language, in which it is written, as the standardized Italian language. It is divided into three parts: Inferno, Purgatorio, and Paradiso.

Did the iconic three-note sequence come from Stravinsky, the Muppets or somewhere else? Our writer set out to – dun, dun duuuun! – reveal the mystery

In 1708, the Spanish galleon San José sank in a deadly battle against English warships, taking with it billions in treasure. Centuries passed until a secretive archaeologist found the wreck, but now nations are again warring over who may claim the gold and glory.

For millennia, people slept in two shifts – once in the evening, and once in the morning. But why? And how did the habit disappear?

Biscuit-whisperer Erika Council honors the women who taught her to bake a perfect biscuit.
/https://tf-cmsv2-smithsonianmag-media.s3.amazonaws.com/filer_public/d0/fe/d0fe7c71-eb2c-4812-9109-d402f5987dcd/fascinating-finds.jpg)
The year's most exciting discoveries include a Viking "piggy bank," a lost Native American settlement and a secret passageway hidden behind a bookshelf
:max_bytes(150000):strip_icc()/__opt__aboutcom__coeus__resources__content_migration__serious_eats__seriouseats.com__images__2016__05__20160524-carolina-gold-rice-vicky-wasik-5-661a15dba135474582fa4a8c247aab4e.jpg)
Due in large part to Glenn Roberts of Anson Mills, a Georgia optometrist, and several members of what's known as the Carolina Gold Rice Foundation (yes, that exists), Carolina Gold rice is back, allowing a new generation of home cooks to experience what real Lowcountry cooking was meant to taste like.
:extract_focal()/https%3A%2F%2Fpocket-syndicated-images.s3.amazonaws.com%2Farticles%2F7329%2F1637626069_GettyImages-849146070.jpg)
Hulu’s “The Great” offers an irreverent, ahistorical take on the Russian empress’ life. This is the real history behind the period comedy.

Josephine Baker next week will become the first Black woman and first American to be honored with enshrinement in Paris' Pantheon.

Inside the Manhattan DA’s Antiquities Trafficking Unit

58 musicians showed up for a picture that captured the giants of jazz

From the docks of 12th-century Genoa to the gambling tables of today, risk is a story that we tell ourselves about the future
:extract_focal()/https%3A%2F%2Fpocket-syndicated-images.s3.amazonaws.com%2Farticles%2F6656%2F1726172571_ezgif-4-8bd6d561d0.jpg)
A whistleblower puts his life on the line to defy Soviet aggression. Over sixty years later, this forgotten story of subterfuge, smears and suspicious death has never felt more timely.

Heinrich Himmler sent a team of five Germans to Tibet in 1938 to pursue the Aryan race myth.

From the depths of poverty, Du Yuesheng rose through Shanghai’s underworld to become one of the most influential, and overlooked, figures in modern China.


Behind the American Museum of Natural History’s most venerable artifact is the shameful tale of a relentless explorer and a young boy’s torturous journey from Greenland to New York.

European ideas of African illiteracy are persistent, prejudiced and, as the story of Libyc script shows, entirely wrong

In 1721, London was in the grips of a deadly smallpox epidemic. One woman learned how to stop it, but her solution sowed political division.

Tom Brown's retirement hobby is a godsend for chefs, conservationists, and cider.
:extract_focal()/https%3A%2F%2Fimages.squarespace-cdn.com%2Fcontent%2Fv1%2F5a238ba10abd049ac5f4f02c%2F1557274963604-R62KVCK4PPT49N64IEHZ%2Fke17ZwdGBToddI8pDm48kDFgITcRoterXoQdllT5ciUUqsxRUqqbr1mOJYKfIPR7LoDQ9mXPOjoJoqy81S2I8N_N4V1vUb5AoIIIbLZhVYxCRW4BPu10St3TBAUQYVKcV7ZyRJyI8bwZiMJRrgPaAKqUaXS0tb9q_dTyNVba_kClt3J5x-w6oTQbPni4jzRa%2Fnapalmsm.jpg)
Dubbed the Ravens, misfit American pilots in Vietnam learned they could fly, fight, and drink as they pleased in a CIA-sponsored secret war. Just one catch: They answered to General Vang Pao.

Doesn’t look like much, does it? But, depending upon your definition, this photograph, a team effort by 9 men, is the most honored picture in U. S.

The mission, still a secret to this day, was so dangerous many men bid emotional goodbyes...

The plan to kill Osama bin Laden—from the spycraft to the assault to its bizarre political backdrop—as told by the people in the room.

In 1970, an image of a dead protester at Kent State became iconic. But what happened to the 14-year-old kneeling next to him?

Since the mid-1970s, almost every jazz musician has owned a copy of the same book. It has a peach-colored cover, a chunky, 1970s-style logo, and a black plastic binding. It’s delightfully homemade-looking—like it was printed by a bunch of teenagers at a Kinkos. And inside is the sheet music for hundreds of common jazz tunes—also

Scholar Monica Green combined the science of genetics with the study of old texts to reach a new hypothesis about the plague

What are the greatest art heists of all time? See a list of the 25 most memorable thefts from museums.
/https://tf-cmsv2-smithsonianmag-media.s3.amazonaws.com/filer/29/28/2928f86f-5da1-4b6a-b2f5-c4f313692fac/social_opener.jpg)
America’s bold response to the Soviet Union depended on an unknown spy agency operative whose story can at last be told

After Kenya declared independence from British rule in 1963, there came a flood of renamings. Schools, suburbs, and roads were rechristened in ways that spoke to a new idea of what it meant to be…

The skills behind the legendary sharpness of wootz steel were once forgotten, but Andy Extance talks to the researchers unsheathing its secrets

[caption id="attachment_80535" align="aligncenter" width="576"] The Tahiti, seen here sailing on San Francisco Bay, was a 124-foot brigantine built by Tur...

Alexander the Great’s death is an unsolved mystery. Was he a victim of natural causes, felled by some kind of fever, or did his marshals assassinate him, angered by his tyrannical ways? An autopsy…
:extract_focal()/https%3A%2F%2Fs3.amazonaws.com%2Fpocket-syndicated-images%2Farticles%2F1293%2F1567446969_5d48b3317acbf.jpg)
This quixotic colonial barrier was meant to enforce taxes.

Robert Ballard has found the Titanic and other famous shipwrecks. This month his crew started trying to solve one of the 20th century’s greatest mysteries.
On August 23rd, the day after Dietrich von Choltitz dispatched Rolf Nordling to contact the Allies, Hitler sent a message to Field Marshal Walther Model and von Choltitz demanding that Paris be hel…


The International Spy Museum details the audacious plan that involved a reclusive billionaire, a 618-foot-long ship, and a great deal of stealth

Kahve was a favourite drink of the Ottoman Empire’s ruling class. Little did they know it would one day hasten the empire’s demise

Thanks in part to the work of Hanns Scharff and a slew of studies on interrogation techniques, we know it's best to be genuinely friendly no matter who you're trying to get information out of.
/https://tf-cmsv2-smithsonianmag-media.s3.amazonaws.com/filer/dc/52/dc52ce6c-b901-43fd-9207-ad818964f8b0/ct-6622_print-4898-web.jpg)
In The First Conspiracy, thriller writer Brad Meltzer uncovers a real-life story too good to turn into fiction

Charged with manslaughter, the owners were acquitted in December 1911. A Smithsonian curator reexamines the labor and business practices of the era

"The dogs and cats fled in terror at his aspect, as if they had anticipated the kind of fate he was preparing for them."

We’ve all seen Ansel Adams’ luscious black-and-white images of Yosemite. Lesser known are his pictures of life in World War II-era Los…


How to make the trip from Sijilmasa to Oualata, circa 1352.

The most consequential military engagement in Southeast Asia in the 20th century is the 1954 Battle of Dien Bien Phu. It was fought ostensibly between the French and the communist-led Vietmin at Dien Bien Phu, an obscure valley bordering China, in the remote northwestern part of what was then French Indochina. The battle ended with a humiliating defeat for the French, which brought down the French government, ended French colonial rule in Asia, ushered in America’s epic military involvement in the region for decades to come, and fundamentally changed the global geostrategic landscape.

When the Great Depression put Plennie Wingo’s bustling Abilene cafe out of business, he tried to find fame, fortune, and a sense of meaning the only way he knew how: by embarking on an audacious trip around the world on foot. In reverse.

Many of us now use the word hobo to refer to any homeless individual, but back in the America of the late 19th and early 20th century, to be a hobo meant something more.

Did members of a powerful society of warlocks actually murder their enemies and kidnap children?

Cost cuts, stressed employees, intercompany rivalries, dirty floors, dusty rafters, glitchy IT, fudged metrics: The people who ran the failed toy retailer's stores know what went wrong.

A strange and bittersweet ballad of kidnapping, stolen identity and unlikely stardom

Many Indian dishes can be traced back, indirectly, to a 16th-century, food-obsessed ruler named Babur.

A peek inside the revelry and rivalry of Texas's fat men's clubs.

Because sometimes you have to fact-check your grandmother
-->
goodreads/animals
categories:
tags: animals goodreads
date: 26 Mar 2025
slug:raindrop-goodreads-animals

The entire world’s population of Przewalski’s horses once dwindled to a mere dozen. So how did a pair named Fiona and Shrek end up in livestock auctions in the West?
Rats are less pestilent and more lovable than we think. Can we learn to live with them?

A conservation N.G.O. infiltrates wildlife-trafficking rings to bring them down.

Ocean creatures soak up huge amounts of humanity’s carbon mess. Should we value them like financial assets?

In the woods near her home, Lucy Jones discovers the magic of slime molds and becomes entangled in their fluid, nonbinary way of being.


What can elephants, birds, and flamenco players teach a neuroscientist-composer about music?

Pets left behind when people fled the disaster in 1986 seem to have seeded a unique population.

A woman, an elephant, andan uncommon love story spanningnearly half a century.

The story of Lacey, and why I had to kill her.
Catapult publishes literary fiction and artful narrative nonfiction that engages with our Perception Box, the powerful metaphor we use to define the structure and boundaries of how we see others in th

Advanced technologies like A.I. are enabling scientists to learn that the world is full of intelligent creatures with sophisticated languages, like honeybees. What might they tell us?
Master falconer Alina Blankenship and her mélange of raptors have become the protectors of some of Oregon's top vineyards.

Behold choanoflagellates, tiny creatures that can be one body and many bodies all at once.

People say farmers aren’t supposed to get emotionally attached to livestock. Uh-huh. When fate sent our writer two newborn sheep with life-threatening birth defects, that kind of thinking was banished from the barn.

To save endangered eels, researchers have been working for decades to figure out where they reproduce.

In the Panhandle, where swarms of lionfish gobble up native species, a tournament offers cash prizes to divers skilled at spearing one predator after another.

Scientists are using machine learning to eavesdrop on naked mole rats, fruit bats, crows and whales — and to communicate back.
:extract_focal()/https%3A%2F%2Fpocket-syndicated-images.s3.amazonaws.com%2Farticles%2F8098%2F1659583091_GettyImages-1268003196.jpg)
Meet the footballing bees, optimistic pigs and alien-like octopuses that are shaking up how we think about minds.

/https://tf-cmsv2-smithsonianmag-media.s3.amazonaws.com/filer_public/6d/f1/6df1a51f-2b77-48be-b8c0-6901bbd2bf03/julaug2022_j19_madagascar.jpg)
Famed American biologist Patricia Wright explores an astonishing breadth of biodiversity in the wilderness of Madagascar

They’ve roamed free for hundreds of years, but is that freedom harming the ecosystem they call home?
Hidden in the tusk of a 34-year-old mastodon was a record of time and space that helped explain his violent death.

Science News, Physics, Science, Philosophy, Philosophy of Science

In his new book, An Immense World, science writer Ed Yong explores the diversity of perception in the animal world — including echolocation, magnetic fields and ultraviolet vision.

Meet the footballing bees, optimistic pigs and alien-like octopuses that are shaking up how we think about minds

Every creature lives within its own sensory bubble, but only humans have the capacity to appreciate the experiences of other species. What we’ve learned is astounding.

Three sisters braved lions, crocodiles, poachers, raging rivers and other dangers on a 1,300-mile transnational effort to forge a new dynasty.

What happens when we talk to animals?

In December 1997, a tiger prowled the outskirts of a small town in Russia's Far East. In his book The Tiger, John Vaillant re-creates the events of that terrifying winter in an environment where man and tiger live side-by-side.

You might consider them flying rats, but their odysseys stump scientists

An ambitious project is attempting to interpret sperm whale clicks with artificial intelligence, then talk back to them.

Conservationists saw the 6-year-old brown bear as a symbol of hope. Villagers saw him as a menace. Then he turned up dead.
Your obnoxious neighbor or just a misunderstood, displaced seabird?

Zito Madu in pursuit of London’s wildlife.

The long read: Dumba has spent her life performing in circuses around Europe, but in recent years animal rights activists have been campaigning to rescue her. When it looked like they might succeed, Dumba and her owners disappeared

Deer can regrow their antlers, and humans can replace their liver. What else might be possible?

While captive in a Navy program, a beluga whale named Noc began to mimic human speech. What was behind his attempt to talk to us?
Artificial intelligence may help us decode animalese. But how much will we really be able to understand?

Millions suffered through terror and upheaval in the turbulent years following the Soviet occupation of Afghanistan. One of them was a baby elephant from India — A new story from India to the world, each week on FiftyTwo.in

The descendants of pets abandoned by those fleeing the Chernobyl disaster are now striking up a curious relationship with humans charged with guarding the contaminated area.
:extract_focal()/https%3A%2F%2Fpocket-syndicated-images.s3.amazonaws.com%2Farticles%2F6222%2F1618012006_GettyImages-1155265546.jpg)
The microscopic animals can withstand extreme conditions that would kill humans, and may one day help in the development of Covid vaccines. How do they do it?

As a reptile-obsessed teen, I ran away to hunt lizards in the Everglades, then hatched a plan to milk venom from deadly snakes. It went even more comically wrong than you're thinking.

Birds do it. Bees do it. Learning about the astounding navigational feats of wild creatures can teach us a lot about where we’re going.

Nearly a century after the last wolf was eradicated in the state, a lone female arrived and established a pack. Not everyone is cheering

In Alaska, one of the longest-running and most comprehensive seabird monitoring projects is equal parts tedium, adventure, truth, and beauty.

What will we lose when Najin and Fatu die?

The giant squid has taken on a near-mythical status for generations of sailors, explorers, and writers. How could something so big remain unseen—or be less understood than dinosaurs?

It’s dangerous to blame the decline of one species on a single predator. We humans like to do it anyway.

The book Honeybee Democracy, published in 2010, has been sitting on my shelf for many years.
:extract_focal()/https%3A%2F%2Fcdn.theatlantic.com%2Fassets%2Fmedia%2Fimg%2Fmt%2F2018%2F09%2FThis_image_shows_a_California_two_spot_octopus_O._bimaculoides_CREDIT_Thomas_Kleindinst%2Flead_720_405.jpg%3Fmod%3D1537389997)
Despite their wacky brains, these intelligent animals seem to respond to the drug in a very similar way to humans.

They’re tiny and they hover, and they’re one of only three groups of birds that are vocal learners. They sing with their mouths andtheir feathers. No wonder UC Riverside researcher Chris Clark is obsessed with hummingbirds.

He was the alpha male of the first pack to live in Oregon since 1947. For years, a state biologist tracked him, collared him, counted his pups, weighed him, photographed him, and protected him. But then the animal known as OR4 broke one too many rules.

My father always pampered his pets. So when he fell ill and moved in with us, it was no surprise that his corgi came to rule our home. What I didn’t expect was for Trilby to care for me after Dad was gone.

"She's missing. I’m not going to quit her."
Self-replicating, bacterial life first appeared on Earth about 4 billion years ago. For most of Earth’s history, life remained at the single-celled level, and nothing like a nervous system existed …

In an era of climate change, everything feels strange. Even the places we call home.

Wild mustang populations are out of control, competing with cattle and native wildlife for resources. If the federal government doesn’t rein them in, ranchers may take matters into their own hands.

Go behind the scenes at the South Carolina Aquarium's Sea Turtle Care Center during a nearly yearlong journey to get a massive injured loggerhead back home


Technology can displace the cow and save the climate. But we will need to think beyond the bun

Kathi Lynn Austin is on a global chase to stop the flow of guns threatening to wipe the rhinoceros off the face of the Earth.
Human hunters moved north into what would become Montana on the heels of the receding ice, coming into the Mission Valley when the land was yet raw and studded with erratics. Only the first scrim o…

The female brown Aspin was found drifting in the Gulf of Thailand on Friday. It is unknown whether the dog swam the astonishing distance from the shore, or jumped off a boat at sea.

When foxes nearly wiped out a colony of little penguins, a sheepdog saved the day.

When a massive Caribbean volcano erupts, the island’s residents flee, leaving their beloved animals behind. As pets and livestock are…
/https://tf-cmsv2-smithsonianmag-media.s3.amazonaws.com/filer/65/fd/65fd3c95-c9a7-4fa4-8496-db00f245aca8/janfeb2019_a01_dyngomwdwardog.jpg)
I brought a seasoned veteran of the conflict in Afghanistan into my home—and then things got wild
Attacks by elephants on villages, people and other animals are on the rise. Some researchers are pointing to a species-wide trauma and the fraying of the fabric of pachyderm society.

They worm into snails and infect the brains of fish. They’ve also found their way into Kevin Lafferty’s heart. He sees them as beautiful examples of sophisticated evolution, and as keys to ecosystem balance.


Elephants might have the necessary capacities for personhood – we just need to help them acquire the cognitive scaffolding

Without a good shoeing, a horse can indeed be lost. Enter the farrier.

Multimillion-dollar sales of songbirds heap pressure on species already in decline. We go inside the covert investigation to capture traffickers.


A new book from Christopher Skaife is a beguiling, fascinating, and highly amusing account of the strangely magical birds.

Can we use the tools of psychology to understand how colonies of social insects make decisions?

The long read: Abandoned as a child, Marcos Rodríguez Pantoja survived alone in the wild for 15 years. But living with people proved to be even more difficult


Rob Wielgus was one of America’s pre-eminent experts on large carnivores. Then he ran afoul of the enemies of the wolf.

Fishing gear can pose a deadly threat to whales—and to those who try to save them.
-->
goodreads/food-drink
categories:
tags: food-drink goodreads
date: 26 Mar 2025
slug:raindrop-goodreads-food-drink

With the arrival of Thank You Please Come Again, our new book by Kate Medley, we present its opening essay.

On the insatiable hunger for belonging.

American food supplies are increasingly channeled through a handful of big companies: Amazon, Walmart, FreshDirect, Blue Apron. What do we lose when local supermarkets go under? A lot -- and Kevin Kelley wants to stop that.

I also helped undress him so he could lie down
The fragrant fruit hid a dark secret.

No great stagnation in home espresso

Olivia Potts | Longreads | November 2022 | 16 minutes (4,649 words) It’s six in the morning, and Robert Booth has already been on the road for three hours. Sitting alongside him in the cab of his lorry (the British term for a truck) is Louis, Robert’s small dog, a Jack Russell-chihuahua mix, and a washing-up bowl […]

Why do so many accomplished chefs call Popeyes their favorite fried chicken?
Before the industrial revolution, there had been a significant increase in machinery use in Europe. Why not in China?

The tons of contraband lunch meat seized at the U.S.-Mexico border tell us something about the market value of nostalgia.

Eight radio stations in Southern Louisiana still broadcast partially in French as they try to keep alive a dying language in the area. French has been spoken there since the mid-1700s.

Cheese, curry, beer: We can thank our ancestors who put food scraps to creative use. What we’re leaving our children is garbage.

:max_bytes(150000):strip_icc()/__opt__aboutcom__coeus__resources__content_migration__serious_eats__seriouseats.com__images__2015__10__coffee-shutterstock_6571060-3001e65b73e841ffa1e2cd4663ef5de1.jpg)
Lately, something has changed. Lately, I've been reacting to fancy coffee the same way a child reacts to an accidental sip of red wine mistaken for grape juice. I don't know when it happened, but I've devolved into an unexpected love affair with bad coffee. It's not just instant coffee that I hanker for each morning, either, it's any subpar coffee I can get my hands on.

Tartine, a beloved San Francisco bakery, wanted to grow. Partnering with a developer was one way to rise.

The story of See’s Candies reminds us of the importance of consistency, quality, and long-term growth in investing.

The new owner of Argentina’s de facto national treat stopped paying his majority-female workforce — so they seized control of the entire operation.

Julia Child's collaborator Simone Beck has lingered as an object of pity in public memory. But maybe Beck didn’t want stardom at all.
Biscuit-whisperer Erika Council honors the women who taught her to bake a perfect biscuit.

The fig is an ecological marvel. Although you may never want to eat one again.

Beekeeping helped Gary Adkison pull his life together. Now he's among the tenacious harvesters of tupelo honey.

For a long time, I thought MSG was a food additive more like "Red 40", that it had some obscure food-science use and junk food companies were either too lazy or callous to replace it. It turns out it's more like salt. Good luck taking that out of your Cheetos.
Due in large part to Glenn Roberts of Anson Mills, a Georgia optometrist, and several members of what's known as the Carolina Gold Rice Foundation (yes, that exists), Carolina Gold rice is back, allowing a new generation of home cooks to experience what real Lowcountry cooking was meant to taste like.

The painstaking process of picking piñon makes for a booming roadside economy for the Navajo Nation and other Indigenous Americans

It is deadly, invisible and shapes much of the food we eat. A teaspoon of it could kill millions of people, and it is probably the most expensive material on earth. Yet you probably have some stuck to the bottom of you shoe.

It flurried all day Sunday in Vermont. Ekiben co-founder Steve Chu watched the flakes with dread. Snow in the fryer would be trouble. This is the story of how the owners of Baltimore’s most p…

Growers of New Mexico’s iconic crop wrestle with drought, water rights and labor shortages.

With his stubborn disregard for the hierarchy of wines, Robert Parker, the straight-talking American wine critic, is revolutionizing the industry -- and teaching the French wine establishment some lessons it would rather not learn.

While big-name chefs take up Appalachian cooking, a farm couple are using old seeds and recipes to tell a more complex story and lift up their region.
:extract_focal()/https%3A%2F%2Fpocket-syndicated-images.s3.amazonaws.com%2Farticles%2F6178%2F1724870276_a91c9ce9-a469-494b-95e5-8cadcf8b2dd5_1536x620.jpg)
The world’s most obsessive breakfast-food fans demonstrate just how far humans will go for the sweet taste of nostalgia.
The true star of the Akutagawa Prize-winning novel Convenience Store Woman is the convenience store itself. But what is it that makes these shops so magical?

A study digs up the origin of the single species that gives us turnips, bok choy, broccoli rabe, and more.

When a Russian scientist identified the Malus sieversii as the progenitor of the domestic apple, harvests in Kazakhstan’s forests were bountiful; now this wild fruit is threatened.
Tom Brown's retirement hobby is a godsend for chefs, conservationists, and cider.

From unappetizing “fishbricks” to cultural darlings, the 1950s convenience food has enjoyed a winning streak—no less so than during the COVID-19 pandemic.

Secret codes. Legal threats. Betrayal. How one couple built a device to fix McDonald’s notoriously broken soft-serve machines—and how the fast-food giant froze them out.

Skipjack are the world’s most abundant tuna. They’re resilient, but can they outswim our demand for this pantry staple?

Where culinary bliss meets environmental peril, and how to solve America’s poke problem.

What the hole is going on?

Sonoma County’s SingleThread has been hailed as the apotheosis of high-end, farm-to-table dining. The perpetual threat of wildfires and once-in-a-generation flooding also make it a case study in the challenges that climate change will soon pose to restaurants everywhere.

Burkhard Bilger’s 2005 piece on the short-order cooks at the Flamingo hotel, who crack well over a million eggs a year, in a city built by breakfast specials.
:extract_focal()/https%3A%2F%2Fassets.atlasobscura.com%2Fmedia%2FW1siZiIsInVwbG9hZHMvYXNzZXRzLzY3YjY4YzhhYTExNTc0MWQ1M19fNzdBNDU4MS5qcGciXSxbInAiLCJjb252ZXJ0IiwiIl0sWyJwIiwiY29udmVydCIsIi1xdWFsaXR5IDgxIC1hdXRvLW9yaWVudCJdLFsicCIsInRodW1iIiwiMTI4MHg-Il1d%2F_77A4581.jpg)
In this remote Swiss town, residents spent a lifetime aging a wheel for their own funeral.

For a newcomer to the city, a boulangerie apprenticeship reveals a way of life.
:extract_focal()/https%3A%2F%2Fs3.amazonaws.com%2Fpocket-syndicated-images%2Farticles%2F1622%2F1568662999_ctorianEra.jpg)
But maybe not for your stomach.

If you've ever cooked a recipe from the back of one of the company's 400+ products, you have one very busy pastry chef to thank.

Thanks to the successful “Kurisumasu ni wa kentakkii!” (Kentucky for Christmas!) marketing campaign in 1974, Japan can't get enough KFC on Christmas Day
:extract_focal()/https%3A%2F%2Fpocket-syndicated-images.s3.amazonaws.com%2Farticles%2F2998%2F1704766322_michelinlead.jpg)
The best place to eat in Germany is in a little village in a forest.

The mob saw an opportunity. Local 338 had other ideas.

A coal fortune is fueling the revival of a cuisine it nearly destroyed.

An Oxford grad learns to navigate boiling sugar, sleep deprivation, and exacting pastry chefs with whom she can barely communicate.
:extract_focal()/https%3A%2F%2Fs3.amazonaws.com%2Fpocket-syndicated-images%2Farticles%2F1319%2F1567447569_5d4b1b83bbc1c.jpg)
Working summers at an authentically quaint roadside produce stand, a teenage salesperson is schooled in the not-so-subtle art of how to con a foodie from the big city.

On Saturdays Tootsie Tomanetz cooks barbecue the old-fashioned way for legions of loyal fans. That doesn’t mean she’ll ever give up her day job.
:extract_focal()/https%3A%2F%2Fassets.bwbx.io%2Fimages%2Fusers%2FiqjWHBFdfxIU%2FiPM8XBVIP9VU%2Fv5%2F640x-1.jpg)
Retail giants turn to bitcoin technology to combat food-fraud that costs the global food industry up to $40 billion every year.
Kahve was a favourite drink of the Ottoman Empire’s ruling class. Little did they know it would one day hasten the empire’s demise

John Mueller was the heir to one of the great Texas barbecue dynasties. Aaron Franklin was an unknown kid from College Station who worked his counter. John had it all and then threw it all away. Aaron came out of nowhere to create the state’s most coveted brisket. Then John rose from the ashes.

The grim traveler sampled the offerings with a heavy heart.

Step into the private kitchens of Basque country’s sociedades gastronómicas, where everything revolves around food

Delicate and impossible to replicate, su filindeu (or the “threads of God”) is a pasta made of hundreds of tiny strands by a single woman in a hillside town in Sardinia. She’ll make it for you too—if you’re willing to walk 20 miles overnight

As a cuke deckhand, your job first and foremost consists of making sure your diver survives

From celebrity seating warfare to dogs sipping Champagne, there’s never a dull moment at America’s most famous sushi joint.

In Ireland, few things are black and white, especially the law—and the tales of men who break it to dive for treasure under cover of darkness

One man wanted to change the raisin industry for the better. He got more than he bargained for.

The unsung heroes of the food world battle against time and chaos, cooking haute cuisine over lit cans of Sterno in the gloomy back hallways of New York's civic landmarks.
Kahve was a favourite drink of the Ottoman Empire’s ruling class. Little did they know it would one day hasten the empire’s demise

But can it be grown anywhere else?

From 2019: How Niki Nakayama’s kaiseki restaurant became a highly coveted reservation in L.A.

A controversial chef has created a sort of sushi speakeasy in a hotel room. It’s not easy to get a reservation. For one thing, there are only four seats at the bar.

Some consider him a master. That takes work.

If you love a burger...

When it comes to grain, the future looks like the past. Go back a half-century in Boulder County, and there’s Old Man Webber coming into town with his portable combine. Word gets passed around and Webber goes to every farm, home and plot growing wheat and chops it. Then Beth near Valmont gets her seed […]

David R. Chan’s love of lists and determination never to eat at the same place twice has seen him become an accidental expert on Chinese-American history. Just don’t call him a foodie
When you exist outside of regular society, when the nine-to-five gig is as foreign to you as going somewhere hot for a vacation, it makes it easier to indulge in the wilder, untamed side of things.

A millennial entrepreneur hires from inmates and homeless people who struggle to find work even in a strong economy.

Dave’s Killer Bread has become a cult favorite across the nation, drawing in both health-conscious consumers and those who root for an unlikely success story. But you won’t find the full story on the bread packaging.

After crops failed, botanist Kathleen Drew-Baker realized that nori wasn’t what it seemed.

Posters that come high in protein.
-->
goodreads/music
categories:
tags: goodreads music
date: 26 Mar 2025
slug:raindrop-goodreads-music

"Maybe it's only when you don’t know what you are listening for that you find what you were waiting all along to discover."
Alan Lomax was a legendary collector of folk music, author, broadcaster, oral historian, musicologist, and filmmaker who raised the profile of folk music worldwide.

Friends and family of late singer Nicolette Larson remember her brilliant voice, and the ups and downs of a life that ended far too soon.

What is it about the once virtually unknown song that inspires so many musicians to make it their own?

Tennessee’s government has turned hard red, but a new set of outlaw songwriters is challenging Music City’s conservative ways—and ruling bro-country sound.

A writer of haunting, uncategorizable songs, she once seemed poised for runaway fame. But only decades after she disappeared has her music found an audience.

Emahoy Tsegué-Maryam Guèbrou, who died recently, wrote pieces that were elegiac, but suffused with a sense of survival: we are broken, we are wounded, we carry on.
What can elephants, birds, and flamenco players teach a neuroscientist-composer about music?

A legendary singer on faith, loss, and a family legacy.

He’s trusted to repair some of the world’s most fabled — and expensive — instruments. How does John Becker manage to unlock the sound of a Stradivarius?

On the road with the band in its forty-first year.

On October 30, 2002, a cancer-stricken Warren Zevon returned to the ‘Late Show With David Letterman’ stage for one last performance. Twenty years later, Letterman and more remember the gravitas and emotion of that stunning night.

Plant and Krauss discuss their first album together in 15 years, their 'happily incompatible' friendship and, of course, the chances of a Led Zeppelin reunion.

As he approaches 90, even brushes with death can’t keep him off the road — or dim a late-life creative burst.
Eight radio stations in Southern Louisiana still broadcast partially in French as they try to keep alive a dying language in the area. French has been spoken there since the mid-1700s.

From a neurological and evolutionary perspective, music is fascinating. There seems to be a deeply rooted biological appreciation for tonality, rhythm, and melody. Not only can people find certain sequences of sounds to be pleasurable, they can powerfully evoke emotions. Music can be happy, sad, peaceful, foreboding, energetic or comical. Why is this? Music is

In a new documentary, fans and experts explore the legacy of a song that was originally shunned before becoming a timeless classic
Recorded during several hedonistic months in a fabulous Cote d’Azur villa, Exile on Main St is seen as the Stones’ epic, creative peak. As the classic album turns 50, stars tell us how it got their rocks off
/https://tf-cmsv2-smithsonianmag-media.s3.amazonaws.com/filer_public/55/44/55449cf4-7f5c-46fd-b8ee-f29b6d17574c/opener_letterboxed.jpg)
Exotic lumber salvaged from a remote forest in Belize is the world’s most coveted tonewood

The musicians were diabolically bad as people, and satanically good as performers.
Did the iconic three-note sequence come from Stravinsky, the Muppets or somewhere else? Our writer set out to – dun, dun duuuun! – reveal the mystery
Josephine Baker next week will become the first Black woman and first American to be honored with enshrinement in Paris' Pantheon.

After a chunk of his brain was removed, guitarist Pat Martino got his groove back.
58 musicians showed up for a picture that captured the giants of jazz

Nenad Georgievski writes at All About Jazz, though the world knew little about Malian music until American musicians began partnering with players from West Africa. In the 1980s, Stevie Wonder began touring with Amadou and Mariam, helping to popularize their form of Malian blues.

A lifetime of brutal injuries and misfortune robbed the world-renowned pianist João Carlos Martins of the ability to play his instrument. And then along came an eccentric designer and his bionic gloves.

After years apart, the Black Crowes perform at the Forum on Thursday, part of a tour celebrating the 30th anniversary of the group’s breakthrough debut.

Why does a genre obsessed with death attract the kindest people?

How do we understand Blue in the 21st century? Can we think of Mitchell's 1971 album, long considered the apex of confessional songwriting, as a paradigm not of raw emotion, but of care and craft?

Discover extraordinary true stories celebrating the diversity of humanity. Click to read Narratively, a Substack publication with tens of thousands of subscribers.

Thirty years ago, Billboard changed the way it tabulated its charts, turning the industry on its head and making room for genres once considered afterthoughts to explode in the national consciousness

Fifty years after their first release, the country-rock titans led by Don Henley and the late Glenn Frey still loom large in American music. Their hits still get play and their sound is a precursor to modern Nashville. But has this biggest of bands aged well? A panel of experts weigh the case.
Since the mid-1970s, almost every jazz musician has owned a copy of the same book. It has a peach-colored cover, a chunky, 1970s-style logo, and a black plastic binding. It’s delightfully homemade-looking—like it was printed by a bunch of teenagers at a Kinkos. And inside is the sheet music for hundreds of common jazz tunes—also
:extract_focal()/https%3A%2F%2Fpocket-syndicated-images.s3.amazonaws.com%2Farticles%2F6151%2F1724102865_ezgif-5-deb4e0c283.jpg)
What does a crew of talented musicians do when forced to serve at the pleasure of a notoriously cruel dictator? They play like their lives depend on it.

In 1978 he was music’s next big thing. Then his album bombed, he began a long slide into obscurity, and a bizarre fraud sent him to prison. Will Dane Donohue finally get his encore?

After a turbulent decade, the Gary, Indiana, native has cemented himself as one of the greatest rappers of his—or any—generation. And on Sunday, he’s up for a Grammy award.

The hard life and overlooked brilliance of Zane Campbell.

For the first time since the passing of Rush's drum god, Neil Peart, Geddy Lee and Alex Lifeson speak about his legacy.

Generations of musicians got their start busking the streets of the Deep Ellum neighborhood of Dallas, Texas. After a decade of 'hobo-ing' around cities like New Orleans, Paris, and New York, Charley Crockett discovered it was his turn.

On Syd Barrett's time with Pink Floyd and making an album with household objects and found sounds.

We look back on the many chapters of Leonard Cohen's long, remarkable life, from teenage poet to midlife monk and beyond.

How Single Lock Records unites the hometown legends of Muscle Shoals, Alabama, music with the new generation.

The jazz musician’s impeccably maintained home in a modest New York City neighborhood is a testament to his — and midcentury design’s — legacy.

This down-on-his-luck headbanger fabricated a persona, faked a tour and promoted himself as a hard-rock savior

Fifty years ago, a plane carrying Buddy Holly crashed in a remote Iowa cornfield. This month, hundreds of fans will gather at the ballroom where he played his final show to sing, dance, and mourn the greatest rock star ever to come out of Texas.

How the American music legends behind 'The Lion Sleeps Tonight' made millions off the work of a Zulu tribesman named Solomon Linda who died a pauper.

Most guitars don’t have names. This one has a voice and a personality, and bears a striking resemblance to his owner.

In 2001, the internet’s premier file-sharing service Napster was shut down after just two years, leaving a giant vacuum in the ever-expanding peer-to-peer file-sharing space....

History makes no mention of what was one of the most popular all-female country acts ever. Yet the story of the Goree Girls—inmates who banded together in the forties at Texas’ sole penitentiary for women—is worth a listen.

A new short film captures some of Cohen’s reflections on creativity and spirituality, and on preparing for the end of life.

In a new memoir, the bassist describes how he expanded his consciousness, found his muse and landed in a storied rock band.
:extract_focal()/http%3A%2F%2Fstatic.nautil.us%2F5017_0af787945872196b42c9f73ead2565c8.png)
After a chunk of his brain was removed, guitarist Pat Martino got his groove back.

Few embodied the spirit of New Orleans, or helped take its music to strange new places, the way the man born Mac Rebennack did.

Mac Rebennack devoted himself to New Orleans culture.

He was falsely cast as Mozart’s murderer and music’s sorest loser. Now he’s getting a fresh hearing.

“Dakar was where everyone came to make music.”

A quiet Sunday night in 1953. The Dodgers had just won the pennant. J.F.K. and Jacqueline Bouvier had just married. And four titans of bebop came together in a dive bar for a rare jam session.

A writer never knew her family’s house on St. Thomas, in the U.S. Virgin Islands, but discovering it, and her history, became an obsession.

Plus, explosive photography from Austin, instrumentals from Billy Preston, and a podcast investigation of Anna Nicole Smith.

Thousands of French people are coming to live in Quebec and discovering that a common language doesn’t necessarily mean a common culture.

Color constancy continues to confound us.

Seated at a table on the rear deck with Lindsay Lohan and her entourage, I spotted Alex Jimenez — a professional yacht influencer.

Seems there was a time when the dominant story of punk was the story of British punk. If you knew nothing else, you knew the name Sid Vicious, and that seemed to sum it up.

Investigation finds officials ignored warnings for years before one of the deadliest crashes in decades.

They made music together, took drugs, and slept together. But none of the legends of Laurel Canyon, including Joni Mitchell and David Crosby, remember it the same way.

John Lydon, the 62-year-old punk legend, was in New York for a new documentary about Public Image Ltd. But first, he wanted to shop and smoke in a bar.
A strange and bittersweet ballad of kidnapping, stolen identity and unlikely stardom

Launched by two of the biggest names in Texas business, Clear Channel was once the most powerful—and feared—player in radio. Now rebranded as iHeartMedia, it’s on the brink of bankruptcy.

Take the rough with the smooth: how the sound of a voice is multisensory, and creates interior meaning through metaphor
-->
goodreads/exercise-health-medicine
categories:
tags: exercise-health-medicine goodreads
date: 26 Mar 2025
slug:raindrop-goodreads-exercise-health-medicine
:extract_focal()/https%3A%2F%2Fpocket-syndicated-images.s3.amazonaws.com%2Farticles%2F694%2F1633132585_dire12313131314ct.jpg)
A case study digs into the medical records of a lost diver’s incredible survival story.

“I was all of the things people are when they’re 14 or 15” — except a decade younger.

Could a theory from the science of perception help crack the mysteries of psychosis?

In a series of emotional interviews, the unconventional senator opens up about his battle with depression.

A surprising number of people experience symptoms of this curious condition, which is named after Lewis Carroll's heroine, who changed size after eating and drinking.

The long read: What do you say to someone whose wife prefers photographs of deceased authors to him?

The long read: For the ultra-wealthy and the super-famous, regular therapy won’t do

Humanity's engineering achievements have been extraordinary, so why has building an artificial heart has proved to be more challenging than expected.

Until people started breaking out into hideous rashes.
The Wuhan lab at the center of suspicions about the pandemic’s onset was far more troubled than known, documents unearthed by a Senate team reveal. Tracing the evidence, Vanity Fair and ProPublica give the clearest view yet of a biocomplex in crisis.
Scientists are grasping for any example that could help anticipate the future of Covid, even a mysterious respiratory pandemic that spread in the late 19th century.

Physicians suffer one of the highest burnout rates among professionals. Dr. Kimberly Becher, one of two family practitioners in Clay County, West Virginia, learned the hard way.

It’s time to ditch the biological clock, run to the nearest fair and jump back on that metaphoric roller-coaster known as your life

“I know how lucky I am, and secretly tap wood, greet the day, and grab a sneaky pleasure from my survival at long odds.”

The first successful transplantation may solve a donor shortage, but this major scientific advancement is not without challenges.
It is deadly, invisible and shapes much of the food we eat. A teaspoon of it could kill millions of people, and it is probably the most expensive material on earth. Yet you probably have some stuck to the bottom of you shoe.
After a chunk of his brain was removed, guitarist Pat Martino got his groove back.

Does your internal monologue play out on a television, in an attic, as a bickering Italian couple – or is it entirely, blissfully silent?
/cloudfront-us-east-1.images.arcpublishing.com/tbt/T3YCKRSVKREPVJGK6WI4QXJMFU.JPG)
On this ward at Morton Plant Hospital, nurses are overwhelmed by the number of new, desperate cases.

Discovered more than a decade ago, a remarkable compound shows promise in treating everything from Alzheimer’s to brain injuries—and it just might improve your cognitive abilities.

One patient in a pioneering trial describes his “life-changing” experience with the psychoactive drug.

Scientists discovered a previously unidentified genetic mutation in a Scottish woman. They hope it could lead to the development of new pain treatment.

What deep brain stimulation surgery feels like.

No one could deny that Timothy was sick. But when doctors can’t agree on the cause of an illness, what happens to the patients trapped in limbo?

Suzanne O’Sullivan’s excellent book reveals that medicine remains as much an art as a science
In 1721, London was in the grips of a deadly smallpox epidemic. One woman learned how to stop it, but her solution sowed political division.

When a private-equity firm bought a Philadelphia institution, the most vulnerable patients bore the cost.

All pandemic long, scientists brawled over how the virus spreads. Droplets! No, aerosols! At the heart of the fight was a teensy error with huge consequences.
:extract_focal()/https%3A%2F%2Fpocket-syndicated-images.s3.amazonaws.com%2Farticles%2F6247%2F1618709158_GettyImages-12396009461.jpg)
Just before Alex Godfrey’s grandmother died from dementia, she snapped back to lucidity and regaled him with stories of her youth. Could moments like this teach us more about the human brain?

Sewage epidemiology has been embraced in other countries for decades, but not in the U.S. Will Covid change that?
Scholar Monica Green combined the science of genetics with the study of old texts to reach a new hypothesis about the plague

In her quest to master a quintessential cool-kid trick, Outside contributor Kim Cross found the sweet spot at the crossroads of work and play

Millions of hearts fail each year. Why can’t we replace them?

Dr. Donald Johnson has spent his career making crime scene blood stains spill their secrets. His next mission: bringing forensic science into the iPad age.

Plano surgeon Christopher Duntsch left a trail of bodies. The shocking story of a madman with a scalpel.

The mistakes and the struggles behind America’s coronavirus tragedy.

Cancer surgery for $700, a heart bypass for $2,000. Pretty good, but under India’s new health-care system, it’s not good enough.

The boutique fitness phenomenon sold exclusivity with a smile, until a toxic atmosphere and a push for growth brought the whole thing down.

Pathogens that switch to a new host species have some adapting to do. How does that affect the course of a pandemic like Covid-19?

“N of 1” studies aim to answer medical questions one person at a time

One man's unlikely journey from servant and prisoner of war to bodybuilding champion—with an epic, trans-continental love story along the way.

In the typical emergency room, demand far outpaces the care that workers can provide. Can the E.R. be fixed?

A phage that resists all forms of the antiviral defense known as CRISPR has an unusual means of survival.
:extract_focal()/http%3A%2F%2Fstatic.nautil.us%2F5845_f41ff84e7cbd129397c11f8c5d20c0f4.jpg)
A controversial disease revives the debate about the immune system and mental illness.

Forensic scientists, the police and crime scene investigators master horror with a steady hand. This article gives a rare insight into the post-mortem examination of a homicide.

‘Each box was like the distillation of all that we have learned as a species about our bodies and their infirmities, a time capsule of medicine.’
Three decades ago, a young man murdered his girlfriend and killed himself. What happened next to his heart was extraordinary.

A survey of trepanation, or trephination, the oldest surgical procedure known to humanity.

When a promising student left a neighborhood full of heroin for the University of Pennsylvania, it should have been a moving story. But what does an at-risk student actually need to thrive — or even just to survive?

Omar Salgado defied the odds in Room 20. But his is not a story about a miracle — it’s a story about medicine’s inability to accurately diagnose consciousness.

Finding out his name turned out to be the easy part. The tough part was navigating the blurred lines that separate consciousness from unconsciousness — and figuring out whether his smile was really a smile.

With a new gene therapy center almost completed, the medical center is providing hope for families who previously had little.

Humans and other mammals and birds would have been killed many times over by Chernobyl's radiation that plants in the most contaminated areas received. So why is plant life so resilient to radiation and nuclear disaster?

Mathematical insights into how RNA helps viruses pull together their protein shells could guide future studies of viral behavior and function.

Jim Allison is an iconoclastic scientist who toiled in obscurity for years. Then he helped crack a mystery that may save millions of lives: Why doesn’t the immune system attack cancer?
The Oman Desert Marathon was my first ultra marathon. It was just over 100 miles (165km) across the baking sand. I didn’t really want to do it. It only came up as an idea when an editor from The Fi…

After multiple rare cancers have been diagnosed in Waycross, Georgia, the city grapples with a profound question: What if the industries that gave us life are killing us?

A once abandoned drug compound shows an ability to rebuild organs damaged by illness and injury

Doctors removed one-sixth of this boy’s brain — and what was left did something incredible

Joshua Mezrich has performed hundreds of kidney, liver and pancreas transplants. He shares stories from the operating room in his book, When Death Becomes Life.

[caption id="attachment_78739" align="aligncenter" width="483"] Close-up of an Auzoux anatomic male manikin, made of hand-painted papier mâché, circa 18...

Prior to 1976, the FDA did not regulate medical implants, and so shoddy and even deadly devices proliferated, inserted into Americans' body. When the FDA finally decided to regulate implants,…

From trauma to arrhythmia, and back again.

After suffering a stroke, a woman was left blinded, only able to see movement.

In this exclusive excerpt from 'Ticker: The Quest to Create an Artificial Heart,' world-renowned Houston surgeon Bud Frazier races to help an ailing patient by implanting a revolutionary device that may one day save millions of lives.

At 18, Katie Stubblefield lost her face. At 21, she became the youngest person in the U.S. to undergo the still experimental surgery. Follow her incredible story.

The world record stands at 24 minutes 3 seconds. How much can it improve?

The Four Thieves Vinegar Collective is a network of tech-fueled anarchists taking on Big Pharma with DIY medicines.

Analgesic balm in a hexagonal jar, launched in Rangoon by the Aw brothers in 1924, was a staple of Chinese families’ medicine cabinets for a generation. Today, Tiger Balm products have fans around the world, including Lady Gaga

There’s an illusion that if you want something enough, even something as fantastical as avoiding death, you might just get it.
-->
goodreads/sports
categories:
tags: goodreads sports
date: 26 Mar 2025
slug:raindrop-goodreads-sports

The candid Mets legend reflects on his Cinderella career and indelible place in the pop-culture pantheon.

They led a cycling revolution in a country where women were forbidden to ride. When the Taliban returned to power, their only hope was a harrowing escape to an uncertain future.

The long read: I was once Ireland’s No 1 player, and tried for years to climb the global ranks. But life at the bottom of the top can be brutal

She overcame trust issues and chartered a yacht. Now Caitlin Clark is ready for March.

The Netflix series “Sunderland ’Til I Die” serves as a thesis both for fandom and for the inevitability of its disappointments.

After the 2022 All-Star Game, Morant's misconduct became more frequent -- and dangerous. Since then, serious allegations have emerged. Lawsuits and subpoenas remain open. And a 24-year-old superstar's career is on the brink.

Once the next big thing in American sports, Jai Alai has all but completely disappeared over the past 20 years. But in Miami, the game is still played for much smaller crowds and stakes.

The long read: A series of financial scandals have rocked Italy’s most glamorous club. But is the trouble at Juventus symptomatic of a deeper rot in world football?

Stolz, the 18-year-old from Wisconsin, won three gold medals at the speedskating world championships, finishing his turns in a way that seemed like something out of a storybook.

Erik Sowinski is a professional pacer, a talented runner who is in high demand on starting lines, and nowhere to be found at the finish.

When the top teams in Greece meet, the story lines, and the rivalries, regularly extend far beyond the soccer field.

Gary Hunt is an enigma. He trains with the intensity of a modern athlete, but relaxes like a sportsman of a bygone era. He is fiercely competitive but unbelievably laid-back. How did he become the greatest cliff diver of all time?

He won four Super Bowls and retired as the undisputed greatest. What came next was turning a legacy into a life.

Eleven-year-old Victoria has her sights set on playing Little League with the boys. She goes through tryouts and is told to learn to cook…

Dave Bresnahan never made it past AA, but, thanks to a specially prepared potato, he holds a place in baseball lore

The legendary Dodgers broadcaster, who died Tuesday at age 94, was a modern Socrates, only more revered. He was simultaneously a giant and our best friend.

Football in Russia was booming after the 2018 World Cup - now, thanks to the invasion of Ukraine, it promises to keep on shrinking

Participants in the Tennessee race must negotiate extreme temperatures, wild terrain and more than 50,000 feet of accumulated ascent

In 2019, Charles Conwell unintentionally ended Patrick Day’s life with his fists. Now he’s trying to make sense of his life, and boxing itself.

He’s the greatest marathoner in history, a national hero in Kenya, and an icon for runners around the world. But despite his fame and wealth, Eliud Kipchoge chooses to live the most basic lifestyle. Cathal Dennehy travels to the highlands of Kenya for an inside look at his training camp and to meet a champion with a quiet, complex personality
James A. Garfield High School in Seattle is a place where you can feel the history thrum throughout the hallways. Quincy Jones and Jimi Hendrix were students here. Dr. Martin Luther King Jr. spoke …

In 2002, Kobe Bryant's surprise arrival at Harlem's legendary court caused a stir. This is the oral history of what happened when the Lakers great put his streetball cred on the line.

‘He was just out there drilling long threes in his shades and hitting cutters. It was really incredible.’

On the Long Island Inferno, two fathers, both with complicated pasts took it all too far. Neither man was ever the same.

Valdosta might be a 24-time state football champ, but lately its program has been rocked by a racial discrimination lawsuit filed by a former coach, the hiring of controversial coach Rush Propst and a secret recording that alleged cheating by SEC powers.

Indiana is set to host a Big Dance unlike any other, evoking the madness—from buzzer beaters to bourbon-soaked basketball—of the state's fabled high school tournament.

The Official Site of Major League Baseball

Iga Swiatek of Poland came out of nowhere to win the French Open in October. A sports psychologist was with her all the way.


How did an executive in one of the league's smallest markets steal millions of dollars -- and get away with it for years?
For many female wrestlers, the toughest challenge is finding opponents.

In suburban Fort Worth the frail psyche of a football prodigy collided with the crazed ambition of his dad, who himself had been a high school football star way back when. The consequences were deadly.

How Stan Smith went from a "decent" tennis player to the most popular trainer on the planet

As the son of African immigrants, Antetokounmpo was unwelcome in Athens. Then he showed promise as a basketball star.

Over the past 20 years, Gregg Popovich has sliced an exclusive culinary trail across America -- all for a singular purpose. This is the story of his legendary team dinners, and how they have served as a pillar of the Spurs' decadeslong dynasty.

Why the world was wrong about the "worst Olympian ever."

In 2017, the Hall of Fame Louisville coach’s career collapsed under a string of scandals, leading to his firing from the school he had coached for 16 years. Now, Pitino is finding himself in Greece, coaching Panathinaikos, working for a self-styled Bond

Any idiot can get married. Any idiot can be a father. An NBA title? That’s work. That’s worth crying over.

You didn’t think this was one of those fairytales where the kid gets some pep talk, and everything changes right? It REALLY isn’t that.

The Portuguese super-agent Jorge Mendes joined forces with investors from Shanghai and planned to cash in on buying and selling athletes, documents show.

Unlikely comrades Diana Taurasi and Brittney Griner play overseas for the money. As it turns out, they also simplify their lives.

Courtney Dauwalter specializes in extremely long races. But her success in winning them has opened a debate about how men’s innate strength advantages apply to endurance sports.

On the football field, one team went from six to eleven. Another went from eleven to six. And both faced challenges they didn’t expect.

Dudes like me ain’t supposed to talk about this type of stuff. I’m about to tell you some real shit. Things I haven’t told anybody.

A long-dormant police investigation gives the case new life.

Dining out with courtsiders, a rogue, impish species in the tennis ecosystem.
Discover extraordinary true stories celebrating the diversity of humanity. Click to read Narratively, a Substack publication with tens of thousands of subscribers.


Sammy Gelfand is the numbers guy behind the Golden State Warriors’ success. Some pretty good players help, too.

On Montana’s Flathead Indian Reservation, basketball is about much more than winning.

A profile of UConn basketball coach Geno Auriemma, who has not found peace despite unprecedented success.

“The reason women-only billiards tournaments exist is not because the players can’t beat men. It’s because they can.”

'God's Quarterback' was the archetype American success story, but the triumphs everyone saw masked the inner turmoil no one knew about.
-->
goodreads/crime
categories:
tags: crime goodreads
date: 26 Mar 2025
slug:raindrop-goodreads-crime

Among the vineyards and fruit farms of South Africa’s Western Cape, the mysterious death of a farmworker reveals a violent history.

Noah Musingku made a fortune with a Ponzi scheme and then retreated to a remote armed compound in the jungle, where he still commands the loyalty of his Bougainville subjects

How I (possibly) solved a cold case on my summer vacation.

No one in my family wanted to talk about Harold’s life as a contract killer for the Mob. Then one day he called me.

Two scammers, a web of betrayal, and Europe’s fraud of the century.

Zach Horwitz came to Los Angeles hoping to make it in the movies. He ended up running a seven-hundred-million-dollar scam, defrauding a sprawling group of investors, starting with his best friends.

A friendship born out of the ruins of a nation, a dangerous journey home, and a 40-year search for the truth.
:extract_focal()/https%3A%2F%2Fpocket-syndicated-images.s3.amazonaws.com%2Farticles%2F9993%2F1715122969_ScreenShot2022-07-07at2.54.23PM.png)
Is the killer behind the 1982 Tylenol poisonings still on the loose? Exclusive revelations by investigators yield the first authoritative account of what happened and who likely did it.

"For years, a mysterious figure preyed on gay men in Atlanta. People on the streets called him the Handcuff Man—but the police knew his real name."

After Zac Brettler mysteriously plummeted into the Thames, his grieving parents discovered that he’d been posing as an oligarch’s son. Would the police help them solve the puzzle of his death?

Kyle de Rothschild Deschanel was an instant New York sensation who seemed to live on a 24/7 carousel of mega-dollar deals and raucous parties. Then his best friend found an ID marked “Aryeh Dodelson.”
:extract_focal()/https%3A%2F%2Fs3.amazonaws.com%2Fpocket-collectionapi-prod-images%2F6694b4b0-d4dd-4d6b-8490-4c05304fdd27.jpeg)
For some of us, dark times call for dark reads.
:extract_focal()/https%3A%2F%2Fs3.amazonaws.com%2Fpocket-collectionapi-prod-images%2F088c1288-764e-42ca-95c3-2b2ff8586217.jpeg)
Venture inside the minds of some of the greatest scammers.

Ken Eto rose through the ranks of the Chicago mob, and then it tried to kill him. The underworld would never be the same.

In the spring of 1961, Georges Lemay, a dapper thirty-six-year-old French Canadian, spent his days holed up in his cottage on a private island on a river in the Laurentian Mountains north of Montre…
Tomb raiders, crooked art dealers, and museum curators fed billionaire Michael Steinhardt’s addiction to antiquities. Many also happened to be stolen.
:extract_focal()/https%3A%2F%2Fs3.amazonaws.com%2Fpocket-collectionapi-prod-images%2F380ef6fd-85fd-4244-bacd-2d5a19779f08.jpeg)
The comedian and podcast host—and bonafide scam expert—shares her favorite capers, along with what makes them so irresistible.

The tech company Wirecard was embraced by the German élite. But a reporter discovered that behind the façade of innovation were lies and links to Russian intelligence.

George Stebbins was tearing down a stone wall in the cellar of his home in Northfield, Massachusetts when he uncovered the bones. A skull emerged first, then the spine and the bones of the arms and…

Local sleuths help find a suspect in gay porn actor Bill Newton's murder. His dismembered head and feet were found in a Hollywood dumpster in 1990.

The long read: In 2016, artist César Aréchiga talked one of Mexico’s most dangerous maximum security prisons into letting him run art classes for its inmates, many of them violent gang members. Could he really change their lives?

Wolfgang and Helene Beltracchi’s forgeries infiltrated museums, auction houses and private collections. A decade after their conviction, psychoanalyst Jeannette Fischer asks: Why did they do it?

Anne-Elisabeth Hagen, 68, was married to one of the wealthiest men in Norway. But four years ago, she disappeared, and police still have no solid leads. The entire country has been obsessed by the case ever since.


Suzanne Wooten did the impossible and became the first candidate to defeat a sitting judge in Collin County. What followed is the unbelievable, epic tale of the craziest case in the history of jurisprudence.

You can't make this shit up

Welcome to Video’s customers thought their payments were untraceable. They couldn’t have been more wrong. The untold story of the case that shredded the myth of Bitcoin’s anonymity.

Suddenly, a New York cop remembered a long-ago double murder.

It was the deadliest U.S. transportation disaster in a decade. The man behind it was one of the most notorious confidential informants in FBI history.

Mandy Matney kept a harsh spotlight trained on South Carolina’s Murdaugh family until they became impossible for anyone to ignore

On a remote island in Maine, a group of friends thought they witnessed one man killing another with an ax. But no one was ever arrested. In a small town far out at sea, justice sometimes works a little differently.

For five years, a mysterious figure has been stealing books before their release. Is it espionage? Revenge? A trap? Or a complete waste of time?

In the mid-sixties, Candace Mossler was one of the most widely known socialites in Houston. She was in her forties, vivacious and full of charm, with wavy blond hair, deep-blue eyes, and a surgically enhanced figure that was often remarked upon in the many newspaper columns written about her.
Inside the Manhattan DA’s Antiquities Trafficking Unit

The long read: An intrepid expert with dozens of books to his name, Stéphane Bourgoin was a bestselling author, famous in France for having interviewed more than 70 notorious murderers. Then an anonymous collective began to investigate his past

Billed as the most secure phone on the planet, An0m became a viral sensation in the underworld. There was just one problem for anyone using it for criminal means: it was run by the police

It was the most shocking crime of its day, 27 boys from the same part of town kidnapped, tortured, and killed by an affable neighbor named Dean Corll. Forty years later, it remains one of the least understood—or talked about—chapters in Houston's history.
From the depths of poverty, Du Yuesheng rose through Shanghai’s underworld to become one of the most influential, and overlooked, figures in modern China.

Fifty years ago, a shooting that nearly killed police officer Daril Cinquanta set in motion a decadeslong chase across the American West
Conservationists saw the 6-year-old brown bear as a symbol of hope. Villagers saw him as a menace. Then he turned up dead.

Dozens of people were killed, died by suicide, or went missing from the Texas military base last year alone. What is behind the violence and tragedy at Fort Hood?

The young woman who mysteriously drowned in the Ropers Motel pool in 1966 might have remained anonymous forever, if not for cutting-edge genetics, old-fashioned genealogy—and the kindness of a small West Texas town.

In Scott Kimball, the FBI thought it had found a high-value informant who could help solve big cases. What it got instead was lies, betrayal, and murder.
:extract_focal()/https%3A%2F%2Fpocket-syndicated-images.s3.amazonaws.com%2Farticles%2F6345%2F1620347959_1q76Xol7zRdld3s-BbFrB_Q.jpeg)
A man returns home from the army and gets a surprising offer from his father: Join the family business and help mom & pop pull off a string of daring cross-country heists. No one expects the betrayals coming.

How did Ruja Ignatova make $4bn selling her fake cryptocurrency to the world - and where did she go?
:extract_focal()/https%3A%2F%2Fpocket-syndicated-images.s3.amazonaws.com%2Farticles%2F6281%2F1619214715_GettyImages-182146040.jpg)
When nearly $3.5M of rare books were stolen in an audacious heist at Feltham in 2017, police wondered, what’s the story?

In 1974, John Patterson was abducted by the People’s Liberation Army of Mexico—a group no one had heard of before. The kidnappers wanted $500,000, and insisted that Patterson’s wife deliver the ransom.

‘It’s a trip just being out’: at the local Greyhound bus station with newly released men from the Texas State Penitentiary

In Sept. 9, 1975, William Osterhoudt, a local school principal, looked out at an implausible scene unfolding at the pink house belonging to his neighbor on United Street. Key West Fire Chief Joseph…

John Franzese Jr. helped send his father, notorious Colombo family mobster Sonny Franzese, to prison. Then he turned up in Indianapolis.

The long read: In my career, I have investigated many of the UK’s worst disasters. Few cases were as harrowing as the sinking of the Marchioness in 1989, which left scores dead and almost impossible to identify

The feds knew him as a prolific bank robber. But the bearded man who eluded them for so long was not who they imagined him to be. And absolutely no one expected the story to end the way it did.
Hitman-for-hire darknet sites are all scams. But some people turn up dead nonetheless

How an obscure legal document turned New York’s court system into a debt-collection juggernaut.

Two people went for a hike on the Appalachian Trail. Only one made it out.

Last December, a Canadian pharmaceuticals executive and his wife were found strangled in their home. No one knows who did it or why, but everyone has a theory.

The shooting of a civilian exposes the underbelly of a small town police department.

The author spent a day with three men in a high-end security detail to find out how it feels to be safe.
Discover extraordinary true stories celebrating the diversity of humanity. Click to read Narratively, a Substack publication with tens of thousands of subscribers.
A long-dormant police investigation gives the case new life.

A father took his 10-year-old fishing. She fell in the water and drowned. It was a tragic accident—then he was charged with murder.

Mexico’s drug cartels are moving into the gasoline industry—infiltrating the national oil company, selling stolen fuel on the black market and engaging in open war with the military.

Andrew Goldstein’s crime set in motion a dramatic shift in how we care for the violent mentally ill. Including for himself—when he’s released this month.

Is the Chinese government behind one of the boldest art-crime waves in history?

Having fallen on hard times, a former football star and the pride of his small town decides to rob the local bank. His weapons of choice: Craigslist, bear mace, and an inner tube.

Earlier this spring, Jeff Pike, the head of the infamous Texas-based Bandidos motorcycle club, went on trial in federal court for racketeering. Prosecutors called him a ruthless killer, the man behind one of the deadliest biker shoot-outs in American history, at the Twin Peaks restaurant in Waco. Pike, however, said he was just a good family man. On Thursday, jurors announced their verdict.


The inside story of the first homicide in America’s most secure prison.

The inside story of the first homicide in America’s most secure prison.

The long read: Under Vladmir Putin, gangsterism on the streets has given way to kleptocracy in the state

She keeps watch over one of the largest databases of missing persons in the country. For Meaghan Good, the disappeared are still out here, you just have to know where to look.

In Northern Albania, vengeance is as likely a form of restitution as anything the criminal-justice system can offer.
-->
goodreads/expat-travel
categories:
tags: expat-travel goodreads
date: 26 Mar 2025
slug:raindrop-goodreads-expat-travel

In 1976, Suzanne Heywood’s father decided to take the family on a three-year sailing ‘adventure’ – and then just kept going. It was a journey into fear, isolation and danger …

Every winter, Ivrea erupts into a ferocious three-day festival where its citizens pelt one another with 900 tons of oranges. (Yes, oranges.)

In September 2022, after watching many YouTube videos of other people on long-distance Amtrak trips, I finally embarked on a journey of my own. I took the Amtrak Southwest Chief train from Chicago to Los Angeles. Continue reading to learn more about it and why I'll do it again on another route.

The explorer’s grandfather travelled higher than anyone; his father went deeper. Now it was his turn to make a mark.
An ex-Soviet state’s national myths—as well as the forces of nationalism, economics, culture, and religion—all pull it away from Moscow. Can Russia really compete?

In December, a photographer set off on a 2,600-mile road trip, traveling from the Yemeni border to the Strait of Hormuz. Here’s what she saw.

The stretch of coastline in southwest Africa is a strange and beautiful reminder that, in the end, we are powerless against nature and time.

The long read: In 2014, an American dad claimed a tiny parcel of African land to make his daughter a princess. But Jack Shenker had got there first – and learned that states and borders are volatile and delicate things

From ancient Egypt to the Persian Empire, an ingenious method of catching the breeze kept people cool for millennia. Now, it could come to our aid once again.

West Berlin's lifeline during the Soviet Blockade, Tempelhof Airport has since become the city’s biggest park. Berliners will fight to keep it that way.

Climate change is bringing tourism and tension to Longyearbyen on the Norwegian archipelago of Svalbard.

The hills are alive with socially distant adventures.

Up, up, and away!

Debunking the myth that the great national park was a wilderness untouched by humans

How a group of nonresident homeowners tried to influence a rural Colorado election.

Oh, you hit the fire road again with your lifted Wrangler? Cute.

The Museum of Arts and Crafts is a trove of cunning inventions

Colombia is on a mission to make sense of its rich biodiversity, isolated thanks to years of war. For researchers, it is a golden opportunity – and a breathtaking adventure.

What happens when a wealthy patron wears out his welcome?
The best place to eat in Germany is in a little village in a forest.

For decades, the Old Forge was the holy grail of the British outdoors community. The UK's remotest pub, it could only be reached via boat or a three-day walk through one of Britain's last true wildernesses, the Knoydart peninsula in Scotland. A dispute between some locals and a new owner threatened the legend—until they decided to open up a pub of their own.
:extract_focal()/https%3A%2F%2Fs3.amazonaws.com%2Fpocket-syndicated-images%2Farticles%2F2748%2F1576771089_9404p.jpg)
To be an off-season caretaker of Bodie, California (winter population: 5), you need a high tolerance for cold, solitude, and two-hour grocery runs.

The town hasn't yet become the promised global-trade nexus. Nonetheless the shopping zone has lured entrepreneurs hoping to get rich and shoppers trying to get a bargain.
Step into the private kitchens of Basque country’s sociedades gastronómicas, where everything revolves around food
Delicate and impossible to replicate, su filindeu (or the “threads of God”) is a pasta made of hundreds of tiny strands by a single woman in a hillside town in Sardinia. She’ll make it for you too—if you’re willing to walk 20 miles overnight

These desert libraries have been around for centuries and they hold sacred texts from ancient times.


Last winter, Moroccan officials found two hikers dead on the trail to the highest peak in the Atlas Mountains. The international investigation that followed revealed the fragility of the adventure travel economy, as well as what happens when a small tourist hub is suddenly made strange by violence.

Nomads have been central to the country’s history for centuries. Anthony Sattin joins the roaming empire

The legend of the Sourtoe Cocktail continues.

Follow my adventures on Instagram! http://instagram.com/Jeffrey.hk Dropped new timelapse! https://www.youtube.com/watch?v=9JBMpzW_B58 Hi all, i built a 24K resolution 360 camera specifically for upcoming 360 timelapse project. Check it out: https://www.youtube.com/watch?v=fseH9Kd5ooM If you'd like to support my camera work so I can continue timelapse (this piece used up more than half of my D750 Shutter Life. Rain and camera also don't get along) please check out my patreon: https://www.patreon.com/YTJeffHK 30 Days of Timelapse, about 80,000 photos combined. 1500GB of Project files. Sailing in the open ocean is a unique feeling and experience.I hope to capture and share it for everyone to see. Support my photo/videography by buying through my affiliate links! Best Value Fullframe for timelapse https://amzn.to/2MYk2vX Fisheye lens used in 30 days timelapse https://amzn.to/30uE4Aw 360 camera I use https://amzn.to/2Qfgcku Drone https://amzn.to/2Qhxk98 BIG JUICE powerbank for everything https://amzn.to/304fKJq Gaffer Tape (no residue) https://amzn.to/2LCRLYq Silica Gel Packs https://amzn.to/2N083xJ Good intervalometer https://amzn.to/2N1ETOS Good Entry Tripod https://amzn.to/2ZWp8e7 Pro Tripod https://amzn.to/2NYSlCH Budget Time lapse Motion Control https://amzn.to/2A4H7Vd Advance time lapse Motion control https://amzn.to/2PQ5ctn Route was from Red Sea -- Gulf of Aden -- Indian Ocean -- Colombo -- Malacca Strait -- Singapore -- South East China Sea -- Hong Kong Camera used: D750, Rokinon 12mm f/2.8 0:32 Milky Way 0:53 Sirius Star (I think) Correction: Jupiter the planet according to some viewers 1:17 Approaching Port of Colombo 1:45 Cargo Operation 2:08 Departure Colombo with Rainstorm 2:29 Beautiful Sunrise 3:13 Lightning Storm at Malacca Strait and Singapore Strait 3:29 Clear night sky Milky Way with lightning storm 4:01 Camera getting soaked 5:09 Arrival Singapore 5:56 Departure Singapore 6:20 Moon-lit night sky 6:48 Another Sunrise 8:30 Headed due north and you can see Ursa Major rotating neatly around Polaris. 8:36 Squid Boats 8:54 Chaotic Traffic 9:15 Arrival Hong Kong Music: Philip G Anderson - Winter (from 0:00 to 4:37 and 8:00 to 10:00) Buy Winter here: https://philipganderson.bandcamp.com/album/winter Stellardrone - Billions And Billions (from 4:37 to 8:00) =====10 Reasons Why Maritime is AWESOME ===== https://www.youtube.com/watch?v=0U18AHZbS_M =====10 Reasons Why Maritime SUCKS ===== https://www.youtube.com/watch?v=tdMYEKwxTyo =====How To Anchor a Mega-Ship ===== https://www.youtube.com/watch?v=62O7KYfb4GA =====Where did I go last 2 months?? Cancun Adventure====== https://www.youtube.com/watch?v=nsizwRUXoa0 =====Navigation Bridge of a Mega Ship===== https://www.youtube.com/watch?v=Bj3_peT4u9M =====A Tour of Mega Ship's Engine Room===== https://www.youtube.com/watch?v=s7BhBsVigZw =====HEAVY SEAS! Bad Weather in Atlantic Ocean===== https://www.youtube.com/watch?v=OZA6gNeZ5G4 =====Cargo Operations on Ship===== https://www.youtube.com/watch?v=kj7ixi2lqF4 =====Top 6 Questions about Merchant Marine===== https://www.youtube.com/watch?v=wBpQ9Y4jEfg

From artists to advocates, a new book highlights women in the outdoors.

In 1765, an English explorer gave two islands a rather unfortunate name that has sheltered them from the world and preserved one of Earth’s last paradises.
For the past 100 years, a box of never-before-seen negatives has been preserved in a block of ice in Antarctica. Recently, Conservators of the New Zealand

Greed, gringos, diesel, drugs, shamans, seaweed, and a disco ball in the jungle.

An insider's guide to the riads of Morocco—and whether they're right for you.
If you love a burger...

In February 2015, a cryptic email reached former NPR correspondent Ann Cooper from around the globe and across 28 years. It would pull her back into one of the most extraordinary reporting jobs in her career.

Careening through the desert, a massive railway sustains life in northwest Africa

Surveying muskoxen in the Russian far north.

In Wonder Valley, the silence makes its own kind of noise. And Twentynine Palms makes its own kind of music.
-->
behaviors/influence-persuasion
categories:
tags: behaviors influence-persuasion
date: 26 Mar 2025
slug:raindrop-behaviors-influence-persuasion

An in-depth breakdown of charismatic leadership tactics and how to tap into your own charisma when speaking in public.

Detailed notes and summary for The Laws of Human Nature by Robert Greene. Another in-depth book with timeless principles to better understand and navigate life.

East Asian businesses often go out drinking.
Discover the power of examples in shaping our lives. Explore quotes on example and how they inspire us to reach new heights.
The word “friends” has at least five different meanings: Allies Backstage intimates Fun friends Mutual interests friends Soc...
:extract_focal()/https%3A%2F%2Fhbr.org%2Fresources%2Fimages%2Farticle_assets%2F2020%2F07%2FJul20_30_982459672.jpg)
How do you convince someone who, for one reason or another, doesn’t see eye-to-eye with you?

How our culture, politics and technology became infused with a mysterious social phenomenon that everyone can feel but nobody can explain.

Lab-based research shows that adults can be convinced, over the course of a few hours, that as teens they perpetrated crimes that never actually occurred.

New research suggests that body postures can reveal our emotions to other people—and maybe even change how we feel inside.

Two concepts can help explain why society seems increasingly unable to agree on basic facts.

Bonhoeffer's "theory of stupidity" posits that we have more to fear from stupidity than evil. The latter is easier to defeat than the former.

Talking to someone who gets defensive can be frustrating. So, what can you do? Here's how to sidestep someone's personal fortifications.

By exposing people to small doses of misinformation and encouraging them to develop resistance strategies, "prebunking" can fight fake news.

When people argue, a kind of frustration called persuasion fatigue can cloud their judgment and harm relationships

The magazine of the British Psychological Society - in print and online.

Arguing well isn’t just about winning. A philosophical approach will help you and the other person get much more out of it

When you join a new organization, it’s important to understand who holds the power because they directly impact how work gets done, but it’s not always perfectly clear. In this piece, the author offers strategies to better identify where the true power exists. “At first glance across your company, it’s natural to assume that those who have ‘chief’ or ‘senior’ in their titles are the ones that dominate the power landscape,” the author writes. “But this isn’t always the case.”

As someone who researches American religion, I find myself in impassioned conversations quite often. Religion is a beautiful element that…

One of my pastimes is listening to interviews with accused corporate fraudsters before and after they got caught.

Amid COVID, studies in Denmark suggest that crowds do not always engage in bad behavior—and that mass-gatherings sometimes offer meaningful connection


Sometimes facts, logic, and reasoning aren't enough. Here's how the most persuasive people make a great argument even more convincing.

Free Online Guide - What drives online purchases? And how can you apply this information to boost conversions?

Have you ever wondered about internal organization dynamics and why some groups of people (who aren’t on the same team) are more successful than others? Why different “tribes” inside the organization seem to be at war with one another lowering performance in increasing politics? Why certain groups of people never seem to do anything? Or why …

The Primary Tactics Used to Influence Others —The number one thing to understand about influence is that people make decisions for their reasons, not yours.

There are lots of techniques for becoming more persuasive , but perhaps the simplest, most practical technique is the But You Are Free me

Summary of Nudge, presented to IxDA LA - Download as a PDF or view online for free
Powerful communicators employ these persuasion techniques when designing online experiences that convert visitors into leads and sales.
U.S. Army Engineer School Commandant’s Reading List
How to minimize the drama and keep your team on track.
76 votes, 15 comments. Some context: At marketing meetups, we've always heard people namedropping Dr. Robert Cialdini's 6 Principles Of Influence…

I’ve found the following to be common (and not easily taught) in people whose product skills I admire.

John Farrell took his team from the bottom of their division last year to the 2013 World Series with a set of tactics every manager should learn.
Five things you need instead.

Simple, direct requests get better results.
:extract_focal()/https%3A%2F%2Fs3.amazonaws.com%2Fpocket-syndicated-images%2Farticles%2F1733%2F1569602069_Screenshot_2019-09-2721st-centurypropagandaAguidetointerpretingandconfrontingthedarkartsofpersuasion.png)
In the West, “rational propaganda” has become the primary form of political discourse.

“I’ve probably revised this investor pitch deck 200 times,” a founder told me recently. She’d met with more than 50 potential investors before closing a seed round last month. This might sound excessive to some, but her experience is not unusual. Entrepreneurs often spend hundreds of hours raising funds from angel and venture capital investors. While these activities are clearly important, analysis of new data on startups suggests that founders should also dedicate significant time to something that many people overlook: recruiting great mentors. This simple strategy can increase a company’s odds of success more than almost anything else.

When people discover that they don’t know as much as they thought they did, something interesting happens: their political attitudes become less extreme.
Good body language is a crucial part of making an excellent first impression.
Awesome List of resources on leading people and being a manager. Geared toward tech, but potentially useful to anyone. - LappleApple/awesome-leading-and-managing
The home of Process Excellence covers topics from Business Process Management (BPM) to Robotic Process Automation (RPA), AI, Lean Six Sigma and more. Latest news, freshest insight and upcoming events and webinars.
Apple is famous for not engaging in the focus-grouping that defines most business product and marketing strategy. Which is partly why Apples products and advertising are so insanely great. They have the courage of their own convictions, instead of the opinions of everyone else’s whims. On the subject, Steve Jobs loves to quote Henry Ford […]
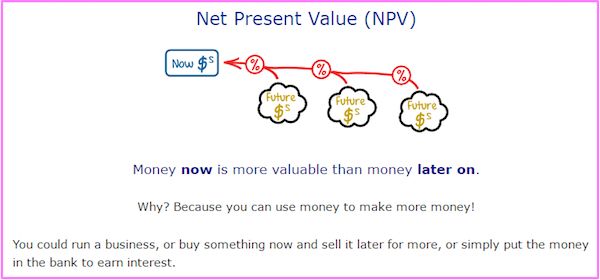
Here are 14 persuasive writing techniques that will make your website appeal to visitors and increase your conversion rates.
Leadership Now is a leading source for leadership development and analysis. We believe that anyone can make a difference by leading from where they are.

"The success of your startup is determined before you ship a single line of code." Okay, you’re right, Sun Tzu, the ancient Chinese war general and author

We all know that leaders need vision and energy, but after an exhaustive review of the most influential theories on leadership–as well as workshops with thousands of leaders and aspiring leaders–the authors learned that great leaders also share four unexpected qualities. The first quality of exceptional leaders is that they selectively reveal their weaknesses (weaknesses, not fatal flaws). Doing so lets employees see that they are approachable. It builds an atmosphere of trust and helps galvanize commitment. The second quality of inspirational leaders is their heavy reliance on intuition to gauge the appropriate timing and course of their actions. Such leaders are good “situation sensors”–they can sense what’s going on without having things spelled out for them. Managing employees with “tough empathy” is the third quality of exceptional leadership. Tough empathy means giving people what they need, not what they want. Leaders must empathize passionately and realistically with employees, care intensely about the work they do, and be straightforward with them. The fourth quality of top-notch leaders is that they capitalize on their differences. They use what’s unique about themselves to create a social distance and to signal separateness, which in turn motivates employees to perform better. All four qualities are necessary for inspirational leadership, but they cannot be used mechanically; they must be mixed and matched to meet the demands of particular situations. Most important, however, is that the qualities encourage authenticity among leaders. To be a true leader, the authors advise, “Be yourself–more–with skill.”
New research indicates that consumers are catching on and may be annoyed by certain nudges, potentially limiting their effectiveness.
Your product can’t suck. That’s a given. But it’s also not enough to be a good product that doesn’t hook your customer and connect to their pain points.

The Tipping Point summary shows you why ideas spread like viruses, which 3 kinds of people are responsible for it & why no bad idea will ever spread.

Mini pizza bagels? Now we're talking.
Your #1 resource for digital marketing tips, trends, and strategy to help you build a successful online business.
A company study found that a manager’s technical skills were far less valued by employees than people skills.


“Reality is merely an illusion, albeit a very persistent one.” ~ Albert Einstein It was well past 5pm and we were still at the office debating about how we should inspire our customers. We were debating the strategy to ‘be like Mike‘ or to ‘be like Joe.’ To be like Mike, meant we would only …
Fight the Good Fight The probability that we may fall in the struggle ought not to deter us from the support of a cause we believe to be just. Try Honey Before Vinegar If you would win a man to your cause, first convince him that you are his sincere friend. On the contrary … …

The Primary Tactics Used to Influence Others —The number one thing to understand about influence is that people make decisions for their reasons, not yours.

The job of a good storyteller, marketer, or writer is to pull one over on you. To make you believe what they’re saying, no matter how farfetched it might be.

How do you make decisions? If you're like most people, you'll probably answer that you pride yourself on weighing the pros and cons of a situation carefully and then make a decision based on logic. You know that other people have weak personalities and are easily swayed by their emotions, but this rarely happens to you. You've just experienced the [fundamental attribution error](https://en.wikipedia.org/wiki/Fundamental_attribution_error) — the tendency to believe that other people's behaviour is due to their personality (“Josh is late because he's a disorganised person”) whereas our behaviour is due to external circumstances (“I'm late because the directions were useless”). Cognitive biases like these play a significant role in the way we make decisions so it's not surprising that people are now examining these biases **to see how to exploit them in the design of web sites**. I'm going to use the term ‘persuasion architects' to describe designers who knowingly use these techniques to influence the behaviour of users. (Many skilled designers already use some of these psychological techniques intuitively — but they wouldn't be able to articulate why they have made a particular design choice. The difference between these designers and persuasion architects is that persuasion architects use these techniques intentionally).
The subtle signals you have to master.

Use these 7 persuasion tips to instantly make your presentations, roadmaps, marketing and sales materials more compelling, engaging, and influential.

In 2002 I was driving to a hedge fund manager’s house to hopefully raise money from him. I was two hours late. This was pre-GPS and I had no cell phone. I was totally lost. If you’ve never driven around Connecticut you need to know one thing: all the roads are parallel and they […]

Politicians and other public figures deploy particular rhetorical devices to communicate their ideas and to convince people, and it’s time that we all learned how to use them, says speechwriter Sim…

You’re on the most important elevator ride of your life. You have ten seconds to pitch- the classic “elevator pitch”. Love or Hate. Money or Despair. And you may never get this chance again. As PM Dawn says, “I feel for you. I really do.” There are books about this. But don’t waste your time. […]

Follow this guide for everything you need to know about conversion rate optimization, how it works, and how to use it.
The Ten Golden Rules of Leadership explores the classical figures to determine the ten crucial axioms of leadership. Rule 1. Know Theyself. Rule 2 ...
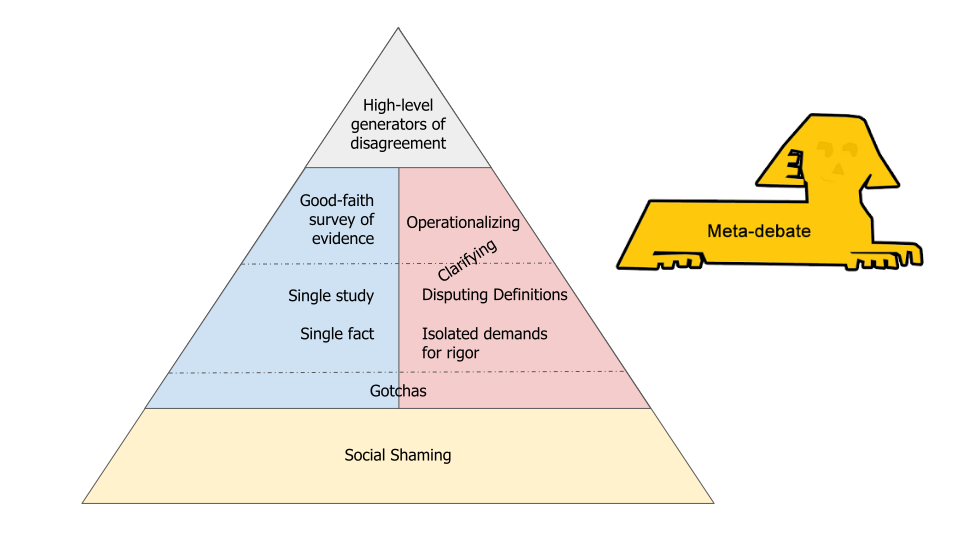
How to turn arguments from vicious battles into productive dialogues.
The American tendency to fill up quiet space is not a good strategy with the Chinese.

Market research can extract plenty of data, but its greatest value is in evoking reactions

In a classic experiment conducted by the psychologist Solomon Asch, participants were placed in a group, shown a “target” line alongside a set of comparison lines of varying lengths, and asked which was closest in length to the target. The answer was always obvious, but unbeknownst to the study’s actual participants, they had been placed […]
There are words which have special meaning within each culture and carry power where they are used.

What does it take to become a more convincing communicator? New research suggests that linguistic mirroring — that is, adjusting your communication style to match that of your audience — is an effective tool to increase your ability to influence others. In this piece, the authors describe four key dimensions of linguistic mirroring, as well as several tactical strategies for leaders looking to win over a client, judge, or other important evaluator. Ultimately, they argue that building genuine relationships with key evaluators is the best way to gain insight into their linguistic preferences — but it’s up to all of us to make sure that we use the power of linguistic mirroring for good.

How our toothy modern smile was invented by a confluence of French dentistry and Parisian portrait-painting in the 1780s

The advantages of being attractive are exorbitant. Beauty might be the single greatest physical advantage you can have in life. And yet…

Learn the street epistemology conversation technique and how you can apply it at work.

My mission for 2014 was to get more people started in User Experience (UX) Design. In January, hundreds of thousands of people did the original UX Crash Course and it was translated into Spanish, Portuguese and Korean by amazing volunteers. In May we continued with a User Psychology lesson every day.

“It's my intention to work into each lecture one lie...” Remembering a favourite teacher whose unorthodox methods got his students' attention

It’s not what you do. It’s how ostentatiously you do it

“Nothing in the world is more exciting than a moment of sudden discovery or invention, and many more people are capable of experiencing such moments than is sometimes thought.”

Take a moment to dive into the pieces your fellow behavioral science enthusiasts read most this year.

You can’t stop people making demands on your time and energy, but you can develop assertiveness skills to protect yourself

Entrepreneurs must become experts at connecting with anyone-and with a few simple strategies, you can. Here's what happened when I tried them myself.

Regardless of where you are in the pathway of understanding how the human psyche works, this list of must-read psychology books will upgrade your personal library.

You might not believe in QAnon, but you could still fall down the rabbit hole.

People who overrate their media savviness share more misleading material.

When we want people to change, we typically tell them what to do. But what if we flipped the script and asked them for their wisdom instead? Behavioral scientist Katy Milkman PhD explains the power…


Being a calming influence when things go south is a seriously attractive quality

The term "bullshitting" (in addition to its colloquial use) is a technical psychological term that means, "communication characterised by an intent to be convincing or impressive without concern for truth." This is not the same as lying, in which one knows what they are saying is false. Bullshitters simply are indifferent to whether or not

It’s important to understand that when you, as a leader, communicate with your team, using weaker words weakens your message and blunts your ability to inspire people. It’s not enough to just throw thoughts out there and hope for the best. You need to actively recommend ideas and assert their worthiness in all of your communications. For example, consider these “power words”: “I’m proposing (not “sharing”) an idea that will make our process more efficient.” “I’m suggesting (not “sharing”) a new logo that better conveys our brand message.” “I’m recommending (not “sharing”) a campaign to make our workplace more diverse.” Ultimately, audiences respond more actively to big points than to small words, but thoughtful leaders need to assess both, knowing that the more powerfully they come across — even in small ways — the greater impact they have on the people they hope to inspire.

Color can affect judgment and decision making, and its effects may vary across cultures. Research reported in this article shows that cross-cultural color effects on risk preferences are influenced by personal associations of color-gain/loss. Our research finds a cultural reactance effect, a phenomenon in which people who hold culturally incongruent (vs. cultural mainstream) color associations
:extract_focal()/https%3A%2F%2Fcms.qz.com%2Fwp-content%2Fuploads%2F2020%2F11%2Ftigersfighting.jpg%3Fquality%3D75%26strip%3Dall%26w%3D2200%26h%3D1236)
Assertive communication is about compromise.
Using responses like "tell me more" and "thanks for understanding" helps shift the focus from yourself to others and leads to better conversations.

We live in an age of polarization. Many of us may be asking ourselves how, when people disagree with or discount us, we can persuade them to rethink their positions. The author, an organizational psychologist, has spent time with a number of people who succeeded in motivating the notoriously self-confident Steve Jobs to change his mind and has analyzed the science behind their techniques. Some leaders are so sure of themselves that they reject good opinions and ideas from others and refuse to abandon their own bad ones. But, he writes, “it is possible to get even the most overconfident, stubborn, narcissistic, and disagreeable people to open their minds.” He offers some approaches that can help you encourage a know-it-all to recognize when there’s something to be learned, a stubborn colleague to make a U-turn, a narcissist to show humility, and a disagreeable boss to agree with you.

Don’t try to change someone else’s mind. Instead, help them find their own motivation to change.
:extract_focal()/https%3A%2F%2Fpocket-syndicated-images.s3.amazonaws.com%2Farticles%2F5980%2F1611345286_GettyImages-672713099.jpg)
The goal should not be conversion but doubt.

Industrial genius Carl Braun believed that clear thinking and clear communication go hand in hand. Here the guide on writing productively to get things done.
:extract_focal()/https%3A%2F%2Fs3.amazonaws.com%2Fpocket-collectionapi-prod-images%2Fd93f5c7f-f085-4d78-9c7d-be340e1fd63c.jpeg)
Bridge the divide with thoughtful conversation techniques, next-level listening, and a dip into the science of changing minds.

Do you like being right? Of course, everyone does. Are you successful at convincing others? That’s a tougher one. We may politely disagree, avoid, or scream bloody murder at each other, but whatever our conflict style, no one is born, and few are raised, knowing how to persuade.
:extract_focal()/https%3A%2F%2Fpocket-syndicated-images.s3.amazonaws.com%2Farticles%2F3987%2F1586460732_GettyImages-523463250.jpg)
Developing user habits is not the same as demanding compliance. But sometimes that’s the task at hand.

Some people have a knack for buying products that flop, supporting political candidates who lose and moving to neighborhoods that fail to thrive.
:extract_focal()/https%3A%2F%2Fcdn.theatlantic.com%2Fassets%2Fmedia%2Fimg%2F2016%2F08%2FDIS_Hutson_SoSCharm%2Flead_720_405.jpg%3Fmod%3D1533692236)
:extract_focal()/https%3A%2F%2Fs3.amazonaws.com%2Fpocket-syndicated-images%2Farticles%2F654%2F1566583404_0.jpg)
Choose your words carefully and you can get someone to change their mind, or see you in a new light.

More than 2,000 years ago Aristotle outlined a formula on how to become a master of persuasion in his work Rhetoric . To successfully sell your next idea, try using these five rhetorical devices that he identified in your next speech or presentation: The first is egos or “character.” In order for your audience to trust you, start your talk by establishing your credibility. Then, make a logical appeal to reason, or “logos.” Use data, evidence, and facts to support your pitch. The third device, and perhaps the most important, is “pathos,” or emotion. People are moved to action by how a speaker makes them feel. Aristotle believed the best way to transfer emotion from one person to another is through storytelling. The more personal your content is the more your audience will feel connected to you and your idea.

The holiday season is around the corner. For most of us, it means we need to get gifts for our loved ones—our family, our friends, maybe even for people we don’t know all that well, such as clients and coworkers. The holiday season is notoriously stressful. Surveys show that nearly 7 people out of 10 ... Read More
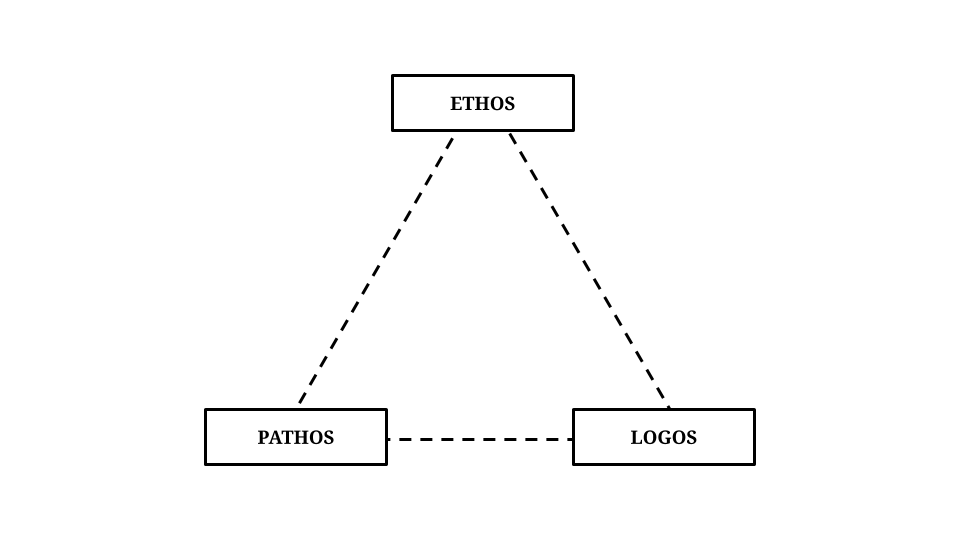
The three modes of persuasion — ethos, pathos, logos — are useful skills to master to persuade people and to understand how you’re being persuaded yourself.

Takedowns and clever quips are easy, but empathy and persuasion are better

Why some people are constantly approached by friendly nearbys whereas others might as well be invisible
Understanding user behavior is key to understanding how users interact with your product. Here are 15 steps to analyze & change their interactions to your benefit.

If you want someone to help, you’ll do better with a spec. It lists just four things: What is the problem to be solved? How are we going to solve it? How can we test that the thing we built m…

Supermarkets have always played tricks on your mind. Can they help you to eat better?
-->
behaviors/emotions
categories:
tags: behaviors emotions
date: 26 Mar 2025
slug:raindrop-behaviors-emotions

In the US, smiling is a reflexive gesture of goodwill, but Russians view it as a sign of stupidity. Social psychology research could help explain this cultural contrast.
Unsure where to start? Use this collection of links to our articles and videos to learn about some principles of human psychology and how they relate to UX design.

There is a lot of social psychology out there providing information that can inform our everyday lives, and most people are completely unaware of the research. Richard Wiseman makes this point in his book, 59 Seconds - we actually have useful scientific information, and yet we also have a vast self-help industry giving advice that

The fear of being duped is ubiquitous, but excessive scepticism makes it harder to trust one another and cooperate
Former General Electric CEO Jack Welch once nearly died of a heart attack.

Much of what you’ve read on this blog has been written in pajama pants. Writing directly follows meditation in my morning routine, so I’ve often gone right from the cushion to the coffeepot to the desk. Occasionally life would remind me that there are practical reasons to put on socially acceptable pants before beginning the workday. Someone could knock on

Feelings of loneliness prompt changes in the brain that further isolate people from social contact.

Disgust is surprisingly common across nature.

Happiness can sometimes feel just out of reach. But having more fun? You've got this — and those giggles and playful moments can make a big difference to your health and well-being.

Hacking the happiness treadmill
The magazine of the British Psychological Society - in print and online.

All fears can be divided into four broad categories which psychologists refer to as the four horsemen of fear: bodily, interpersonal, cognitive and behavioral fears. And each of the four horsemen of fear can be addressed by applying simple strategies.

What does the state of online shaming reveal about our democracy?

Some cats do it, but others can’t—and researchers still don’t fully understand why.

Do you feel perpetually bad, broken or unlovable? These tools will help you relate to yourself in a fairer, gentler way

A secure attachment style can help people initiate and maintain friendships.
:extract_focal()/https%3A%2F%2Fpocket-syndicated-images.s3.amazonaws.com%2Farticles%2F8050%2F1657925422_GettyImages-1330019780.jpg)
People who feel shame readily are at risk for depression and anxiety disorders

Have you ever gotten into a heated argument about politics? Maybe you’ve said something you're not proud of during game night with friends, or booed the opposing team at a sporting event. Psychologist Mina Cikara studies what happens in these moments — when our mindset shifts from “you and me” to “us and them.” This week on the show, Mina shares the profound ways that becoming a part of a group shapes our thoughts, feelings and behaviors.
:extract_focal()/https%3A%2F%2Fpocket-syndicated-images.s3.amazonaws.com%2Farticles%2F1817%2F1619220686_GettyImages-958204932.jpg)
Here’s why hiring managers say they often value emotional intelligence more highly than IQ.

Most of us are subjected to insults, sarcastic comments or bad feedback in our everyday lives. But we weren't built to deal with torrents of criticism.

Instead, befriend people who inspire awe in you.

From a young age we are primed to choose a favourite colour, but strangely as we grow up our preference often changes – and it's largely due to influences outside our control.

How does hating someone compare with anger, contempt or disgust? A clearer picture of what makes it unique is emerging

Ditch the tough talk, it won’t help. Instead cultivate your mental flexibility so you can handle whatever comes your way
:extract_focal()/https%3A%2F%2Fpocket-syndicated-images.s3.amazonaws.com%2Farticles%2F7184%2F1634082708_61661ee04c8a0.jpg)
There’s growing evidence that signals sent from our internal organs to the brain play a major role in regulating emotions and fending off anxiety and depression.
Regardless of where you are in the pathway of understanding how the human psyche works, this list of must-read psychology books will upgrade your personal library.
:extract_focal()/https%3A%2F%2Fpocket-syndicated-images.s3.amazonaws.com%2Farticles%2F5992%2F1611598543_GettyImages-103462741.jpg)
Fans of this violent music report feelings of transcendence and positive emotions; psychologists want to learn why.
[vc_row type=”full_width_background” full_screen_row_position=”middle” column_margin=”default” column_direction=”default” column_direction_tablet=”default” column_direction_phone=”default” scene_position=”center” top_padding=”48″ text_color=”dark” text_align=”left” row_border_radius=”none” row_border_radius_applies=”bg” overflow=”visible” overlay_strength=”0.3″ gradient_direction=”left_to_right” shape_divider_position=”bottom” bg_image_animation=”none”][vc_column column_padding=”no-extra-padding” column_padding_tablet=”inherit” column_padding_phone=”inherit” column_padding_position=”all” column_element_direction_desktop=”default” column_element_spacing=”default” desktop_text_alignment=”default” tablet_text_alignment=”default” phone_text_alignment=”default” background_color_opacity=”1″ background_hover_color_opacity=”1″ column_backdrop_filter=”none” column_shadow=”none” column_border_radius=”none” column_link_target=”_self” column_position=”default” gradient_direction=”left_to_right” overlay_strength=”0.3″ width=”1/1″ tablet_width_inherit=”default” animation_type=”default” bg_image_animation=”none” border_type=”simple” column_border_width=”none” column_border_style=”solid”][vc_column_text] Interpersonal Reactivity...

Think about your life like an x-y axis, with four quadrants.

Anger is a fuel that’s dangerous when out of control. But managed well, it can energise you to identify and confront problems

When we are feeling something, we don't really stop to define that emotion or think about the exact emotion that we are experiencing. We just feel and go through it; may it be sadness, anger or happiness. As human beings, we experience a plethora of feelings and emotions in our lifetime that range over several forms and types. This article is an attempt to list down an extensive list of those emotions.

Could you make a list of all the emotions you feel in a day? Emotions play a fascinating
:extract_focal()/https%3A%2F%2Fs3.amazonaws.com%2Fpocket-syndicated-images%2Farticles%2F124%2F1566573710_xscscx.jpg)
How well do you recognize and understand your emotions? What about the emotions of those around you?
:extract_focal()/https%3A%2F%2Fs3.amazonaws.com%2Fpocket-syndicated-images%2Farticles%2F2201%2F1573829164_porpjp.jpg)
Not only is ‘Je suis excité’ not the appropriate way to convey excitement in French, but there seems to be no real way to express it at all.

One emotion inspired our greatest achievements in science, art and religion. We can manipulate it – but why do we have it?
Dr. Daniel Kahneman features on the latest Farnam Street podcast and it’s a surprising episode. Kahneman wrote Thinking Fast and Slow. I admire Kahneman a great deal. Not for his Nobel or for his work, which are both impressive, but for his humility. Some of the key tenets of Kahneman’s work in his famous book were disproved. And he owned up to it, both in print and on the podcast. That’s the hallmark of someone with great integrity, and it’s a sign to trust someone more.

Being ‘good’ need not take years of ethical analysis: just a few moments of gratitude can set you on the path to virtue
:extract_focal()/http%3A%2F%2Fstatic.nautil.us%2F14797_53885282fbff8407b3b6e820b7830180.jpg)
Look like you‘re trusting your gut and others will trust you.

Immanuel Kant held that moral education is hydraulic: shame squashes down our vices, making space for virtue to rise up

What happens when machines learn to manipulate us by faking our emotions? Judging by the rate at which researchers are developing human-like AI agents, we’re about to find out. Researchers around the world are trying to create more human-li

Is Rick Deckard a replicant, an advanced bioengineered being? The jury concerning the character in 1982’s Blade Runner is still out. Harrison Ford, who plays Deckard in the film, thinks he’s human. Ridley Scott, the film’s director, is adamant that he’s not.* Hampton Fancher, the screenwriter for the original film and the sequel, Blade Runner […]
The mysteries of consumer behavior, explained by ice cream and independent bookstores.

Rather than being a cringey personal failing, awkwardness is a collective rupture – and a chance to rewrite the social script
-->
behaviors/leadership
categories:
tags: behaviors leadership
date: 26 Mar 2025
slug:raindrop-behaviors-leadership

These two principles are equally powerful and critical to manage behavior, but the order matters.
Discover the power of examples in shaping our lives. Explore quotes on example and how they inspire us to reach new heights.

What exactly is psychological safety? It’s a term that’s used a lot but is often misunderstood. In this piece, the author answers the following questions with input from Harvard Business School professor Amy Edmondson, who coined the phrase “team psychological safety”: 1) What is psychological safety? 2) Why is psychological safety important? 3) How has the idea evolved? 4) How do you know if your team has it? 5) How do you create psychological safety? 6) What are common misconceptions?

Corporate leadership today is more public than ever before thanks to digital communication and the web. The status quo has been upended by the ease with
Have you ever wondered about internal organization dynamics and why some groups of people (who aren’t on the same team) are more successful than others? Why different “tribes” inside the organization seem to be at war with one another lowering performance in increasing politics? Why certain groups of people never seem to do anything? Or why …

Editor’s note: Scott Weiss is a partner at Andreessen Horowitz and the former co-founder and CEO of IronPort Systems, which was acquired by Cisco in 2007. An approachable and authentic CEO is essential to fostering a high-performance, open communications culture.

Here’s what the best leaders do.
U.S. Army Engineer School Commandant’s Reading List
How to minimize the drama and keep your team on track.
I’ve found the following to be common (and not easily taught) in people whose product skills I admire.
John Farrell took his team from the bottom of their division last year to the 2013 World Series with a set of tactics every manager should learn.
“I’ve probably revised this investor pitch deck 200 times,” a founder told me recently. She’d met with more than 50 potential investors before closing a seed round last month. This might sound excessive to some, but her experience is not unusual. Entrepreneurs often spend hundreds of hours raising funds from angel and venture capital investors. While these activities are clearly important, analysis of new data on startups suggests that founders should also dedicate significant time to something that many people overlook: recruiting great mentors. This simple strategy can increase a company’s odds of success more than almost anything else.
Awesome List of resources on leading people and being a manager. Geared toward tech, but potentially useful to anyone. - LappleApple/awesome-leading-and-managing
The home of Process Excellence covers topics from Business Process Management (BPM) to Robotic Process Automation (RPA), AI, Lean Six Sigma and more. Latest news, freshest insight and upcoming events and webinars.
Apple is famous for not engaging in the focus-grouping that defines most business product and marketing strategy. Which is partly why Apples products and advertising are so insanely great. They have the courage of their own convictions, instead of the opinions of everyone else’s whims. On the subject, Steve Jobs loves to quote Henry Ford […]
Leadership Now is a leading source for leadership development and analysis. We believe that anyone can make a difference by leading from where they are.
"The success of your startup is determined before you ship a single line of code." Okay, you’re right, Sun Tzu, the ancient Chinese war general and author
We all know that leaders need vision and energy, but after an exhaustive review of the most influential theories on leadership–as well as workshops with thousands of leaders and aspiring leaders–the authors learned that great leaders also share four unexpected qualities. The first quality of exceptional leaders is that they selectively reveal their weaknesses (weaknesses, not fatal flaws). Doing so lets employees see that they are approachable. It builds an atmosphere of trust and helps galvanize commitment. The second quality of inspirational leaders is their heavy reliance on intuition to gauge the appropriate timing and course of their actions. Such leaders are good “situation sensors”–they can sense what’s going on without having things spelled out for them. Managing employees with “tough empathy” is the third quality of exceptional leadership. Tough empathy means giving people what they need, not what they want. Leaders must empathize passionately and realistically with employees, care intensely about the work they do, and be straightforward with them. The fourth quality of top-notch leaders is that they capitalize on their differences. They use what’s unique about themselves to create a social distance and to signal separateness, which in turn motivates employees to perform better. All four qualities are necessary for inspirational leadership, but they cannot be used mechanically; they must be mixed and matched to meet the demands of particular situations. Most important, however, is that the qualities encourage authenticity among leaders. To be a true leader, the authors advise, “Be yourself–more–with skill.”
A company study found that a manager’s technical skills were far less valued by employees than people skills.
Fight the Good Fight The probability that we may fall in the struggle ought not to deter us from the support of a cause we believe to be just. Try Honey Before Vinegar If you would win a man to your cause, first convince him that you are his sincere friend. On the contrary … …
The Ten Golden Rules of Leadership explores the classical figures to determine the ten crucial axioms of leadership. Rule 1. Know Theyself. Rule 2 ...
The ability to get issues on the table and work through them constructively is critical to having a healthy culture. Managers can normalize productive conflict on your team by using an exercise to map out the unique value of each role and the tensions that should exist among them. Draw a circle and divide that circle into enough wedges to represent each role on your team. For each role, ask: What is the unique value of this role on this team? On which stakeholders is this role focused? What is the most common tension this role puts on team discussions? Answer those questions for each member of the team, filling in the wedges with the answers. As you go, emphasize how the different roles are supposed to be in tension with one another. With heightened awareness and a shared language, your team will start to realize that much of what they have been interpreting as interpersonal friction has actually been perfectly healthy role-based tension.
It’s important to understand that when you, as a leader, communicate with your team, using weaker words weakens your message and blunts your ability to inspire people. It’s not enough to just throw thoughts out there and hope for the best. You need to actively recommend ideas and assert their worthiness in all of your communications. For example, consider these “power words”: “I’m proposing (not “sharing”) an idea that will make our process more efficient.” “I’m suggesting (not “sharing”) a new logo that better conveys our brand message.” “I’m recommending (not “sharing”) a campaign to make our workplace more diverse.” Ultimately, audiences respond more actively to big points than to small words, but thoughtful leaders need to assess both, knowing that the more powerfully they come across — even in small ways — the greater impact they have on the people they hope to inspire.
Industrial genius Carl Braun believed that clear thinking and clear communication go hand in hand. Here the guide on writing productively to get things done.

"Unconscious leadership happens when we aren't self-aware, which puts fear in the driver's seat."

The soft skills are what matter most.

The military's toughest training challenges have a lot in common with outdoor sufferfests like the Barkley Marathons and the Leadville Trail 100: you have to be fit and motivated to make the starting line, but your mind and spirit are what carry you to the end. A Ranger graduate breaks down an ordeal that shapes some of the nation's finest soldiers.

Airline pilot Alfred Haynes and other leaders who’ve saved lives show that modest people can achieve miracles under pressure.

Why do issues remain open secrets in organizations, where multiple employees know about a problem or a concern, but no one publicly brings it up? Researchers recently explored this in a set of studies. They found that as issues become more common knowledge among frontline employees, the willingness of any individual employee to bring those issues to the attention of the top-management decreased. Instead of speaking up, what they observed among their participants was something like the bystander effect, a psychological phenomena describing how people stay on the sidelines as passive bystanders, waiting for others to act rather than do something themselves. If managers want to avoid the bystander effect so that problems don’t go unresolved, they should tell employees that their voices are not redundant and that they need to share their opinions even if others have the same information.

The most successful outlaws live by a code, and in many ways John Perry Barlow was an archetypal American outlaw all of his life.
-->
behaviors/prodmgmt
categories:
tags: behaviors prodmgmt
date: 26 Mar 2025
slug:raindrop-behaviors-prodmgmt
Correction fluids have improbably outlasted the typewriter and survived the rise of the digital office.
Learn how to create customer habits using powerful triggers like time, mood, location, and social influences. Discover techniques to boost product usage.
Unsure where to start? Use this collection of links to our articles and videos to learn about some principles of human psychology and how they relate to UX design.
On a flight from Paris to London in 1983 Jane Birkin, an Anglo-French chanteuse and actress, spilled the contents of her overstuffed straw...
by John MahoneyThis is a bucket of chum. Chum is decomposing fish matter that elicits a purely neurological brain stem response in its target consumer: larger fish, like sharks. It signals that they should let go, deploy their nictitating ...
Why might people decline an offer of up to $10,000 just to keep their feet on the ground?
Not every business needs to have habit-forming products. Here's how two companies hooked customers and formed habits with products they rarely used.
Many new products fail because their creators use an ineffective market segmentation mechanism, according to HBS professor Clayton Christensen. It's time for companies to look at products the way customers do: as a way to get a job done.
It can be more important than word of mouth.
01 Intro One of the best books I have read in the last few years is The Elephant in the Brain by Robin Hanson and Kevin Simler. The book makes two main arguments: a) Most of our everyday actions can be traced back to some form of signaling or status seeking b) Our brains deliberately hi
New research indicates that consumers are catching on and may be annoyed by certain nudges, potentially limiting their effectiveness.
Your product can’t suck. That’s a given. But it’s also not enough to be a good product that doesn’t hook your customer and connect to their pain points.
Are consumers more likely to buy if they see the price before the product, or vice versa? Uma Karmarkar and colleagues scan the brains of shoppers to find out.
Hello, my name is Andrew, and I can’t stop disagreeing.
From ATMs to automated checkouts to fast food.
The ability to get issues on the table and work through them constructively is critical to having a healthy culture. Managers can normalize productive conflict on your team by using an exercise to map out the unique value of each role and the tensions that should exist among them. Draw a circle and divide that circle into enough wedges to represent each role on your team. For each role, ask: What is the unique value of this role on this team? On which stakeholders is this role focused? What is the most common tension this role puts on team discussions? Answer those questions for each member of the team, filling in the wedges with the answers. As you go, emphasize how the different roles are supposed to be in tension with one another. With heightened awareness and a shared language, your team will start to realize that much of what they have been interpreting as interpersonal friction has actually been perfectly healthy role-based tension.
Tips from successful campaigns promoting everything from shapewear to prostate health.
There has been a lot of discussion in the design world recently about "change aversion." Most of the articles about it seem to be targeting the new Google redesign, but I've certainly seen this same discussion happen at many companies when big changes aren't universally embraced by users.
Driven by buyers' need for consistency and explanation, the most popular pricing method uses a surprisingly simple formula based on size.
A Guide to Reddit, Its Key Competitive Advantages, and How to Unbundle It
The history of technology is one of subtracting humans and replacing them with machines. Do the unintended consequences include creating shoplifters?
The best detectives seem to have almost supernatural insight, but their cognitive toolkit is one that anybody can use
As Spotify turns 15 this month, we look at 15 ways the streaming giant has changed, reinvented and reshaped music and the music business.
Think you got a good deal? Look again.
Imagine you could work more and be wildly productive. And you wouldn’t need to force yourself to work.
An introduction to forming hypothesis statements for product experimentation.
Some products sell themselves, but habits don’t. They require a bit of finesse.
Hello, my name is Andrew, and I can’t stop disagreeing.
Leaders need to lead by example using OKRs, showing that they are equally as committed to successful outcomes as anyone on the front lines of the business.
Consumer needs spark consumer journeys. How can marketers identify those needs and address them? The latest consumer research from Google will help.
Nir Eyal’s Hooked Model explains how games keep players coming back.
Understanding user behavior is key to understanding how users interact with your product. Here are 15 steps to analyze & change their interactions to your benefit.
The mysteries of consumer behavior, explained by ice cream and independent bookstores.
-->
behaviors/bias
categories:
tags: behaviors bias
date: 26 Mar 2025
slug:raindrop-behaviors-bias
What is Maslow's Hammer? Maslow's Hammer says that we rely too much on familiar tools (not because they're good - only because they're familiar). As the saying goes, “When you have a hammer, everything’s a nail.” It's why doctors are more likely to recommend surgery for back pain than alternative treatments like massage or chiro.
What is the Concorde Fallacy? 🧠 The Concorde Fallacy describes how we will continue to defend a bad investment, even when that defense costs more than just giving up. In 1956, discussions started in England to create a supersonic airliner that would get people from London to NYC in under 3 hours (that's less than
Two concepts can help explain why society seems increasingly unable to agree on basic facts.

One of the major findings in last 50 years has been what people had suspected all along: human thinking and judgment often isn’t rational. By this, I mean given a situation where someone has to make a decision, she will often take a decision that “leaps” to her immediately rather taking than a decision that… Read More

There used to be a generic belief that humans are completely rational. It is easily understandable why a belief like this was popular…
:extract_focal()/https%3A%2F%2Fpocket-syndicated-images.s3.amazonaws.com%2Farticles%2F4780%2F1592580478_file-20190926-51410-12m9akjcrop.jpg)
Research shows how attractive employees can rub some customers the wrong way.
:max_bytes(150000):strip_icc()/prospecttheory.asp-FINAL-55296758049c4501808f54b52747cb35.png)
Prospect theory argues that if given the option, people prefer more certain gains rather than the prospect of larger gains with more risk.

The popular idea that avoiding losses is a bigger motivator than achieving gains is not supported by the evidence


If we really want to understand how we can nudge people into making better choices, it’s important to understand why they often make such poor ones.
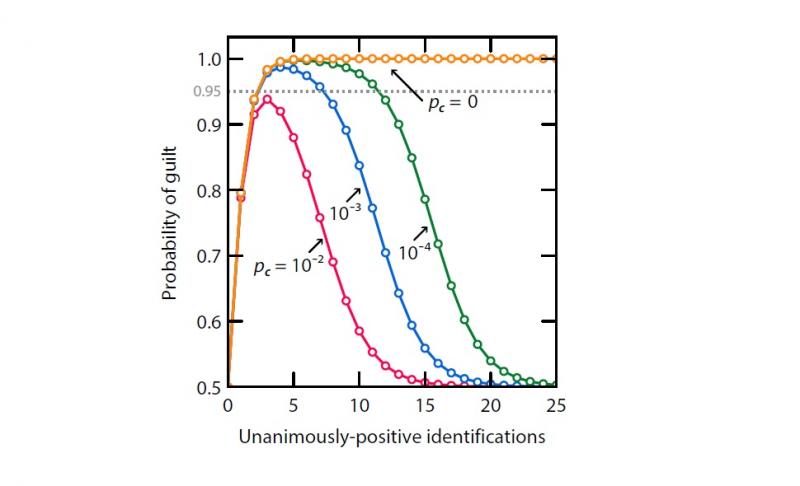
(Phys.org)—Under ancient Jewish law, if a suspect on trial was unanimously found guilty by all judges, then the suspect was acquitted. This reasoning sounds counterintuitive, but the legislators of ...

There's an angry divisive tension in the air that threatens to make modern politics impossible. Elizabeth Lesser explores the two sides of human nature within us (call them "the mystic" and "the warrior”) that can be harnessed to elevate the way we treat each other. She shares a simple way to begin real dialogue -- by going to lunch with someone who doesn't agree with you, and asking them three questions to find out what's really in their hearts.
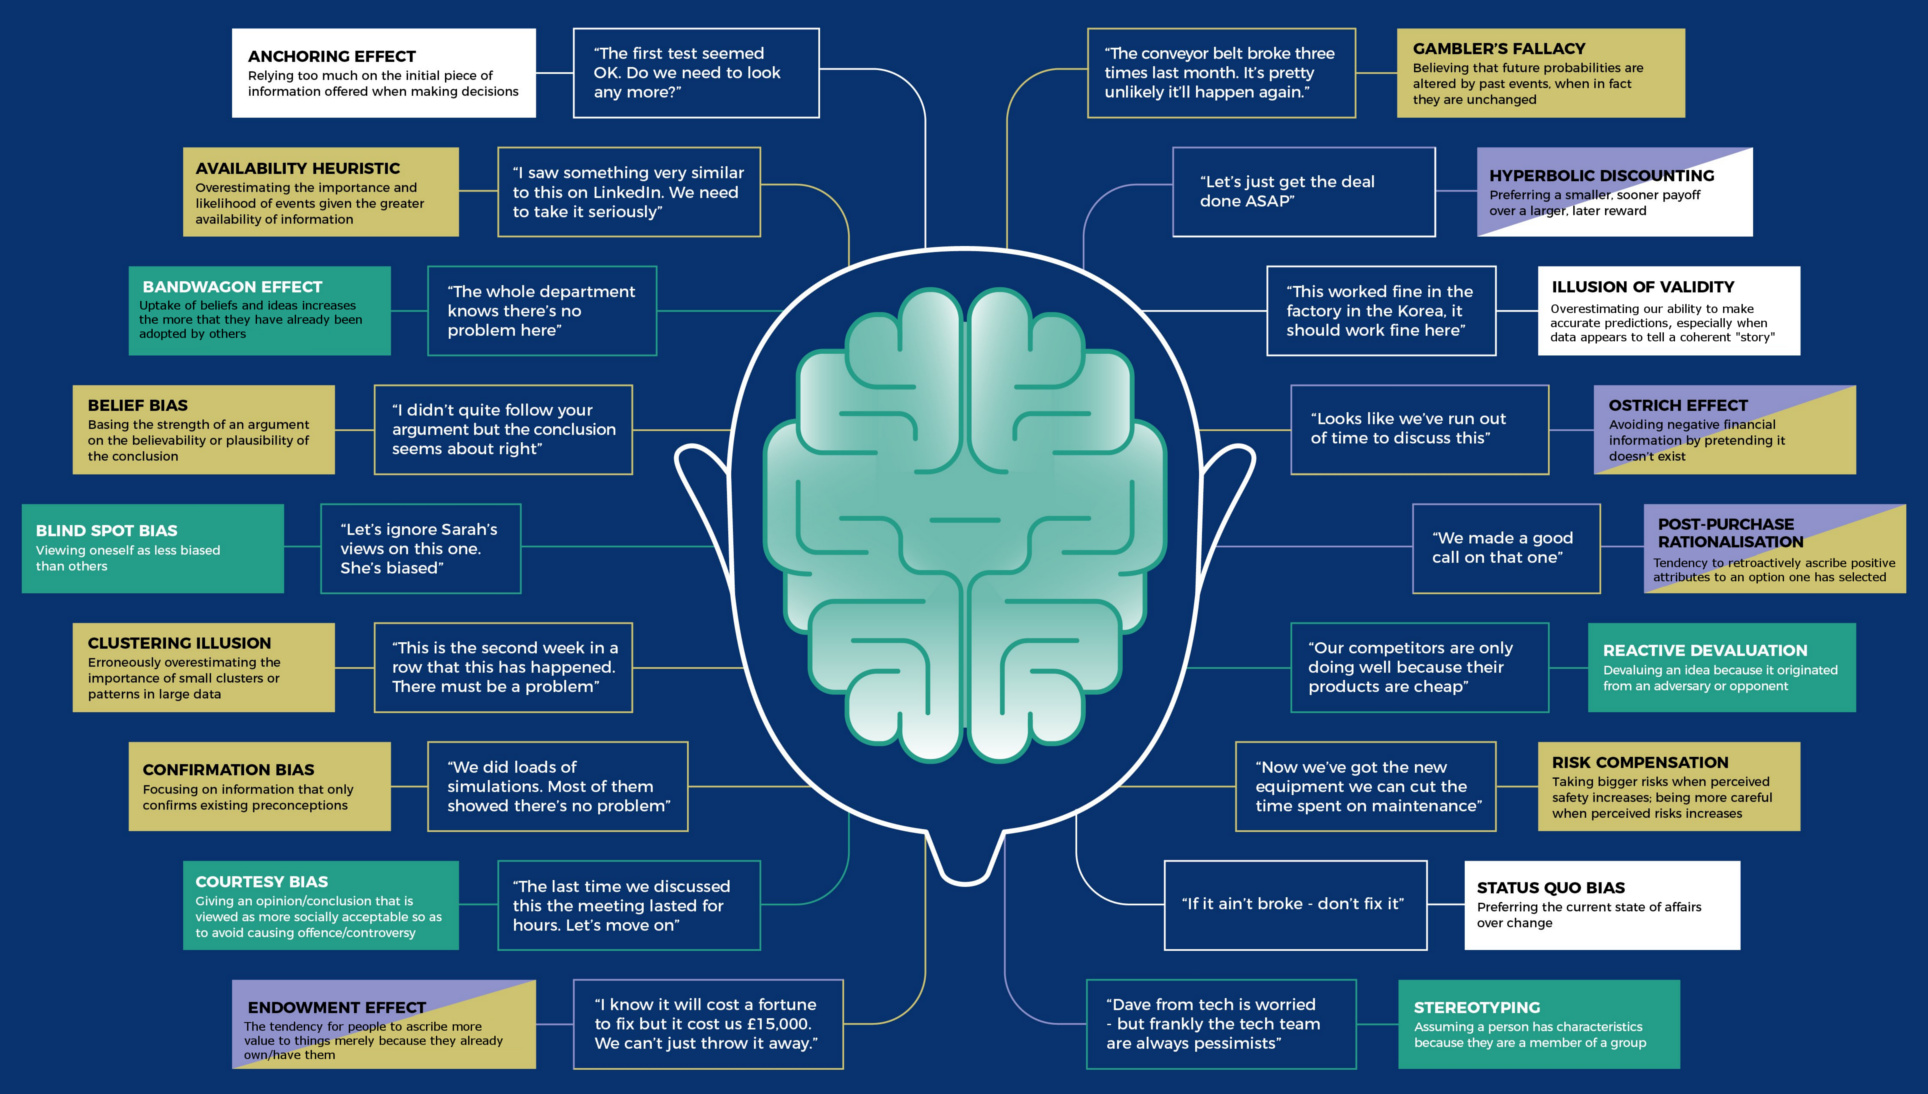
Here are 18 of the most common mental mistakes in business and investing. Make sure to learn from these cognitive bias examples to make better decisions.

Short analysis on the current state of affairs and a few tips to keep in mind.

Human brain processes information as well as how it forms certain patterns of behavior. Discover cognitive psychology tips for UX.

A principle that explains decision-making — from investor behavior to insurance markets — isn't ironclad, experts argue.

We tend to judge the likelihood and significance of things based on how easily they come to mind. The more “available” a piece of information is to us, the more important it seems. The result is that we give greater weight to information we learned recently because a news article you read last night comes to mind easier than a science class you took years ago. It’s too much work to try to comb through every piece of information that might be in our heads.
Color can affect judgment and decision making, and its effects may vary across cultures. Research reported in this article shows that cross-cultural color effects on risk preferences are influenced by personal associations of color-gain/loss. Our research finds a cultural reactance effect, a phenomenon in which people who hold culturally incongruent (vs. cultural mainstream) color associations

Five ways to do noise reduction, from the field of judgment and decision making.
The goal should not be conversion but doubt.

Inside the distinctive, largely unknown ideology of American policing — and how it justifies racist violence.

Conspiracy theories seem to meet psychological needs and can be almost impossible to eradicate. One remedy: Keep them from taking root in the first place.

Why Informing your customers of a sunk cost can actually help you increase your sales.

When certain events need to take place to achieve a desired outcome, we’re overly optimistic that those events will happen. Here’s why we should temper those expectations.

Great thought and effort go into creating restaurant menus – and there are some very powerful psychological tricks employed to make you choose.

Here’s a simple practice that can boost your intelligence, help you avoid cognitive bias, and maybe even be happy to prove your own ideas…
-->
semiconductors/chip-design
categories:
tags: chip-design semiconductors
date: 26 Mar 2025
slug:raindrop-semiconductors-chip-design

Most people think of machine instructions as the fundamental steps that a computer performs. However, many processors have another layer of ...
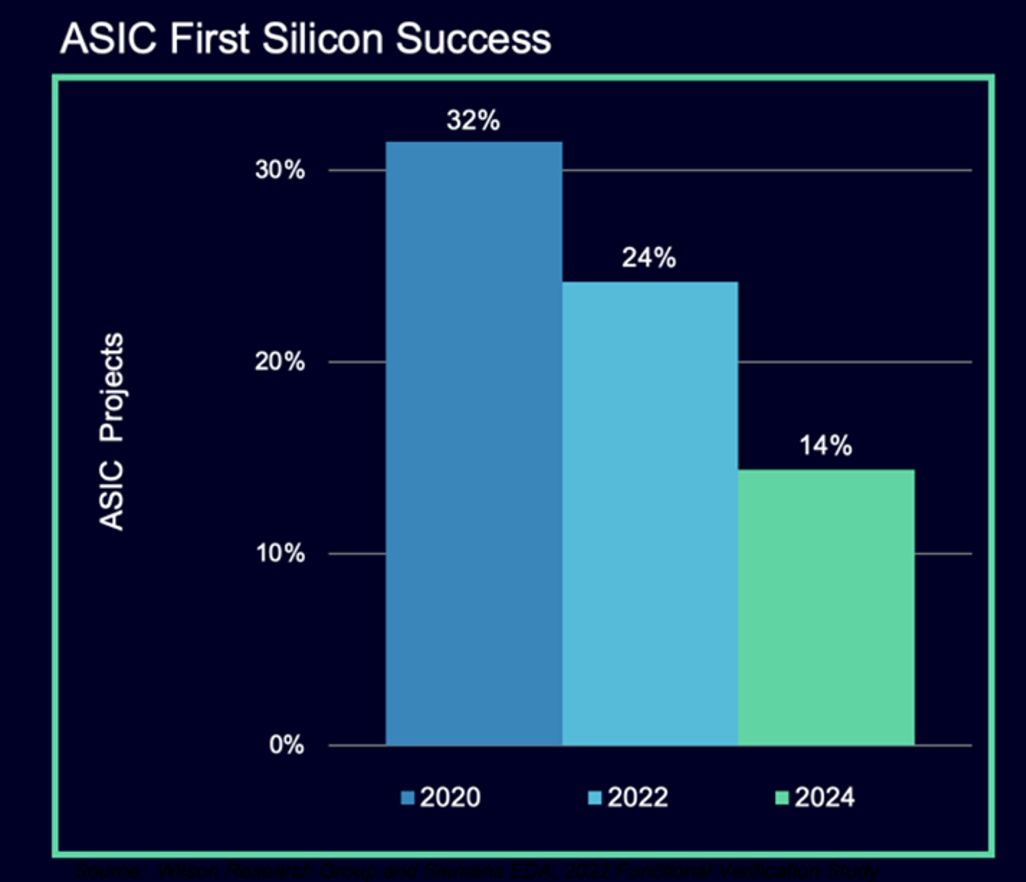
Number of designs that are late increases. Rapidly rising complexity is the leading cause, but tools, training, and workflows need to improve.


[vc_row][vc_column column_width_percent=”90″ gutter_size=”3″ overlay_alpha=”50″ shift_x=”0″ shift_y=”0″ shift_y_down=”0″ z_index=”0″ medium_width=”0″ mobile_width=”0″ width=”1/1″ uncode_shortcode_id=”158708″][vc_column_text uncode_shortcode_id=”154284″] Conventional wisdom in semiconductor manufacturing has long […]

After persistent rumors refused to recede, AMD steps in with a clear explanation why dual-CCD V-Cache doesn't exist.

In 1993, Intel released the high-performance Pentium processor, the start of the long-running Pentium line. The Pentium had many improvement...

Large Language Models (LLMs) have become a cornerstone of artificial intelligence, driving advancements in natural language processing and decision-making tasks. However, their extensive power demands, resulting from high computational overhead and frequent external memory access, significantly hinder their scalability and deployment, especially in energy-constrained environments such as edge devices. This escalates the cost of operation while also limiting accessibility to these LLMs, which therefore calls for energy-efficient approaches designed to handle billion-parameter models. Current approaches to reduce the computational and memory needs of LLMs are based either on general-purpose processors or on GPUs, with a combination of weight quantization and

A loop buffer sits at a CPU's frontend, where it holds a small number of previously fetched instructions.


I was studying the silicon die of the Pentium processor and noticed some puzzling structures where signal lines were connected to the silico...
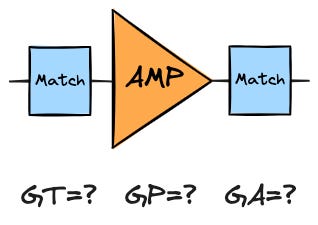
Transducer, Unilateral, Available and Power Gain; what they mean and how to calculate them.

Basic concepts required to understand classes of operation in power amplifiers.

When I recently interviewed Mike Clark, he told me, “…you’ll see the actual foundational lift play out in the future on Zen 6, even though it was really Zen 5 that set the table for that.” And at that same Zen 5 architecture event, AMD’s Chief Technology Officer Mark Papermaster said, “Zen 5 is a ground-up redesign of the Zen architecture,” which has brought numerous and impactful changes to the design of the core.
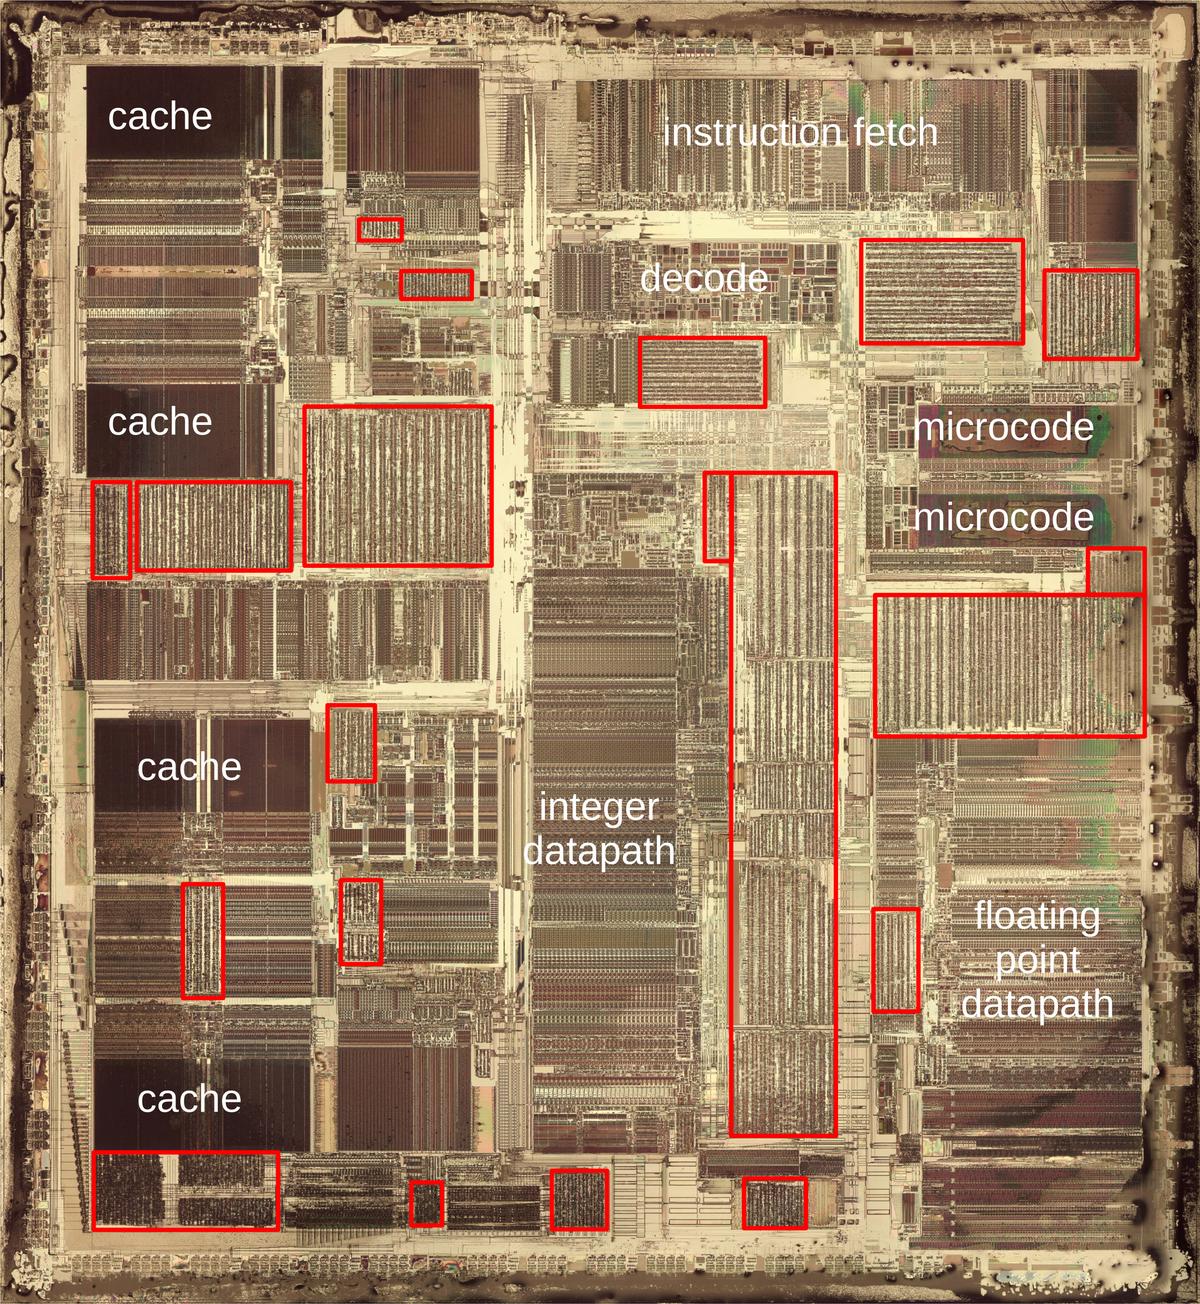
Intel released the powerful Pentium processor in 1993, a chip to "separate the really power-hungry folks from ordinary mortals." The origin...

A technical paper titled “Basilisk: Achieving Competitive Performance with Open EDA Tools on an Open-Source Linux-Capable RISC-V SoC” was published by researchers at ETH Zurich and University of Bologna. Abstract: “We introduce Basilisk, an optimized application-specific integrated circuit (ASIC) implementation and design flow building on the end-to-end open-source Iguana system-on-chip (SoC). We present enhancements to... » read more
This paper aims to provide insights into the thermal, analog, and RF attributes, as well as a novel modeling methodology, for the FinFET at the industry standard 5nm CMOS technology node. Thermal characterization shows that for a 165K change in temperature, the Sub-threshold Slope (SS) and threshold voltage vary by 69 % and ~70 mV, respectively. At room temperature, a single gate contacted n-FinFET RF device exhibits a cutoff and maximum oscillation frequency of ~100 GHz and ~170 GHz, respectively. Analog and RF Figures of Merit (FoMs) for 5 nm technology at a device level and their temperature sensitivity are also reported. The industry standard BSIM-CMG model is modified to capture the impact of self-heating (SH) and parasitics. The SH model is based on measured data, and the modeling approach renders it independent of other model parameters. To the authors’ knowledge, an iteration free approach to develop a model-card for RF applications is explained for the very first time. Excellent agreement between the measured data and the model indicates that our methodology is accurate and can be used for faster PDK development.

In semiconductor design, “sign-off” during the tape-out (tapeout) of a chip refers to the formal approval process to ensure that the chip design is error-free, meets all specifications, and is ready for manufacturing at the foundry. It is essential because it minimizes the risk of costly errors, ensures compliance with foundry requirements, and validates that

Planar to FinFET to Nanosheet to Complementary FET to 2D

Study tries to settle a bitter disagreement over Google’s chip design AI

While terms often are used interchangeably, they are very different technologies with different challenges.

RDL, an abbreviation for Redistribution Layer, that is, to make one or more layers of metal on the active chip side to redistribute the pins of the chip.

Historically Intel put all its cumulative chip knowledge to work advancing Moore's Law and applying those learnings to its future CPUs. Today, some of

Intel's multi-die interconnect bridge (EMIB) is an approach to in-package high-density interconnect of heterogeneous chips.

Powered by the promises of the CHIPS Act, Intel is investing more than $100 billion to increase domestic chip manufacturing capacity and capabilities.

From idea to chip design in minutes! TT09 Closes in TT09 Closes in 44 DAYS 44 HOURS 44 MINS 44 SECS Tiles PCBs Tiny Tapeout is an educational project that makes it easier and cheaper than ever to get your designs manufactured on a real chip! Read the paper here. See what other people are making by taking a look at what was submitted on our previous shuttles.

A new technical paper titled “APOSTLE: Asynchronously Parallel Optimization for Sizing Analog Transistors Using DNN Learning” was published by researchers at UT Austin and Analog Devices. Abstract “Analog circuit sizing is a high-cost process in terms of the manual effort invested and the computation time spent. With rapidly developing technology and high market demand, bringing... » read more

AI firm Synopsys has announced that its DSO.ai tool has successfully aided in the design of 100 chips, and it expects that upward trend to continue.
Book repository "Analysis and Design of Elementary MOS Amplifier Stages" - bmurmann/Book-on-MOS-stages

The following is a list of my articles on various topics. Besides technical articles, news pieces that might have useful technical information are also included. You can find my articles on FPGA...

Learn about voltage waves and how they relate to an important basic concept of radio frequency (RF) circuit design: transmission lines.

Interconnects—those sometimes nanometers-wide metal wires that link transistors into circuits on an IC—are in need of a major overhaul. And as chip fabs march toward the outer reaches of Moore’s Law, interconnects are also becoming the industry’s choke point.
Book repository "Analysis and Design of Elementary MOS Amplifier Stages" - bmurmann/Book-on-MOS-stages

A vast majority of modern digital integrated circuits are synchronous designs. They rely on storage elements called registers or flip-flops, all of which change their stored data in a lockstep manner with respect to a control signal called the clock. In many ways, the clock signal is like blood flowing through the veins of a

The high frequencies and data rates involved in 5G designs makes layout verification all the more important.

New technical paper titled “Bridging the Gap between Design and Simulation of Low-Voltage CMOS Circuits” from researchers at Federal University of Santa Catarina, Brazil. Abstract “This work proposes a truly compact MOSFET model that contains only four parameters to assist an integrated circuits (IC) designer in a design by hand. The four-parameter model (4PM) is... » read more

New technical paper titled “A Review on Transient Thermal Management of Electronic Devices” from researchers at Indian Institute of Technology Bombay. Abstract “Much effort in the area of electronics thermal management has focused on developing cooling solutions that cater to steady-state operation. However, electronic devices are increasingly being used in applications involving time-varying workloads. These... » read more

The researchers are considered a key to the company’s future. But they have had a hard time shaking infighting and controversy over a variety of issues.

When you’re baking a cake, it’s hard to know when the inside is in the state you want it to be. The same is true—with much higher stakes—for microelectronic chips: How can engineers confirm that what’s inside has truly met the intent of the designers? How can a semiconductor design company tell wh
An integrated cache and memory access time, cycle time, area, leakage, and dynamic power model - HewlettPackard/cacti

Silvaco provides standard cell library design and optimization services
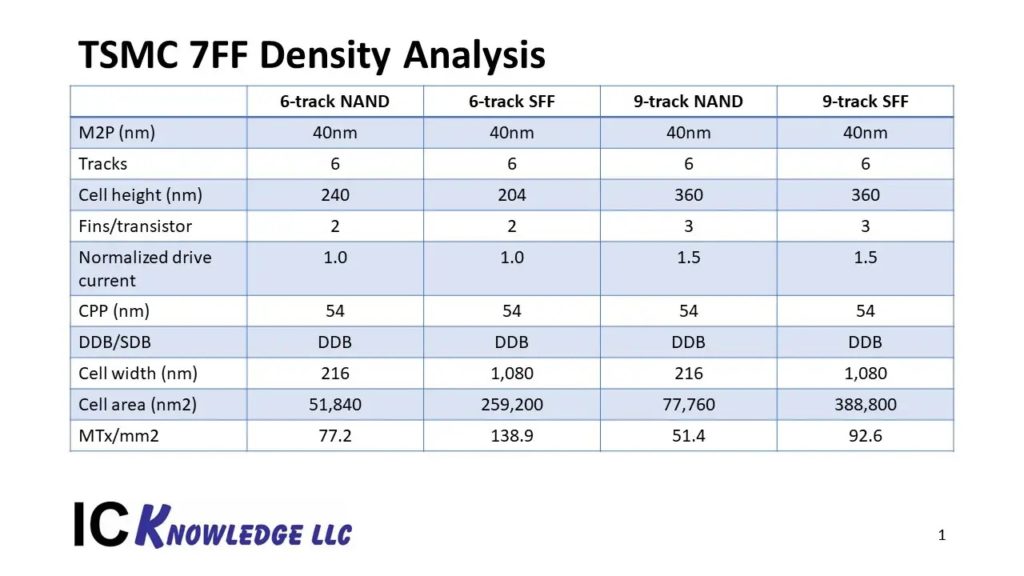
I have written a lot of articles looking at leading…

SoC clock tree overview, metrics that help qualify a clock tree and most commonly used clock tree distribution methodologies.

Some things will get better from a design perspective, while others will be worse.

New interconnects offer speed improvements, but tradeoffs include higher cost, complexity, and new manufacturing challenges.
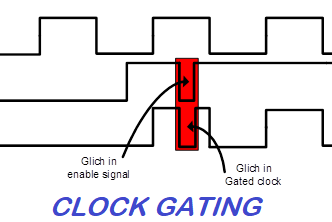
Clock Gating is defined as: “Clock gating is a technique/methodology to turn off the clock to certain parts of the digital design when not needed”. The Need for Clock Gating With most of the SoCs heavily constrained by power budgets, it is of utmost importance to reduce power consumption as much as possible
Leakage current can contribute to power dissipation, especially at lower threshold voltages. Learn about six types of leakage current that can be found in MOS transistors.

Gate-all-around FETs will replace finFETs, but the transition will be costly and difficult.

How can you calculate the number of dies per wafer? A free online tool, DPW equation and reference to two other DPW calculators. Trusted by Amkor and GF.

Static Timing Analysis? Read here the best overview to STA, including theory, real examples, ilustrations, tips and tricks.

In this article, we’ll discuss another group of thermal data, called thermal characterization parameters denoted by the Greek letter Psi (Ψ).

DIE YIELD CALCULATOR Use this online calculator to figure out die yield using Murphy’s model. You’ll need to know the die size, wafer diameter, and defect density. iSine is your complete resource for ASIC design – from concept to manufacturing and testing. We have expertise in system architecture, VHDL, Verilog, gate arrays, mixed signal, full...

Learn about an important thermal metric for designing the interface between an IC package and a heat sink.

Watch the thermal measurement, junction-to-case thermal resistance, in action as we use it to calculate the thermal considerations for a given system.

Engineers must keep pace with advanced IC packaging technology as it evolves rapidly, starting with understanding the basic terms.

Assessing the thermal performance of an IC package becomes easier if you understand this common, but often misapplied, parameter known as theta JA.

In this article, we will learn how to find the optimal size of a transistor/logic gate present in a larger circuit to provide the desired performance using the linear delay model.
When they were first commercialized at the 22 nm node, finFETs represented a revolutionary change to the way we build transistors, the tiny switches in the “brains” of a chip. As compared to...

In this article, we'll discuss the Elmore delay model, which provides a simplistic delay analysis that avoids time-consuming numerical integration/differential equations of an RC network.
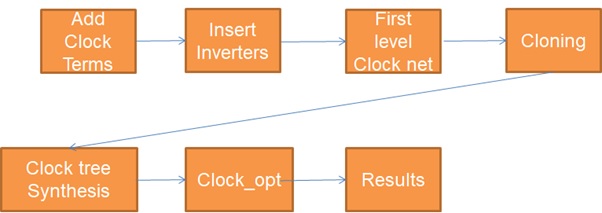
The semiconductor industry growth is increasing exponentially with high speed…

Looking at a typical SoC design today it's likely to…

Single-clock design is not always as easy as it seems.
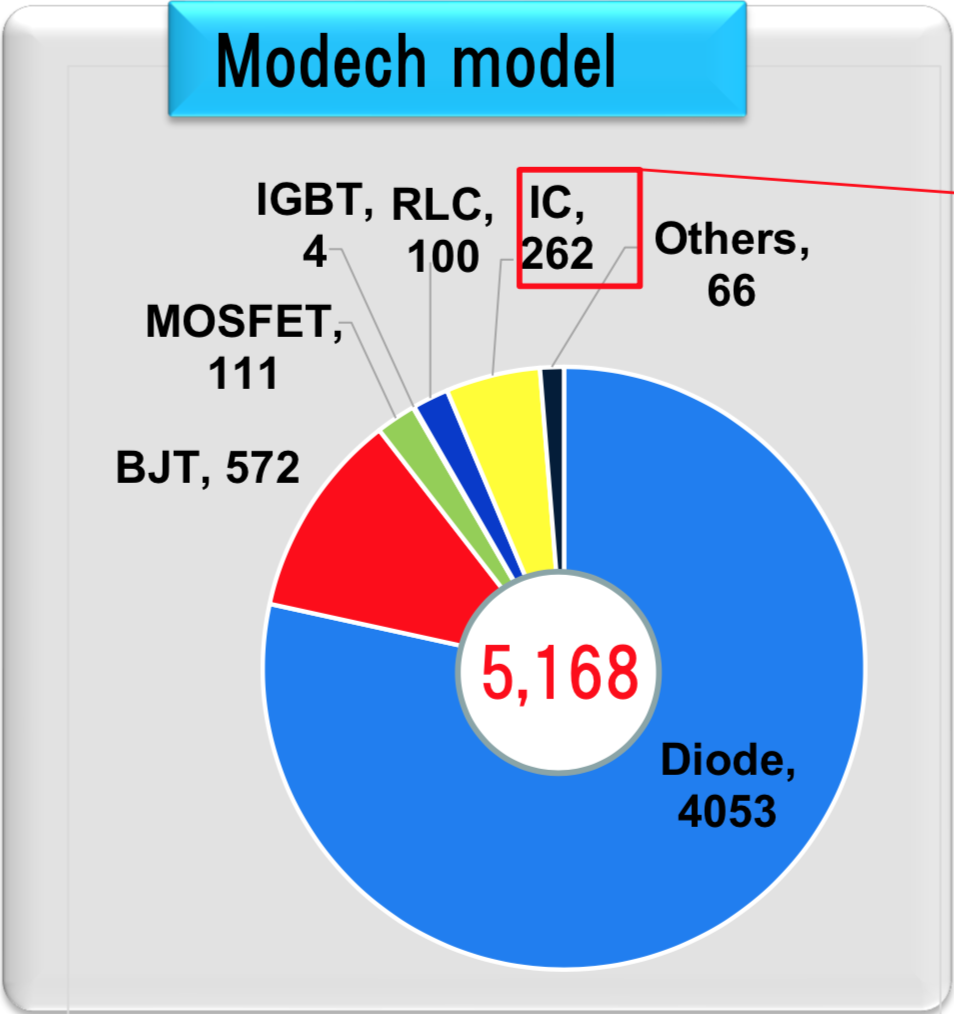
SPICE (Simulation Program with Integrated Circuit Emphasis) is an open-source analog electronic circuit simulator. | SPICE is undoubtedly one of the most popular modeling libraries available, and Japanese e-commerce company MoDeCH is seeking to make the power of SPICE available to everyone.

Accurately determine parasitic effects with the proper set up of two different methods.

Process Corner Explosion, At 7nm and below, modeling what will actually show up in silicon is a lot more complicated.

Post date: Sep 19, 2014 10:01:08 PM

Fab Cost, WFE Implications, Backside Power Details
-->
semiconductors/cpus
categories:
tags: cpus semiconductors
date: 26 Mar 2025
slug:raindrop-semiconductors-cpus
Most people think of machine instructions as the fundamental steps that a computer performs. However, many processors have another layer of ...
It is often said that companies – particularly large companies with enormous IT budgets – do not buy products, they buy roadmaps. No one wants to go to
After persistent rumors refused to recede, AMD steps in with a clear explanation why dual-CCD V-Cache doesn't exist.
In 1993, Intel released the high-performance Pentium processor, the start of the long-running Pentium line. The Pentium had many improvement...

The CCD stack with 3D V-Cache on the AMD Ryzen 7 9800X3D is only 40-45µm in total, but the rest of the layers add up to a whopping 750µm.
A loop buffer sits at a CPU's frontend, where it holds a small number of previously fetched instructions.
I was studying the silicon die of the Pentium processor and noticed some puzzling structures where signal lines were connected to the silico...

Intel was a dominant leader in the CPU market for the better part of a decade, but AMD has seen massive success in recent years thanks to its Ryzen chips.
Nitro, Graviton, EFA, Inferentia, Trainium, Nvidia Cloud, Microsoft Azure, Google Cloud, Oracle Cloud, Handicapping Infrastructure, AI As A Service, Enterprise Automation, Meta, Coreweave, TCO
When I recently interviewed Mike Clark, he told me, “…you’ll see the actual foundational lift play out in the future on Zen 6, even though it was really Zen 5 that set the table for that.” And at that same Zen 5 architecture event, AMD’s Chief Technology Officer Mark Papermaster said, “Zen 5 is a ground-up redesign of the Zen architecture,” which has brought numerous and impactful changes to the design of the core.

A Finnish startup called Flow Computing is making one of the wildest claims ever heard in silicon engineering: by adding its proprietary companion chip,

Anton Shilov reports via Tom's Hardware: About half of the processors packaged in Russia are defective. This has prompted Baikal Electronics, a Russian processor developer, to expand the number of packaging partners in the country, according to a report in Vedomosti, a Russian-language business dai...

Researchers also disclosed a separate bug called “Inception” for newer AMD CPUs.
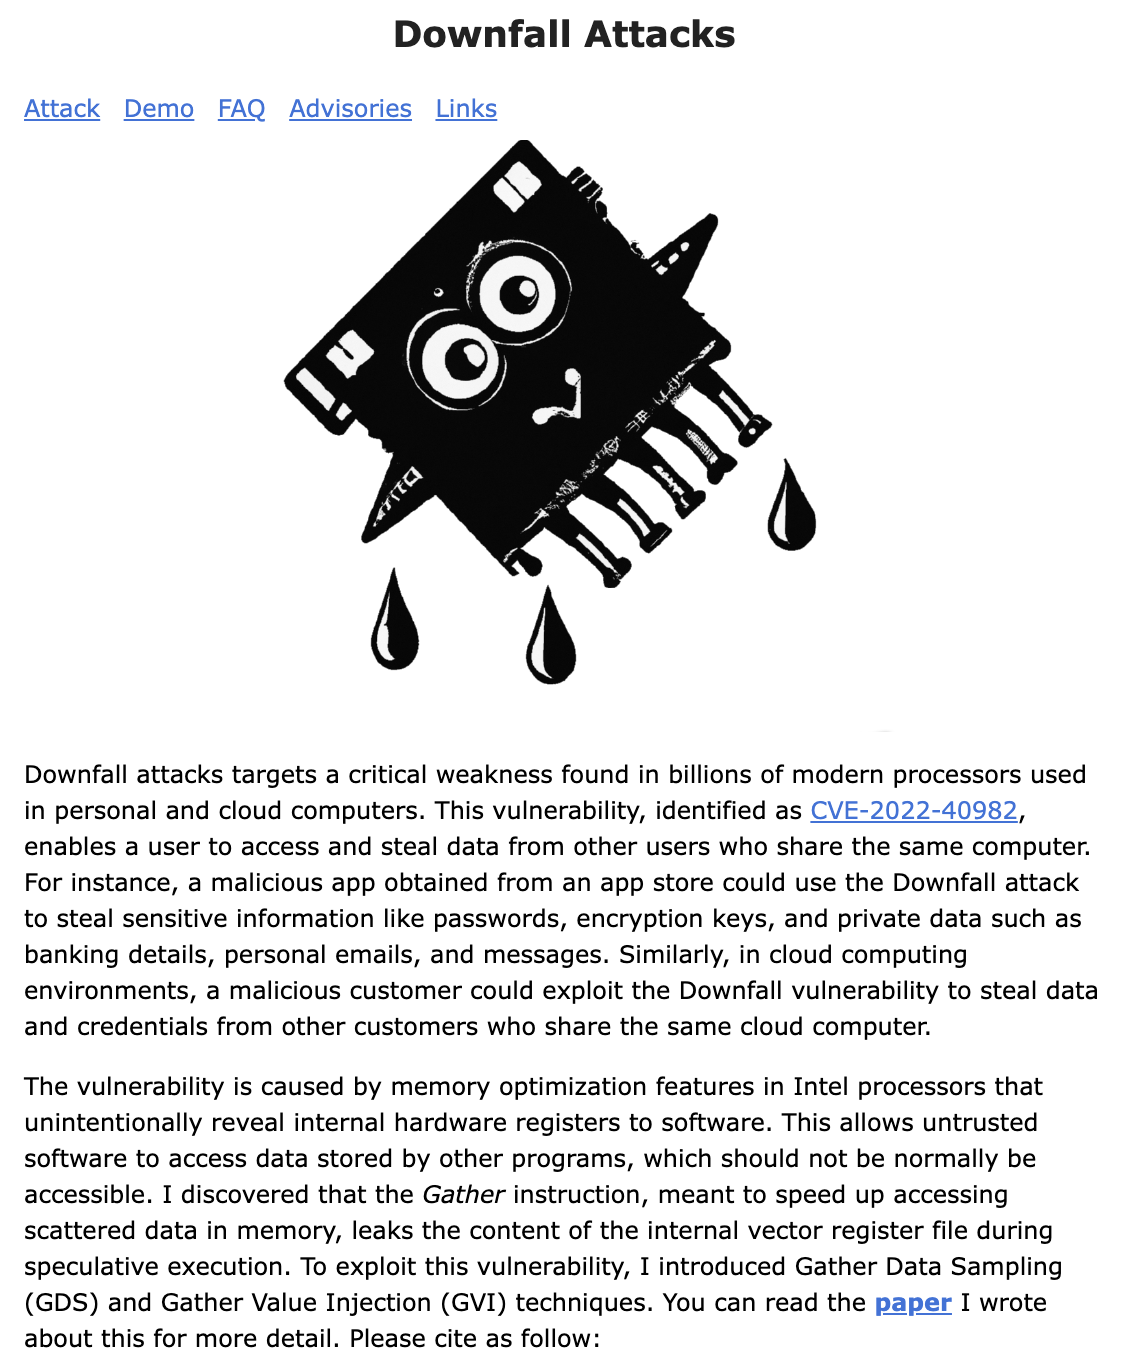
Downfall attacks targets a critical weakness found in billions of modern processors used in personal and cloud computers.


Micron $MU looks very weak in AI

The company’s PowerVia interconnect tech demonstrated a 6 percent performance gain

GPUs may dominate, but CPUs could be perfect for smaller AI models

Tech enthusiasts probably know ARM as a company that develops reasonably performant CPU architectures with a focus on power efficiency.

Over the past 10-15 years, per-core throughput increases have slowed, and in response CPU designers have scaled up core counts and socket counts to continue increasing performance across generations of new CPU models.
While microprocessors are used in various applications, they are precluded from the use in high-energy physics applications due to the harsh radiation present. To overcome this limitation a...
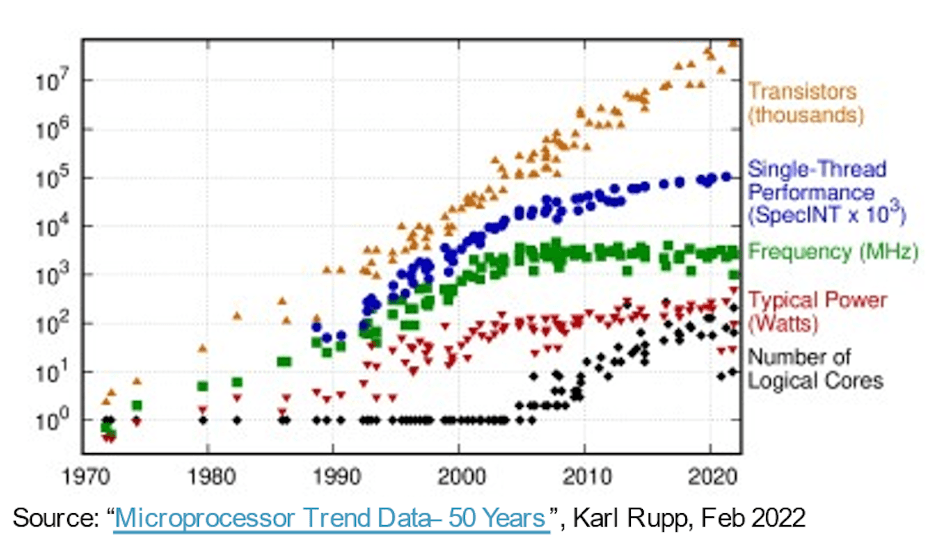
In the march to more capable, faster, smaller, and lower…
It was only a matter of time, perhaps, but the skyrocketing costs of designing chips is colliding with the ever-increasing need for performance,

Chinese chip designer Loongson, which has tried to reduce the country’s reliance on Intel and AMD, is developing its own general-purpose GPU despite being added to a US trade blacklist.

Just one instruction at a time!
If a few cores are good, then a lot of cores ought to be better. But when it comes to HPC this isn’t always the case, despite what the Top500 ranking –


Both companies are rolling out mitigations, but they add overhead of 12 to 28 percent.
Hertzbleed attack targets power-conservation feature found on virtually all modern CPUs.

In 2004 I was working for Microsoft in the Xbox group, and a new console was being created. I got a copy of the detailed descriptions of the Xbox 360 CPU and I read it through multiple times and su…

A detailed, critical, technical essay on upcoming CPU architectures.
Software optimization manuals for C++ and assembly code. Intel and AMD x86 microprocessors. Windows, Linux, BSD, Mac OS X. 16, 32 and 64 bit systems. Detailed descriptions of microarchitectures.


There are some features in any architecture that are essential, foundational, and non-negotiable. Right up to the moment that some clever architect shows

AMD recently unveiled 3D V-Cache, their first 3D-stacked technology-based product. Leapfrogging contemporary 3D bonding technologies, AMD jumped directly into advanced packaging with direct bonding and an order of magnitude higher wire density.

Although competition from Arm is increasing, AMD remains Intel’s biggest competitor, as concerns of losing market share weigh on Intel’s valuation.

A new CPU design has won accolades for defeating the hacking efforts of nearly 600 experts during a DARPA challenge. Its approach could help us close side-channel vulnerabilities in the future.

Apple is positioning its M1 quite differently from any CPU Intel or AMD has released. The long-term impact on the PC market could be significant.

Sapphire Rapids, Intel's next server architecture, looks like a large leap over the just-launched Ice Lake SP.

Technically legal, but strange.
The “Milan” Epyc 7003 processors, the third generation of AMD’s revitalized server CPUs, is now in the field, and we await the entry of the “Ice Lake”

AMD is one of the oldest designers of large scale microprocessors and has been the subject of polarizing debate among technology enthusiasts for nearly 50 years. Its...
With every passing year, as AMD first talked about its plans to re-enter the server processor arena and give Intel some real, much needed, and very direct


Understanding Intel® processor names and numbers helps identify the best laptop, desktop, or mobile device CPU for your computing needs.
In this article, I would like to shortly describe the methods used to dump and restore the different kinds of registers on 32-bit and 64-bit x86 CPUs. The first part will focus on General Purpose Registers, Debug Registers and Floating-Point Registers up to the XMM registers provided by the SSE extension. I will explain how their values can be obtained via the ptrace(2) interface.

They say "performance is king'... It was true a decade ago and it certainly is now. With more and mor...

When it comes to hashing, sometimes 64 bit is not enough, for example, because of birthday paradox — the hacker can iterate through random $latex 2^{32}$ entities and it can be proven that wi…
The x86 instruction set refers to the set of instructions that x86-compatible microprocessors support. The instructions are usually part of an executable program, often stored as a computer file and executed on the processor.
Fujitsu Limited today announced that it began shipping the supercomputer Fugaku, which is jointly developed with RIKEN and promoted by the Ministry of Education, Culture, Sports, Science and Technology with the aim of starting general operation between 2021 and 2022. The first machine to be shipped this time is one of the computer units of Fugaku, a supercomputer system comprised of over 150,000 high-performance CPUs connected together. Fujitsu will continue to deliver the units to RIKEN Center for Computational Science in Kobe, Japan, for installation and tuning.


Recent leaks may shed some light on Intel's upcoming mainstream desktop Comet Lake-S CPUs.

Intel's Tremont CPU microarchitecture will be the foundation of a next-generation, low-power processors that target a wide variety of products across

A post describing how C programs get to the main function. Devicetree layouts, linker scripts, minimal C runtimes, GDB and QEMU, basic RISC-V assembly, and other topics are reviewed along the way.
Excessive instruction cache misses are the kind of a performance problem that's going to appear only in larger codebases. In this article, I'm describing some ideas on how to deal with this issue.
Repository for the tools and non-commercial data used for the "Accelerator wall" paper. - PrincetonUniversity/accelerator-wall

Monday night Amazon announced the new 'A1' instance type for the Elastic Compute Cloud (EC2) that is powered by their own 'Graviton' ARMv8 processors.

It might have been difficult to see this happening a mere few years ago, but the National Nuclear Security Administration and one of its key
Intel's Core Ultra 200 "Arrow Lake" Desktop CPU specifications have now been finalized and we are just a month away from the official launch.
-->
semiconductors/gpus
categories:
tags: gpus semiconductors
date: 26 Mar 2025
slug:raindrop-semiconductors-gpus

The Future of AI Accelerators: A Roadmap of Industry Leaders The AI hardware race is heating up, with major players like NVIDIA, AMD, Intel, Google, Amazon, and more unveiling their upcoming AI accelerators. Here’s a quick breakdown of the latest trends: Key Takeaways: NVIDIA Dominance: NVIDIA continues to lead with a robust roadmap, extending from H100 to future Rubin and Rubin Ultra chips with HBM4 memory by 2026-2027. AMD’s Competitive Push: AMD’s MI300 series is already competing, with MI350 and future MI400 models on the horizon. Intel’s AI Ambitions: Gaudi accelerators are growing, with Falcon Shores on track for a major memory upgrade. Google & Amazon’s Custom Chips: Google’s TPU lineup expands rapidly, while Amazon’s Trainium & Inferentia gain traction. Microsoft & Meta’s AI Expansion: Both companies are pushing their AI chip strategies with Maia and MTIA projects, respectively. Broadcom & ByteDance Join the Race: New challengers are emerging, signaling increased competition in AI hardware. What This Means: With the growing demand for AI and LLMs, companies are racing to deliver high-performance AI accelerators with advanced HBM (High Bandwidth Memory) configurations. The next few years will be crucial in shaping the AI infrastructure landscape. $NVDA $AMD $INTC $GOOGL $AMZN $META $AVGO $ASML $BESI

Getting 'low level' with Nvidia and AMD GPUs

Intel's first Arc B580 GPUs based on the Xe2 "Battlemage" architecture have been leaked & they look quite compelling.


Datacenter GPUs and some consumer cards now exceed performance limits

Beijing will be thrilled by this nerfed silicon

GPT-4 Profitability, Cost, Inference Simulator, Parallelism Explained, Performance TCO Modeling In Large & Small Model Inference and Training
While a lot of people focus on the floating point and integer processing architectures of various kinds of compute engines, we are spending more and more

Lenovo, the firm emerging as a driving force behind AI computing, has expressed tremendous optimism about AMD's Instinct MI300X accelerator.

Chafing at their dependence, Amazon, Google, Meta and Microsoft are racing to cut into Nvidia’s dominant share of the market.

AMD, Nvidia, and Intel have all diverged their GPU architectures to separately optimize for compute and graphics.

Quarterly Ramp for Nvidia, Broadcom, Google, AMD, AMD Embedded (Xilinx), Amazon, Marvell, Microsoft, Alchip, Alibaba T-Head, ZTE Sanechips, Samsung, Micron, and SK Hynix

GDDR7 is getting closer, says Micron.

Though it'll arrive just in time for mid-cycle refresh from AMD, Nvidia, and Intel, it's unclear if there will be any takers just yet.
Micron $MU looks very weak in AI


The great thing about the Cambrian explosion in compute that has been forced by the end of Dennard scaling of clock frequencies and Moore’s Law lowering
GPUs may dominate, but CPUs could be perfect for smaller AI models

Google's new machines combine Nvidia H100 GPUs with Google’s high-speed interconnections for AI tasks like training very large language models.

Faster masks, less power.

The $10,000 Nvidia A100has become one of the most critical tools in the artificial intelligence industry,
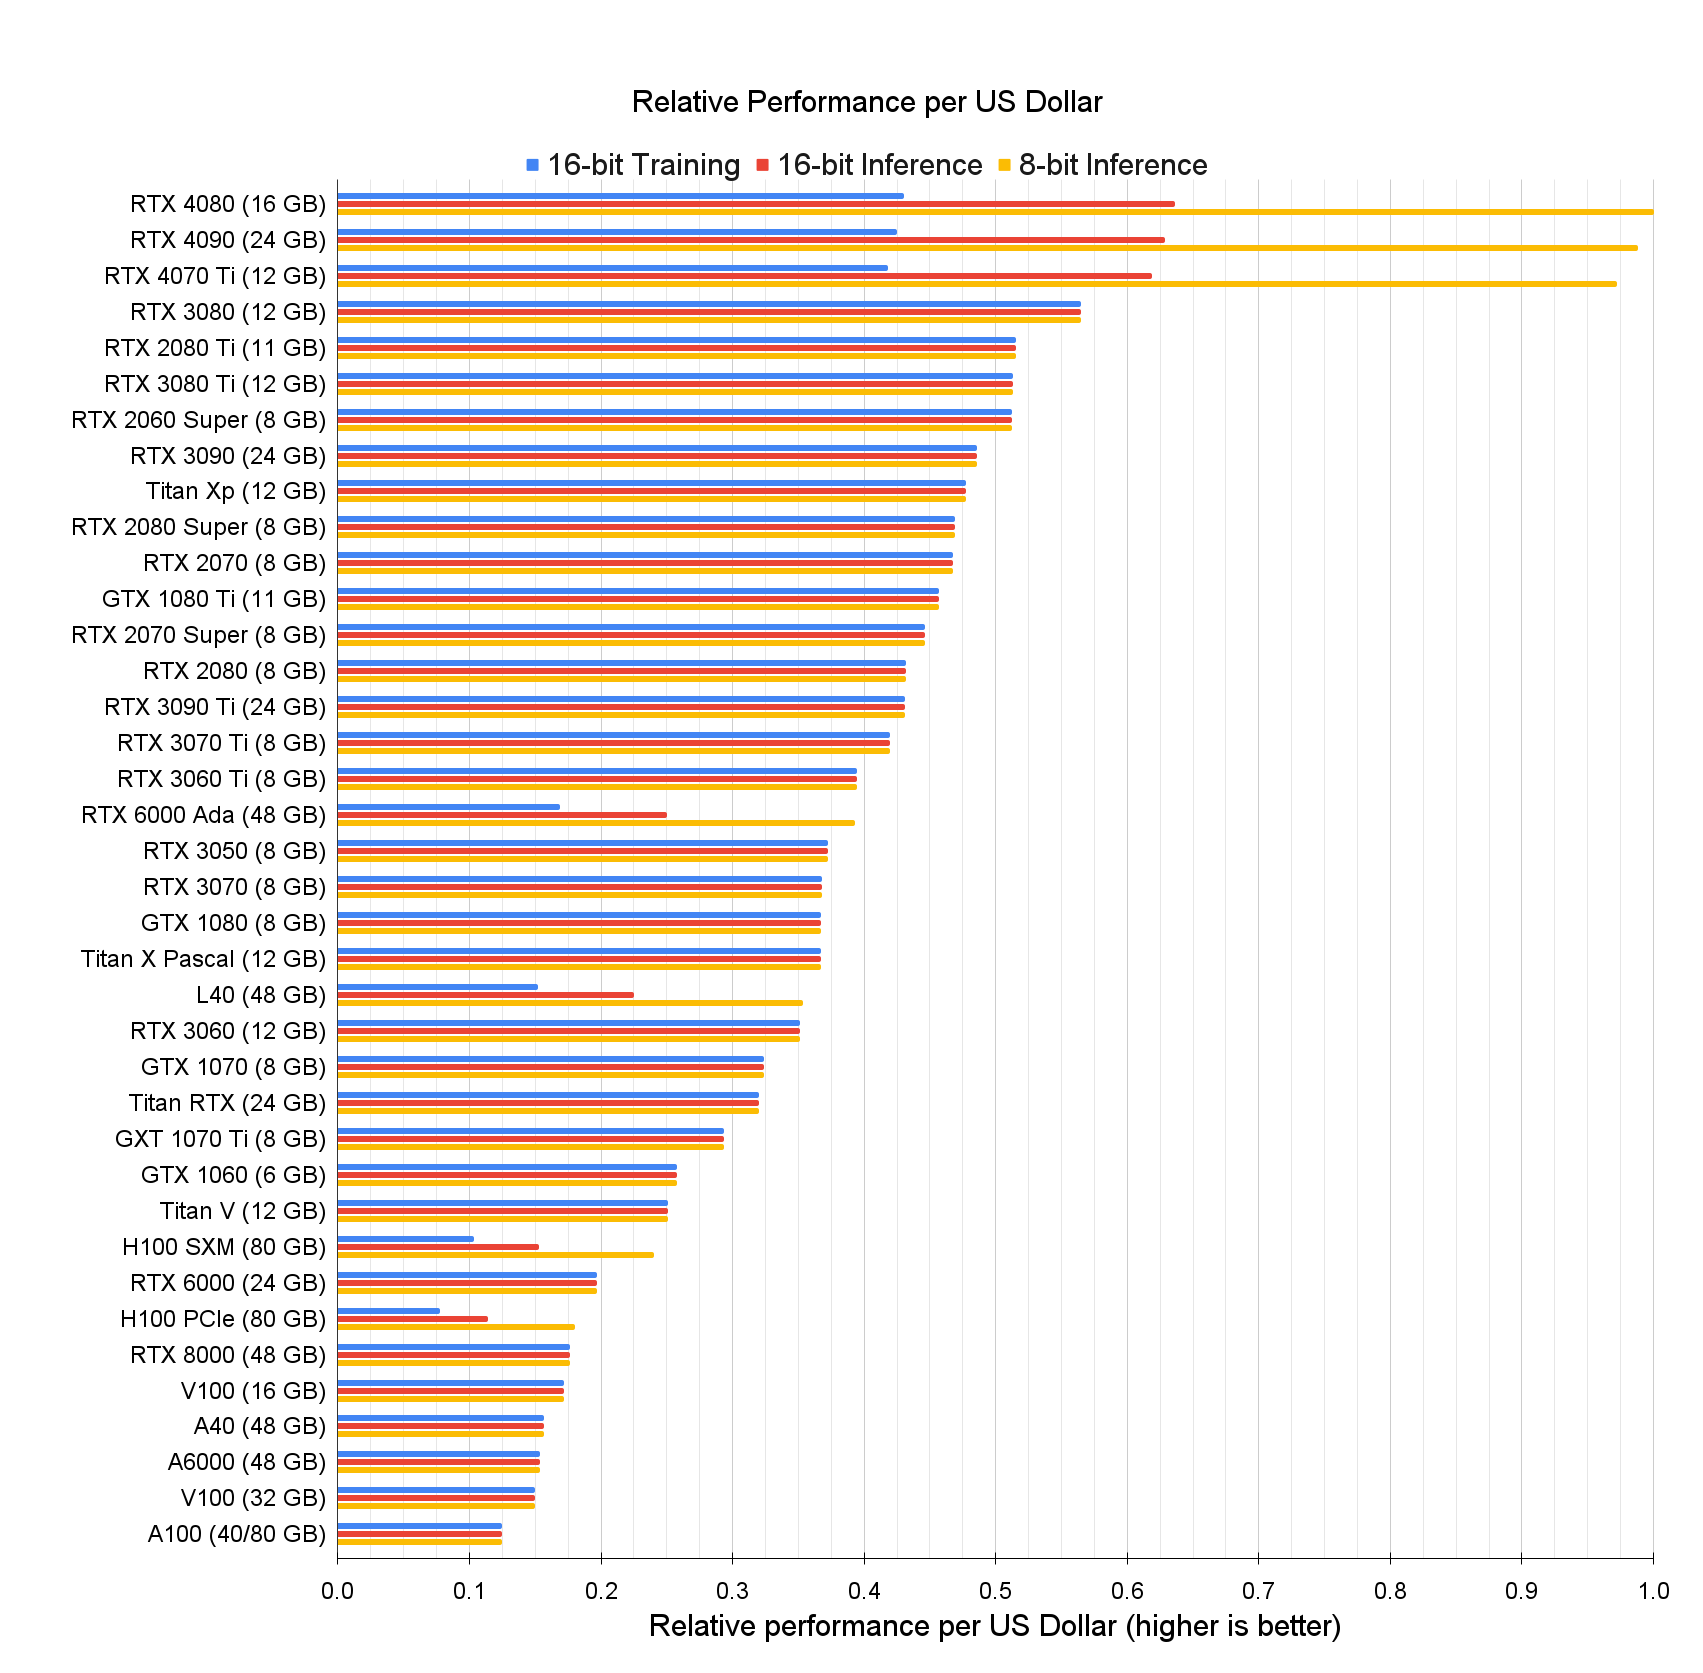
Here, I provide an in-depth analysis of GPUs for deep learning/machine learning and explain what is the best GPU for your use-case and budget.
There are two types of packaging that represent the future of computing, and both will have validity in certain domains: Wafer scale integration and

Nvidia has staked its growth in the datacenter on machine learning. Over the past few years, the company has rolled out features in its GPUs aimed neural


The modern GPU compute engine is a microcosm of the high performance computing datacenter at large. At every level of HPC – across systems in the

Like its U.S. counterpart, Google, Baidu has made significant investments to build robust, large-scale systems to support global advertising programs. As

Its second analog AI chip is optimized for different card sizes, but still aimed at computer vision workloads at the edge.

Current custom AI hardware devices are built around super-efficient, high performance matrix multiplication. This category of accelerators includes the

What makes a GPU a GPU, and when did we start calling it that? Turns out that’s a more complicated question than it sounds.
AMD is one of the oldest designers of large scale microprocessors and has been the subject of polarizing debate among technology enthusiasts for nearly 50 years. Its...

One of the main tenets of the hyperscalers and cloud builders is that they buy what they can and they only build what they must. And if they are building
AMD ROCm documentation

Long-time Slashdot reader UnknowingFool writes: AMD filed a patent on using chiplets for a GPU with hints on why it has waited this long to extend their CPU strategy to GPUs. The latency between chiplets poses more of a performance problem for GPUs, and AMD is attempting to solve the problem with a ...

Micron's GDDR6X is one of the star components in Nvidia's RTX 3070, 3080, and 3080 video cards. It's so fast it should boost gaming past the 4K barrier.
When you have 54.2 billion transistors to play with, you can pack a lot of different functionality into a computing device, and this is precisely what


In this tutorial, you will learn how to get started with your NVIDIA Jetson Nano, including installing Keras + TensorFlow, accessing the camera, and performing image classification and object detection.
363 votes, 25 comments. This post has been split into a two-part series to work around Reddit’s per-post character limit. Please find Part 2 in the…

Making Waves in Deep Learning How deep learning applications will map onto a chip.

A new crop of applications is driving the market along some unexpected routes, in some cases bypassing the processor as the landmark for performance and
-->
semiconductors/semiconductor-memory
categories:
tags: semiconductor-memory semiconductors
date: 26 Mar 2025
slug:raindrop-semiconductors-memory

It hasn’t achieved commercial success, but there is still plenty of development happening; analog IMC is getting a second chance.

While Intel's primary product focus is on the processors, or brains, that make computers work, system memory (that's DRAM) is a critical component for performance. This is especially true in servers, where the multiplication of processing cores has outpaced the rise in memory bandwidth (in other wor...

HBM4 is going to double the bandwidth of HBM3, but not through the usual increase in clock rate.

Demand for high-bandwidth memory is driving competition -- and prices -- higher

Rambus has unveiled its next-gen GDDR7 memory controller IP, featuring PAM3 Signaling, and up to 48 Gbps transfer speeds.

Micron’s NVDRAM chip could be a proving ground for technologies used in other products – and not become a standalone product itself. The 32Gb storage-class nonvolatile random-access memory chip design was revealed in a Micron paper at the December IEDM event, and is based on ferroelectricRAM technology with near-DRAM speed and longer-than-NAND endurance. Analysts we […]

We're getting a first glimpses of Samsung's next-generation HBM3E and GDDR7 memory chips.
Quarterly Ramp for Nvidia, Broadcom, Google, AMD, AMD Embedded (Xilinx), Amazon, Marvell, Microsoft, Alchip, Alibaba T-Head, ZTE Sanechips, Samsung, Micron, and SK Hynix
GDDR7 is getting closer, says Micron.
Though it'll arrive just in time for mid-cycle refresh from AMD, Nvidia, and Intel, it's unclear if there will be any takers just yet.
Micron $MU looks very weak in AI

Panmnesia has devised CXL-based vector search methods that are much faster than Microsoft’s Bing and Outlook.

We asked memory semiconductor industry analyst Jim Handy of Objective Analysis how he views 3D DRAM technology.

New memory technologies have emerged to push the boundaries of conventional computer storage.

A new technical paper titled “Fundamentally Understanding and Solving RowHammer” was published by researchers at ETH Zurich. Abstract “We provide an overview of recent developments and future directions in the RowHammer vulnerability that plagues modern DRAM (Dynamic Random Memory Access) chips, which are used in almost all computing systems as main memory. RowHammer is the... » read more

USC researchers have announced a breakthrough in memristive technology that could shrink edge computing for AI to smartphone-sized devices.


ReRAM startup Intrinsic Semiconductor Technologies has raised $9.73 million to expand its engineering team and bring its product to market.
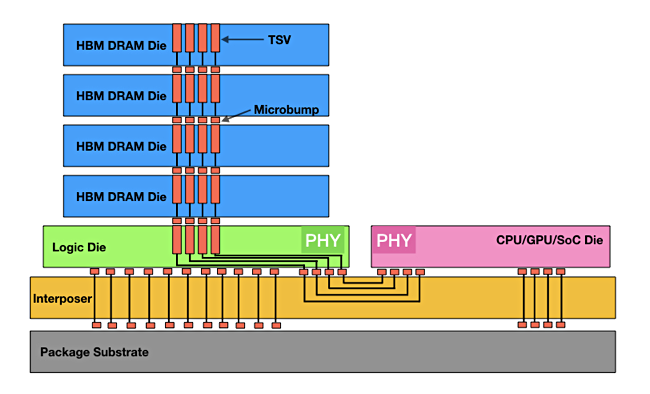
New applications require a deep understanding of the tradeoffs for different types of DRAM.

A technical paper titled “Beware of Discarding Used SRAMs: Information is Stored Permanently” was published by researchers at Auburn University. The paper won “Best Paper Award” at the IEEE International Conference on Physical Assurance and Inspection of Electronics (PAINE) Oct. 25-27 in Huntsville. Abstract: “Data recovery has long been a focus of the electronics industry... » read more

SK hynix boosts DDR5 DRAM speed
Conventional wisdom says that trying to attach system memory to the PCI-Express bus is a bad idea if you care at all about latency. The further the memory
Using new materials, UPenn researchers recently demonstrated how analog compute-in-memory circuits can provide a programmable solution for AI computing.
A new technical paper titled “HiRA: Hidden Row Activation for Reducing Refresh Latency of Off-the-Shelf DRAM Chips” was published by researchers at ETH Zürich, TOBB University of Economics and Technology and Galicia Supercomputing Center (CESGA). Abstract “DRAM is the building block of modern main memory systems. DRAM cells must be periodically refreshed to prevent data... » read more

Changes are steady in the memory hierarchy, but how and where that memory is accessed is having a big impact.

EE Times Compares SRAM vs. DRAM, Common Issues With Each Type Of Memory, And Takes A Look At The Future For Computer Memory.
Nvidia has staked its growth in the datacenter on machine learning. Over the past few years, the company has rolled out features in its GPUs aimed neural

PARIS — If you’ve ever seen the U.S. TV series “Person of Interest,” during which an anonymous face in the Manhattan crowd, highlighted inside a digital

Innovative new clocking schemes in the latest LPDDR standard enable easier implementation of controllers and PHYs at maximum data rate as well as new options for power consumption.

Getting data in and out of memory faster is adding some unexpected challenges.
PALO ALTO, Calif., August 19, 2019 — UPMEM announced today a Processing-in-Memory (PIM) acceleration solution that allows big data and AI applications to run 20 times faster and with 10 […]

Experts at the Table: Which type of DRAM is best for different applications, and why performance and power can vary so much.

Emerging memory technologies call for an integrated PVD process system capable of depositing and measuring multiple materials under vacuum.

This article will take a closer look at the commands used to control and interact with DRAM.

Over the last two years, there has been a push for novel architectures to feed the needs of machine learning and more specifically, deep neural networks.

A full fix for the “Half-Double” technique will require rethinking how memory semiconductors are designed.

Pushing AI to the edge requires new architectures, tools, and approaches.

SRAM cell architecture introduction: design and process challenges assessment.

How side-band, inline, on-die, and link error correcting schemes work and the applications to which they are best suited.
Looking at a typical SoC design today it's likely to…

With no definitive release date for DDR5, DDR4 is making significant strides.
Micron's GDDR6X is one of the star components in Nvidia's RTX 3070, 3080, and 3080 video cards. It's so fast it should boost gaming past the 4K barrier.


Good inferencing chips can move data very quickly

“Industry 4.0” is already here for some companies—especially silicon foundries.

How much power is spent storing and moving data.

Comparing different machine learning use-cases and the architectures being used to address them.

The previous post in this series (excerpted from the Objective Analysis and Coughlin Associates Emerging Memory report) explained why emerging memories are necessary. Oddly enough, this series will explain bit selectors before defining all of the emerging memory technologies themselves. The reason why is that the bit selector determines how small a bit cell can

Processing In Memory Growing volume of data and limited improvements in performance create new opportunities for approaches that never got off the ground.

Micron notes that GDDR6 has silicon changes, channel enhancements, and talks a bit about performance measurements of the new memory.

New computing architectures aim to extend artificial intelligence from the cloud to smartphones
-->
semiconductors/ideas
categories:
tags: ideas semiconductors
date: 28 Mar 2025
slug:raindrop-prodmgmt-ideas

The commerce technology stack is changing. And the ability to move information from one system or platform to another is, perhaps, the essential feature mid-sized or enterprise businesses should look for in software providers.
Business models based on the compiled list at http://news.ycombinator.com/item?id=4924647. I find the link very hard to browse, so I made a simple version in Markdown instead. · GitHub
The unbundling of Excel is just as important as the unbundling of Craigslist. Here's what you need to know about the Excel Economy and how SaaS companies can take advantage of different verticals and use cases that Excel has dominated.
Eliciting product feedback elegantly is a competitive advantage for LLM-software. Over the weekend, I queried Google’s Bard, & noticed the elegant feedback loop the product team has incorporated into their product. I asked Bard to compare the 3rd-row leg room of the leading 7-passenger SUVs. At the bottom of the post is a little G button, which double-checks the response using Google searches. I decided to click it. This is what I would be doing in any case ; spot-checking some of the results.
Methodologies for understanding and measuring marketplace liquidity

On asking people to consider stuff that sounds crazy

Tap into people's unspoken needs to create breakthrough innovations.
Building a two-sided market is probably the hardest thing you can build as an entrepreneur. It's so hard that a few weeks ago, I organized a Marketplace

Reselling software can mean recurring revenue and great profit margins. But how do you choose a niche and find your first customers?
Zapier has 3M+ users and generates $125M in ARR. At a $5B valuation, its fast-growing horizontal platform is unable to meet the demands of all of its customers. The increase of underserved Zapier customers presents an opportunity.
How data businesses start, and how they keep going, and growing, and growing.

Two inventors turned a failed experiment into an irresistibly poppable product that revolutionized the shipping industry
SAP’s acquisition of Qualtrics shows how the shift in technology has changed business; it is a perfect example of using the Internet to one’s advantage.

From blood banks and barcodes to the Super Soaker and the pizza box, here are the fascinating stories behind inventions that changed the world.
The marketplace revolution is still just beginning and the enterprise gateway is the newest type of marketplace.
Some careers can be made on the back of a single, wonderful idea. We take a look at what that looks like, through Bill Gurley's VC career.
An introduction to forming hypothesis statements for product experimentation.

Curious about product design at Dropbox? Here’s a look at tools we use for solving problems, making decisions, and communicating ideas.
The most common question prospective startup founders ask is how to get ideas for startups. The second most common question is if you have any ideas for their startup. But giving founders an idea...
@mmcgrana: Patio11’s Law: The software economy is bigger than you think, even when you take into account Patio11’s Law.1 A few years ago, I woke up in Sunriver, OR, and went to make coffee. The house had one of those bed-and-breakfast-type coffee trays. Drip machine. A stack
:extract_focal()/https%3A%2F%2Fhbr.org%2Fresources%2Fimages%2Farticle_assets%2F2017%2F08%2Faug17-16-97231137.jpg)
Working backwards and breaking free from the norm exposes new and unique opportunities you probably haven’t considered.
It's been said that ideas don't matter, and that only execution does. I wholeheartedly disagree. You need both to succeed, but you can only get so good...
Matt Meyers spent two decades at Weyerhaeuser dealing with product engineering, manufacturing, software engineering, product development, sales and
An MIT Sloan Ph.D. candidate discovered what turned skilled hobbyists into entrepreneurs.
Robert R. Taylor is a name you’ve probably never heard before. But this serial entrepreneur made his mark on the world of business by coming up with several products you are almost certainly very familiar with. Today we’re going to talk about, on the surface, the most boring of those- liquid hand soap. Something you can thank Mr. Taylor and [...]
Your phone increasingly knows what you’re taking a picture of. And which apps you have installed. So…
Editor’s note: This article by now-a16z general partner Alex Rampell was originally published in 2012 in TechCrunch. The biggest ecommerce opportunity today involves taking offline services and offering them for sale online (O2O commerce). The first generation of O2O commerce was driven by discounting, push-based engagements, and artificial scarcity. The still-unfulfilled opportunity in O2O today is tantamount to...
-->
goodreads/spycraft
categories:
tags: goodreads spycraft
date: 28 Mar 2025
slug:raindrop-goodreads-spycraft

Its agents are often depicted as malevolent puppet masters—or as bumbling idiots. The truth is even less comforting.

Runa Sandvik has made it her life’s work to protect journalists against cyberattacks. Authoritarian regimes are keeping her in business.
The story of Josephine Baker.
:extract_focal()/https%3A%2F%2Fimages.squarespace-cdn.com%2Fcontent%2Fv1%2F5a238ba10abd049ac5f4f02c%2F1562609080736-VJ24UWYVGIMB203FRB6H%2Fke17ZwdGBToddI8pDm48kKWs5pAFqf98lIJBUpRUHpJZw-zPPgdn4jUwVcJE1ZvWQUxwkmyExglNqGp0IvTJZUJFbgE-7XRK3dMEBRBhUpxXFOU2jzW_BkrZR5rldBQ2z9SyUjTZrDfH3T4hBSd7Voqcb14qFm1pPOE36oWTGbU%2FHavana.jpg)
This is the previously classified story of a Hail Mary plan, a Dirty Dozen crew of lowlifes, and a woman who wouldn’t bow to authority as she fought to bring three captured CIA agents home from Cuba.

Thousands of soldiers, civilians and contractors operate under false names, on the ground and in cyberspace. A Newsweek investigation of the ever-growing and unregulated world of "signature reduction."
The mission, still a secret to this day, was so dangerous many men bid emotional goodbyes...
The plan to kill Osama bin Laden—from the spycraft to the assault to its bizarre political backdrop—as told by the people in the room.

Cameron Ortis was an RCMP officer privy to the inner workings of Canada's national security—and in a prime position to exploit them

Noor Khan, a pacifist descendant of Indian Royalty became a famed World War II spy for Britain’s Special Operations Executive.
America’s bold response to the Soviet Union depended on an unknown spy agency operative whose story can at last be told

How a team of spies in Mexico got their hands on Russia's space secrets—and tried to change the course of the Cold War.

He wanted to learn about the Miami drug world and had been told I could help.

Bellingcat and its partners reported that Russia’s Federal Security Service (FSB) was implicated in the near-fatal nerve-agent poisoning of Alexey Navalny on 20 August 2020. The report identified eight clandestine operatives with medical and chemical/biological warfare expertise working under the guise of the FSB’s Criminalistics Institute who had tailed Alexey Navalny on more than 30 […]
:extract_focal()/https%3A%2F%2Fs3.amazonaws.com%2Fpocket-syndicated-images%2Farticles%2F1959%2F1571335915_756YAUN5YKGOT3XTOYYRIFIIVM.jpg)
This is the story of a little-known FBI forensics lab and how it changed the war on terror.

The untold story of how digital detectives unraveled the mystery of Olympic Destroyer—and why the next big cyberattack will be even harder to crack.

Find out more about the shows on Sky HISTORY's TV channel, with plenty to read and watch on your favourite historical topics.

Thirty-two-year-old French economist Gabriel Zucman scours spreadsheets to find secret offshore accounts.
The International Spy Museum details the audacious plan that involved a reclusive billionaire, a 618-foot-long ship, and a great deal of stealth

Last week, as America’s top national security experts convened in Aspen, a strangely inquisitive Uber driver showed up, too.


The home phone of FBI special agent Michael Rochford rang in the middle of the night on August 2, 1985. He grabbed it and heard the voice of his FBI supervisor. “There’s a plane coming in, a high-level defector.” The day before, a Soviet man had walked into the US consulate in Rome. He had
-->
goodreads/mysteries
categories:
tags: goodreads mysteries
date: 28 Mar 2025
slug:raindrop-goodreads-mysteries

Once a subject of Victorian fascination, the mokele-mbembe myth is now fodder for creationists on a quest to disprove Darwinism

Nigel Pickford has spent a lifetime searching for sunken treasure—without leaving dry land.
:extract_focal()/https%3A%2F%2Fpocket-syndicated-images.s3.amazonaws.com%2Farticles%2F9987%2F1715046105_coverobsession.png)
A multicultural, interfaith family in 1970s San Francisco reported a series of unexplained phenomena. Then a priest with a dark past stepped up.

Some say the true death worm has already been found—slithering beneath the sands of the Gobi.

The two disappearances of Tom Phillips and his children.
A classic ghost story has something to say about America—200 years ago, 100 years ago, and today.
A writer of haunting, uncategorizable songs, she once seemed poised for runaway fame. But only decades after she disappeared has her music found an audience.
Local sleuths help find a suspect in gay porn actor Bill Newton's murder. His dismembered head and feet were found in a Hollywood dumpster in 1990.

Tales of odd phenomena stoke our imagination even as they tease us.

Five years ago, the flight vanished into the Indian Ocean. Officials on land know more about why than they dare to say.
In 1708, the Spanish galleon San José sank in a deadly battle against English warships, taking with it billions in treasure. Centuries passed until a secretive archaeologist found the wreck, but now nations are again warring over who may claim the gold and glory.
In the mid-sixties, Candace Mossler was one of the most widely known socialites in Houston. She was in her forties, vivacious and full of charm, with wavy blond hair, deep-blue eyes, and a surgically enhanced figure that was often remarked upon in the many newspaper columns written about her.

The North Texas teenager went missing in the late eighties. For years, no one knew where she was, or even if she was still alive-no one, that is, except a mysterious young woman two thousand miles away.

For eight years, a man without a memory lived among strangers at a hospital in Mississippi. But was recovering his identity the happy ending he was looking for?

What can hyperpolyglots teach the rest of us?
It was the most shocking crime of its day, 27 boys from the same part of town kidnapped, tortured, and killed by an affable neighbor named Dean Corll. Forty years later, it remains one of the least understood—or talked about—chapters in Houston's history.
The young woman who mysteriously drowned in the Ropers Motel pool in 1966 might have remained anonymous forever, if not for cutting-edge genetics, old-fashioned genealogy—and the kindness of a small West Texas town.

This week the police disinterred a body, found on a beach in 1948, that has puzzled investigators for decades. “There’s lots of twists and turns in this case, and every turn is pretty weird,” one said.
The mission, still a secret to this day, was so dangerous many men bid emotional goodbyes...

The long read: In 2019, the body of a man fell from a passenger plane into a garden in south London. Who was he?

The Russian ship called the Ivan Vassili began its life in St. Petersburg in 1897, where it was built as a civilian steam

We know how to stop solid minerals converting to a liquid state mid voyage – so why does it still happen?

Breaking news: a credible solution to the Bouvet Island lifeboat mystery has been found. See comments for 22-27 May 2011, 12 November 2011, 17-20 March & 9 April 2016, and 28 December 2023. The…
-->
behaviors/motivation
categories:
tags: behaviors motivation
date: 28 Mar 2025
slug:raindrop-behaviors-motivation

OR: The secret geniuses of Wisconsin
OR: The demise of the Optimize Guys

Some apps or websites are beautiful, stylish, and well thought out in terms of UX, but have one problem: they are boring. These products can trigger both desire and resistance in the user at the same time. Here are a few tricks that will help solve this problem not from a rational, but from an

If you want to get anything done, there are two basic ways to get yourself to do it. The first, more popular and devastatingly wrong option is to try to motivate yourself. The second, somewhat unpo…

This is a book summary of Spark by Dr. Jeremy Dean. Read this Spark summary to review key takeaways and lessons from the book.
Reprint: R1405G Even in an age of relentless self-promotion, some extremely capable professionals prefer to avoid the spotlight. “Invisibles” work in fields ranging from engineering to interpreting to perfumery, but they have three things in common: They are ambivalent about recognition, seeing any time spent courting fame as time taken away from the work at hand. They are meticulous. And they savor responsibility, viewing even high pressure as an honor and a source of fascination. Something else unites Invisibles: They represent a management challenge. The usual carrots don’t motivate them; however, managers can take several steps to ensure their satisfaction. Leaders should recognize who their Invisibles are; decide if they want more Invisibles on the team; reward them fairly, soliciting reports on their accomplishments; make the work more intrinisically interesting; and talk to the Invisibles about what works best for them. These actions are well worth taking, as Invisibles not only bring exceptional levels of achievement to an organization but quietly improve the work of those around them, elevating performance and tone across the board.
Here are the 16 human needs as defined by professor Steven Reiss.

[PDF of this article updated Aug. 23, 2011] • [skip to preface] …
These are psychological theories about motivation.
When we want people to change, we typically tell them what to do. But what if we flipped the script and asked them for their wisdom instead? Behavioral scientist Katy Milkman PhD explains the power…
It’s important to understand that when you, as a leader, communicate with your team, using weaker words weakens your message and blunts your ability to inspire people. It’s not enough to just throw thoughts out there and hope for the best. You need to actively recommend ideas and assert their worthiness in all of your communications. For example, consider these “power words”: “I’m proposing (not “sharing”) an idea that will make our process more efficient.” “I’m suggesting (not “sharing”) a new logo that better conveys our brand message.” “I’m recommending (not “sharing”) a campaign to make our workplace more diverse.” Ultimately, audiences respond more actively to big points than to small words, but thoughtful leaders need to assess both, knowing that the more powerfully they come across — even in small ways — the greater impact they have on the people they hope to inspire.
:extract_focal()/https%3A%2F%2Fwww.nirandfar.com%2Fwp-content%2Fuploads%2F2019%2F11%2Fvintage_females_toxic_work_culture.jpg)
Feeling safe is the magic ingredient to a healthy work environment. In this article Nir discusses novel research on how to eliminate toxic work culture.
:extract_focal()/https%3A%2F%2Fwww.nirandfar.com%2Fwp-content%2Fuploads%2F2020%2F05%2Fextrinsic-motivation-terrible-life-choices.png)
The goal is to use extrinsic and intrinsic motivation in concert.

A study on team loyalty among fans shows that club ranking plays an important role in how they identify with one another.
Don’t try to change someone else’s mind. Instead, help them find their own motivation to change.

B J Fogg is a Stanford professor who came up with a simple model of behavior that helps us understand why we take action or not take action at any given moment.

It’s more than just ticket sales. Rich Luker, a social psychologist, studies fandom and why, for example, someone might get a tattoo of their favorite team.

Self-motivation isn’t some mysterious force that you’re born with or without. It’s a skill that can be learned and developed. By understanding the science behind it, you can master the tools you need to stay motivated and make progress on the projects that matter to you.
What Apple, Samsung, and Starbucks learned from Pepsi
-->
behaviors/habits
categories:
tags: behaviors habits
date: 28 Mar 2025
slug:raindrop-behaviors-habits
Learn how to create customer habits using powerful triggers like time, mood, location, and social influences. Discover techniques to boost product usage.

Companies utilize the Habit Zone to create user habits and influence user behavior. By creating habits, products become a part of users’ lives and minds.

Some managers keep diaries of their on-the-job mistakes, partly to avoid repeating errors, and partly to make employees comfortable with failure. At least one added cartoons.

In This Made To Stick summary you will learn exactly how to make your ideas persuade people and "stick" into their minds.
Learn the secret behind how we can use tiny habits and habit stacking to build new habits that actually stick and are more than the sum of their parts.
One thing leads to another and before you know it, you've got a routine.

Larry Page, CEO of Alphabet (the company formerly known as Google), has a quirky way of deciding which companies he likes. It’s called “The Toothbrush Test.” According to the New York Times, when Page looks at a potential company to acquire

Face it; you’re hooked. It’s your uncontrollable urge to check for email notifications on your phone. It’s your compulsion to visit Facebook or Twitter for just a few minutes, but somehow find yourself still scrolling after an hour. It’s the fact that if I recommended a book to purchase, your mind would flash “Amazon” like a gaudy neon sign. If habits are defined as repeated and automatic behaviors, then technology has wired your brain so you behave exactly the way it wants you to. In an online world of ever-increasing distractions, habits matter. In fact, the economic value of web businesses increasingly depends on the strength of the habitual behavior of their users. These habits ultimately will be a deciding factor in what separates startup winners and losers.
Your product can’t suck. That’s a given. But it’s also not enough to be a good product that doesn’t hook your customer and connect to their pain points.

This week I chat with Ryan Holiday, an author and hacker, about habits, obstacles, and media manipulation.
You want the good things technology brings. You also want to know how to stop checking your phone so much. Here's what a behavior expert says is the answer.
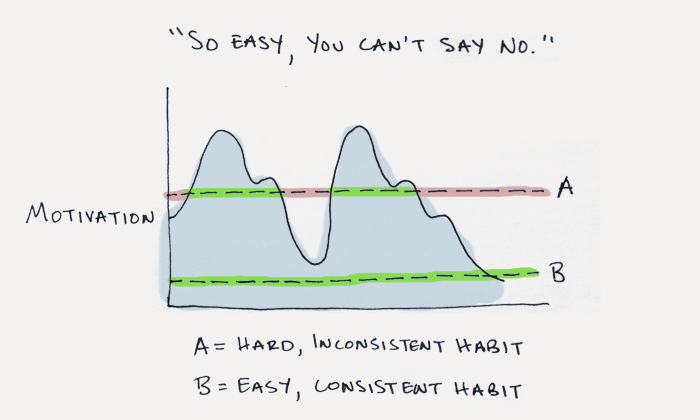
Understanding how to build new habits is essential for making progress. Read this guide right now to learn 5 easy, powerful strategies for changing habits.
We all want to be better than we are today. And that often requires pushing yourself beyond your comfort zone, even when you don’t feel like it. It requires getting back up and trying again and again when you fail. It requires sticking with a path long enough to see it through. In short, becoming […]
:extract_focal()/https%3A%2F%2Fs3.amazonaws.com%2Fpocket-syndicated-images%2Farticles%2F3267%2F1581359084_3067481049_b096e6d63f_c.jpg)
What really motivates you more, the promise of a reward if you succeed or a debt if you don’t?

Each and every day we eat, we sleep, we read, we brush our teeth. So why haven't we all become world-class masters of eating, sleeping, reading, and teeth-brushing?
-->
behaviors/grit-hustle-perseverence
categories:
tags: behaviors grit-hustle-perseverence
date: 28 Mar 2025
slug:raindrop-behaviors-grit-hustle-perseverence
On his way to be sworn in as the most powerful man in the world, Franklin Delano Roosevelt had to…

Imagine two friends, Steve and Fred, chatting at a New Year’s party. Both of them resolve to abstain from alcohol for January, and attend the gym regularly. They shake on it. They don’t want to let each other down, and they both fulfill their commitments. Afterward, Steve keeps up his routine, and Fred soon drifts back to too much beer

If you want to get anything done, there are two basic ways to get yourself to do it. The first, more popular and devastatingly wrong option is to try to motivate yourself. The second, somewhat unpo…

Navy SEAL platoon leader James Waters explains what keeps elite operators going and how you can apply this type of grit to your own challenges.
There's an increasing amount of talk around failure and the fear of it, but it's largely missing the point. Here's why
Don't set goals. Passion is bullshit. Mediocre skills are valuable. These are just a few of the unexpected truths you'll discover in Scott Adams' new book. Here are 10 more takeaways.

Sliced bread: the greatest thing since...sliced bread.

“The absolute certainty that nobody was going to care about, read or buy Kitchen Confidential was what allowed me to write it. I didn’t have to think about what people expected. I didn’t car…

Many entrepreneurs are naturally optimistic and discouraging pessimistic thinking, but the clever use of constructive pessimism is key to success


Born nearly two thousand years before Darwin and Freud, Epictetus seems to have anticipated a way out of their prisons.

I landed on a documentary about a guy who had a headache for years and never had a check-up. They found out later he had a brain tumor.
Ditch the tough talk, it won’t help. Instead cultivate your mental flexibility so you can handle whatever comes your way
We all want to be better than we are today. And that often requires pushing yourself beyond your comfort zone, even when you don’t feel like it. It requires getting back up and trying again and again when you fail. It requires sticking with a path long enough to see it through. In short, becoming […]
The military's toughest training challenges have a lot in common with outdoor sufferfests like the Barkley Marathons and the Leadville Trail 100: you have to be fit and motivated to make the starting line, but your mind and spirit are what carry you to the end. A Ranger graduate breaks down an ordeal that shapes some of the nation's finest soldiers.

“Anyone who lives within their means suffers from a lack of imagination.” — Oscar Wilde
-->
behaviors/confidence
categories:
tags: behaviors confidence
date: 28 Mar 2025
slug:raindrop-behaviors-confidence
:extract_focal()/https%3A%2F%2Fpocket-syndicated-images.s3.amazonaws.com%2Farticles%2F8019%2F1657155687_GettyImages-1218490865.jpg)
Narcissism and self-esteem have very different developmental pathways and outcomes.
New research suggests that body postures can reveal our emotions to other people—and maybe even change how we feel inside.
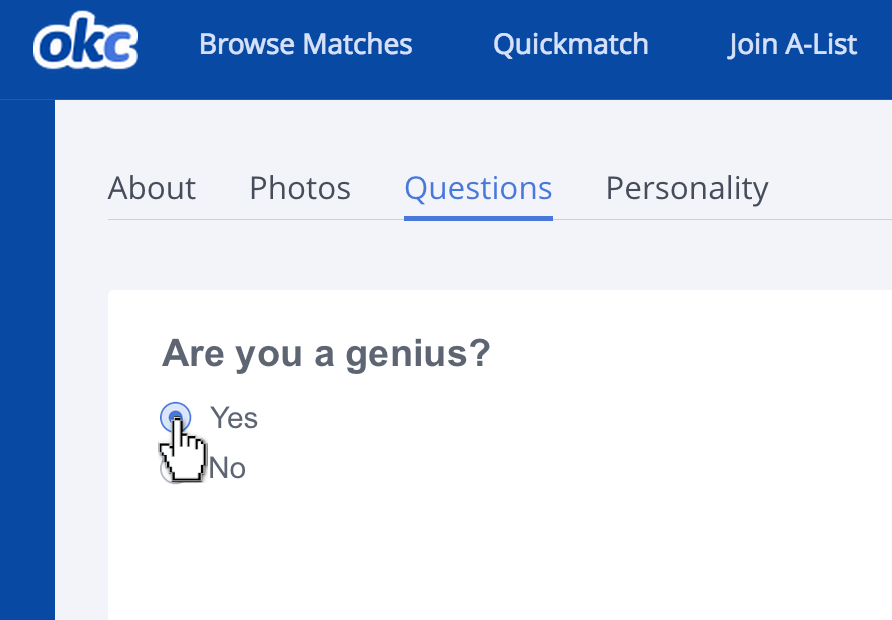
How ignorance and a little ego threat can make us ridiculously over-confident.

Never underestimate the power your own insecurities can generate.

Whether you want to find joy in your body, or just greater self-acceptance, these four strategies from psychologists and activists — and, yes, nudists — might help.
:extract_focal()/https%3A%2F%2Fpocket-syndicated-images.s3.amazonaws.com%2Farticles%2F7528%2F1644983014_ScreenShot2022-02-15at7.43.26PM.png)
Can ‘confidence-whisperer’ Nate Zinsser help Jamie Waters boost his wavering self-belief?

Can ‘confidence-whisperer’ Nate Zinsser help Jamie Waters boost his wavering self-belief?
You can’t stop people making demands on your time and energy, but you can develop assertiveness skills to protect yourself
When we want people to change, we typically tell them what to do. But what if we flipped the script and asked them for their wisdom instead? Behavioral scientist Katy Milkman PhD explains the power…

Five tactics to silence the person trying to make you squirm.

The long read: The troubled times we live in, and the rise of social media, have created an age of endless conflict. Rather than fearing or avoiding disagreement, we need to learn to do it well
Bridge the divide with thoughtful conversation techniques, next-level listening, and a dip into the science of changing minds.
"Unconscious leadership happens when we aren't self-aware, which puts fear in the driver's seat."
:extract_focal()/https%3A%2F%2Fhbr.org%2Fresources%2Fimages%2Farticle_assets%2F2018%2F05%2Fmay18_8_737142441.jpg)
We often undervalue what we inherently do well.

The trouble with ignorance is that it feels so much like expertise. A leading researcher on the psychology of human wrongness sets us straight.

We publish articles around emotional education: calm, fulfilment, perspective and self-awareness. | What to Do at Parties If You Hate Small Talk — Read now
-->
machine-learning/python
categories:
tags: machine-learning python
date: 28 Mar 2025
slug:raindrop-machine-learning-python

In this article, I will introduce you to 10 little-known Python libraries every data scientist should know.

In this article, I'll take you through a list of 50+ Data Analysis Projects you should try to learn Data Analysis.

In this article, I'll take you through a list of 80+ hands-on Data Science projects you should try to learn everything in Data Science.

In this article, I'll take you through a list of 50+ AI & ML projects solved & explained with Python that you should try.
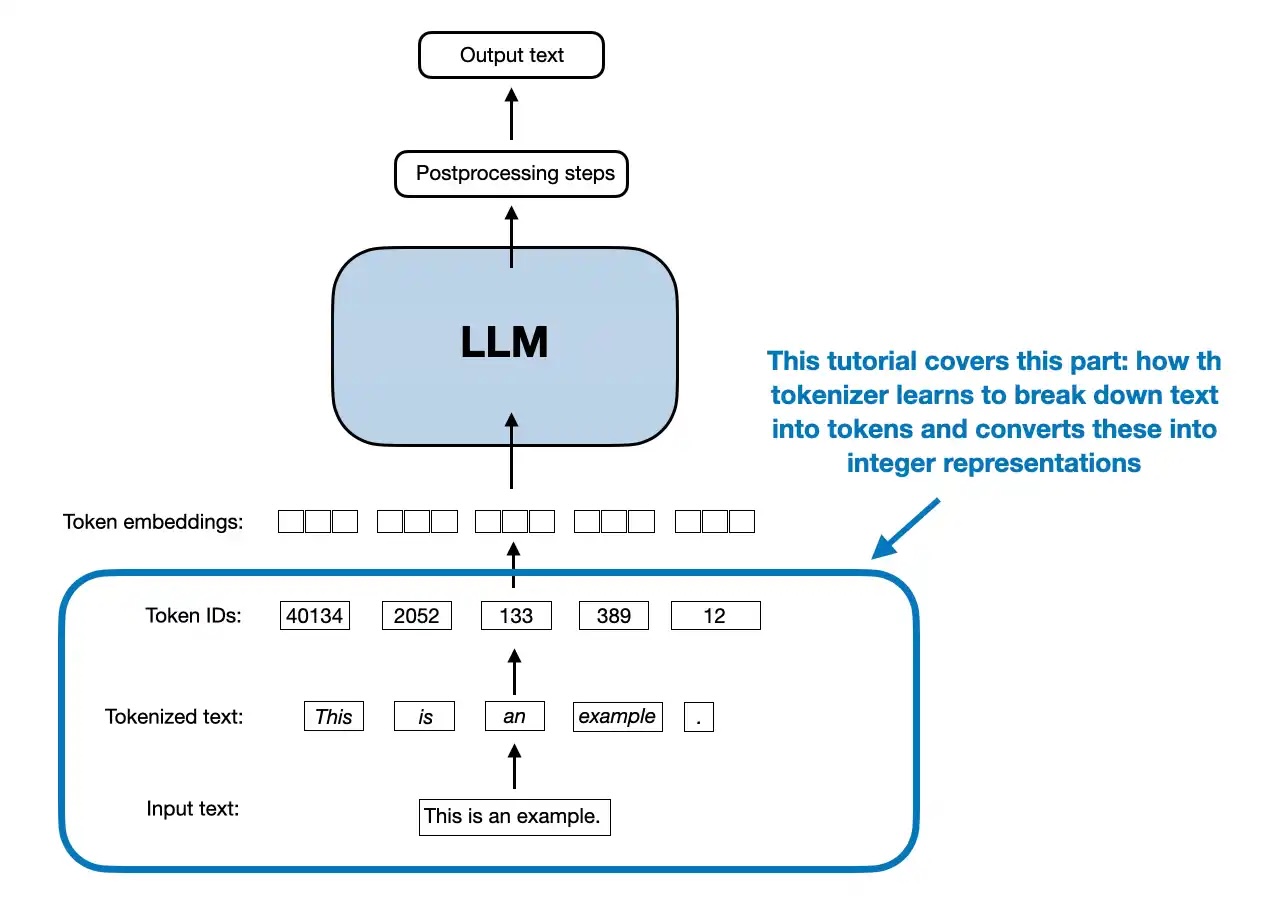
This is a standalone notebook implementing the popular byte pair encoding (BPE) tokenization algorithm, which is used in models like GPT-2 to GPT-4, Llama 3,...

Popular MLOps Python tools that will make machine learning model deployment a piece of cake.

Learn which variables you should and should not take into account in your model.

Insanely fast and reliable smoothing and interpolation with the Whittaker-Eilers method.

In this article, I'll take you through the task of Market Basket Analysis using Python. Market Basket Analysis using Python.
Understand survival analysis, its use in the industry, and how to apply it in Python
Applying causal machine learning to trim the campaign target audience

Master Sklearn pipelines for effortless and efficient machine learning. Discover the art of building, optimizing, and scaling models with ease. Level up your data preprocessing skills and supercharge your ML workflow today
Create insights from frequent patterns using market basket analysis with Python
Exploring the Latest Enhancements and Features of PyCaret 3.0
A quick guide on how to make clean-looking, interactive Python plots to validate your data and model
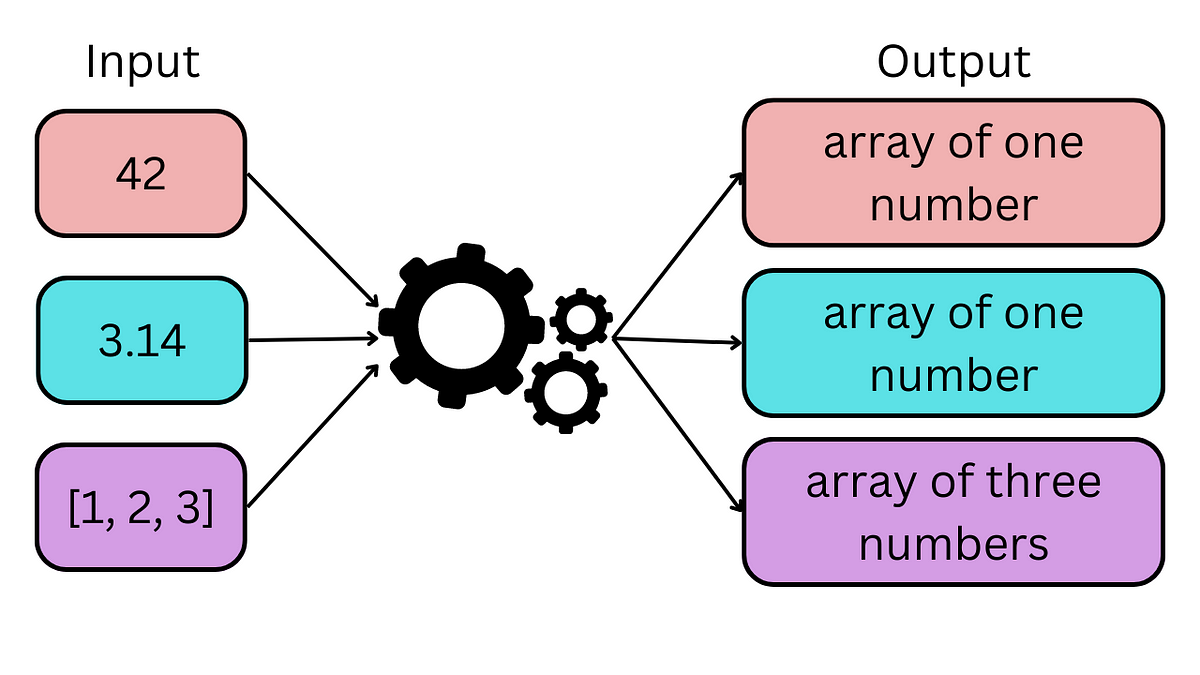
Use natural language to test the behavior of your ML models

Discover how to effectively detect multivariate outliers in machine learning with PyOD in Python. Learn to convert anomaly scores to probability confidence, choose the best outlier classifier and determine the right probability threshold for improved model accuracy.
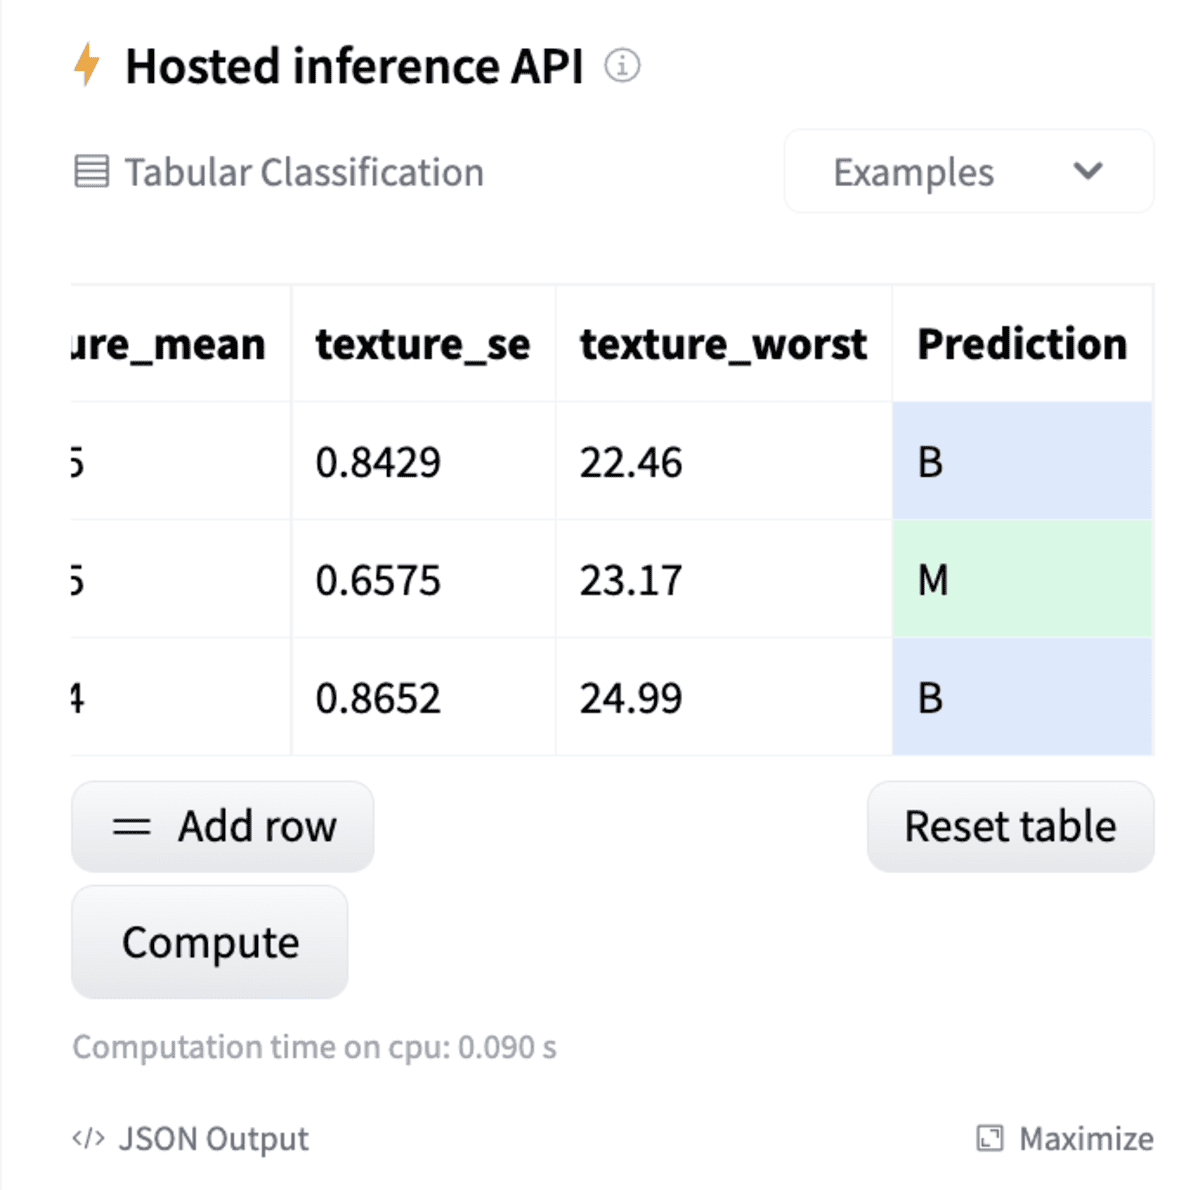
There are various challenges in MLOps and model sharing, including, security and reproducibility. To tackle these for scikit-learn models, we've developed a new open-source library: skops. In this article, I will walk you through how it works and how to use it with an end-to-end example.

Become familiar with some of the most popular Python libraries available for hyperparameter optimization.
Circular data can present unique challenges when it comes to analysis and modeling
Tips for taking full advantage of this machine learning package

A cross-framework package for kernels and Gaussian processes on manifolds, graphs, and meshes
Python Feature Engineering Cookbook Second Edition, published by Packt - PacktPublishing/Python-Feature-Engineering-Cookbook-Second-Edition
Mathematical Modeling, Solution, and Visualization Using PuLP and VeRoViz
How to compress and fit a humongous set of vectors in memory for similarity search with asymmetric distance computation (ADC)
Learn how to build MMMs for different countries the right way

Creating eye-catching graphs with Python to use instead of bar charts.
Graph partitioning has been a long-lasting problem and has a wide range of applications. This post shares the methodology for graph…

Reduce time in your data science workflow with these libraries.

Capturing non-linear advertising saturation and diminishing returns without explicitly transforming media variables
How to forecast with scikit-learn and XGBoost models with sktime

Brain-inspired unsupervised machine learning through competition, cooperation and adaptation

Use linear programming to minimize the difference between required and scheduled resources

The BAIR Blog

Using the Folium Package to Create Stunning Choropleths

How to use Python libraries like Open3D, PyVista, and Vedo for neighborhood analysis of point clouds and meshes through KD-Trees/Octrees

I show toy implementations of Python decorator patterns that may be useful for Data Scientists.
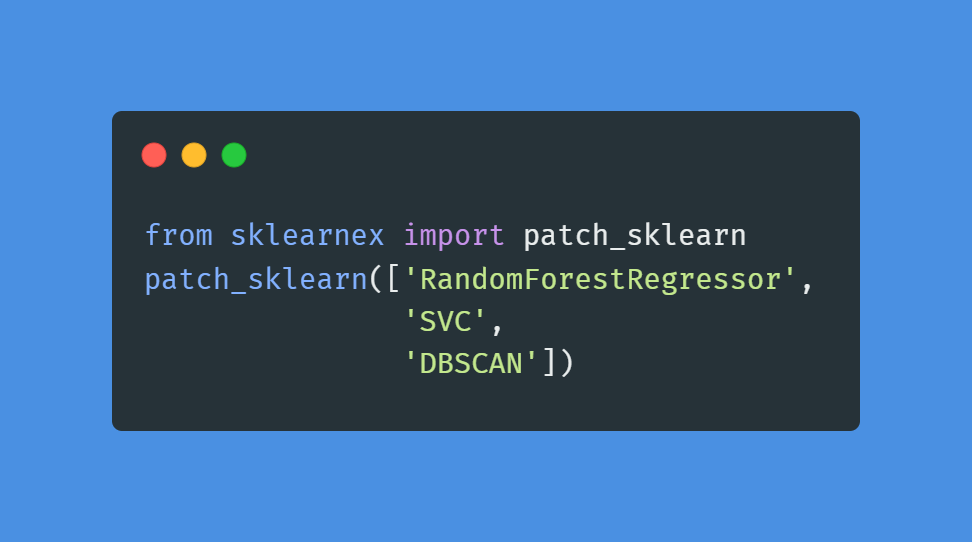
The introduction of the intel sklearn extension. Make your Random Forest even faster than XGBoost.

Apply Louvain’s Algorithm in Python for Community Detection

As a data analyst at Microsoft, I must investigate and understand time-series data every day. Besides looking at some key performance…

Topic modeling can bring NLP to the next level. Here’s how.

Because Graph Analytics is the future
based on "Hands-On Machine Learning with Scikit-Learn & TensorFlow" (O'Reilly, Aurelien Geron) - bjpcjp/scikit-and-tensorflow-workbooks
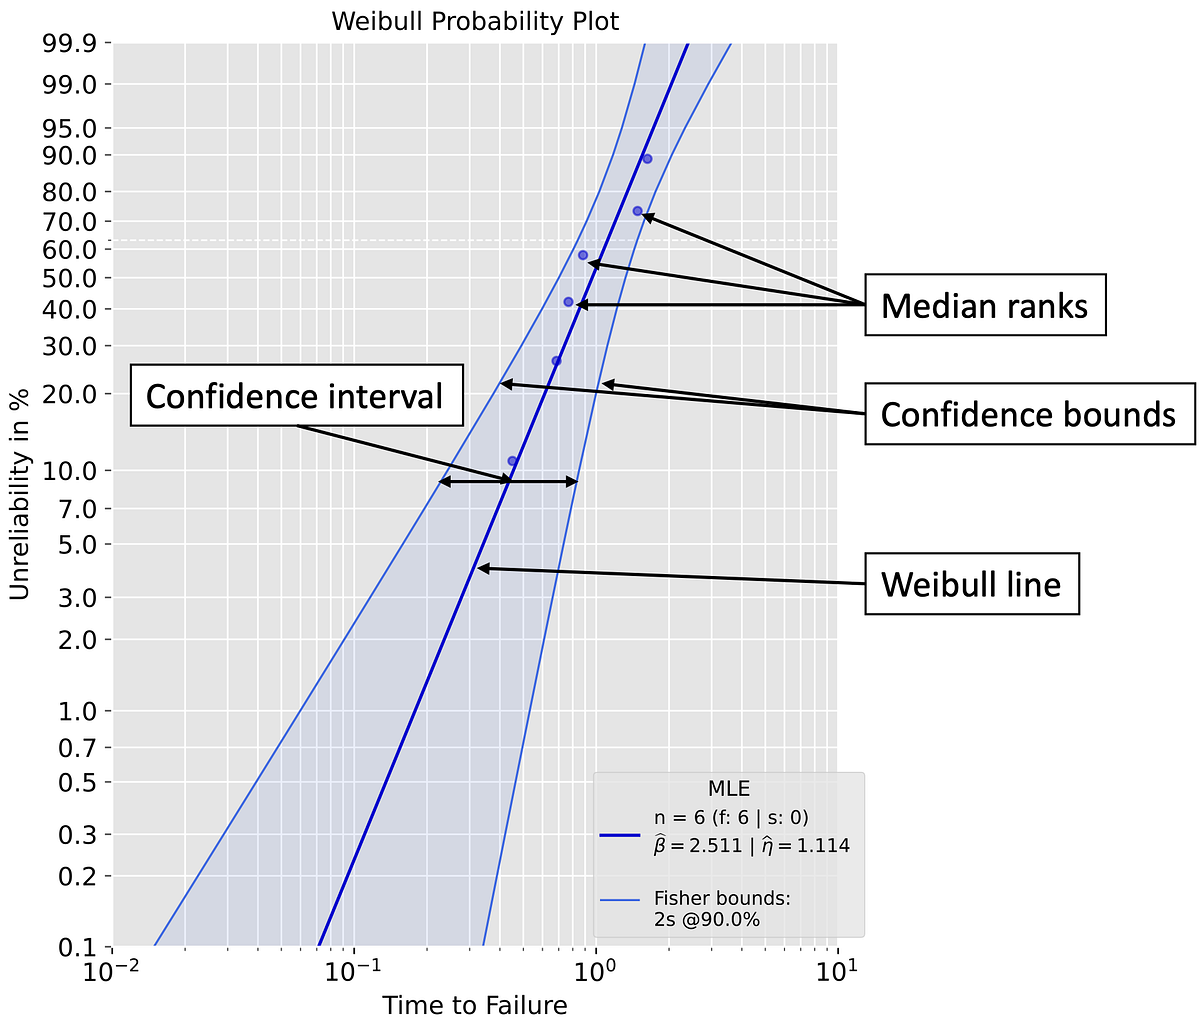
A Quick Guide to The Weibull Analysis
Prophet (FB time series prediction package) docs to Python code. - bjpcjp/fb-prophet
based on "Hands-On Machine Learning with Scikit-Learn & TensorFlow" (O'Reilly, Aurelien Geron) - bjpcjp/scikit-and-tensorflow-workbooks
Easily and efficiently optimize your model’s hyperparameters with Optuna with a mini project

Master usecols, chunksize, parse_dates in pandas read_csv().

Here is my take on this cool Python library and why you should give it a try

Dimensionality reduction is a vital tool for data scientists across industries. Here is a guide to getting started with it.

In this first post in a series on how to build a complete machine learning product from scratch, I describe how to setup your project and tooling.
Low-code Machine Learning with a Powerful Python Library

Streamlit releases v1.0 of its DataOps platform for data science apps to make it easier for data scientists to share code and components.

Hands-on tutorial to effectively use different Regression Algorithms

OpenCV is not the only one

Intel(R) Extension for Scikit-learn is a seamless way to speed up your Scikit-learn application.

What companies can learn from employee turnover data

In this article, I’ll show you five ways to load data in Python. Achieving a speedup of 3 orders of magnitude.
Combining tree-boosting with Gaussian process and mixed effects models - fabsig/GPBoost
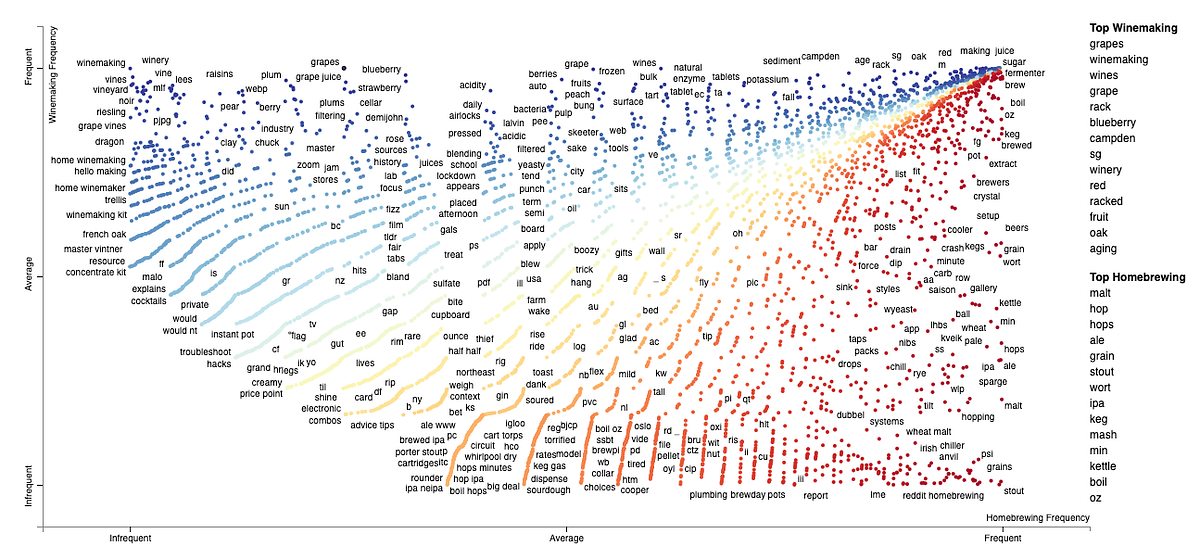
Scroll down to see how to interpret a plot created by a great tool for comparing two classes and their corpora.
Word on the street is that PyTorch lightning is a much better version of normal PyTorch. But what could it possibly have that it brought such consensus in our world? Well, it helps researchers scale…

Prophet is a forecasting procedure implemented in R and Python. It is fast and provides completely automated forecasts that can be tuned by hand by data scientists and analysts.

As Data Science continues to grow and develop, it’s only natural for new tools to emerge, especially considering the fact that data…

If you are dealing with a classification task, I recommend the modAL. As for the sequence labeling task, the AlpacaTag is the only choice for you. Active learning could decrease the number of labels…
PyCaret is an alternate low-code library that can be used to replace hundreds of lines of code with few lines only. See how to use PyCaret's Regression Module for Time Series Forecasting.
XGBoost explained as well as gradient boosting method and HP tuning by building your own gradient boosting library for decision trees.

GPU vs CPU training speed comparison for xgboost

for beginners as well as advanced users

Train, visualize, evaluate, interpret, and deploy models with minimal code.
Simple and reliable optimization with local, global, population-based and sequential techniques in numerical discrete search spaces. - SimonBlanke/Gradient-Free-Optimizers
[et_pb_section fb_built=”1″ admin_label=”Header” _builder_version=”4.12.0″ background_color=”#01012C” collapsed=”on” global_colors_info=”{}”][et_pb_row column_structure=”1_2,1_2″ _builder_version=”4.12.0″ collapsed=”on” global_colors_info=”{}”][et_pb_column type=”1_2″ _builder_version=”4.12.0″ z_index=”10″ custom_padding=”18%||||false|false” global_colors_info=”{}”][et_pb_text _builder_version=”4.14.7″ text_font=”Montserrat|800|||||||” text_text_color=”#01012C” text_font_size=”470px” text_line_height=”1em” positioning=”absolute” custom_margin=”|-30%||-10%|false|false” custom_margin_tablet=”|0%||-5%|false|false” custom_margin_phone=”|0%|||false|false” custom_margin_last_edited=”on|desktop” text_font_size_tablet=”40vw” text_font_size_phone=”40vw” text_font_size_last_edited=”on|tablet” text_text_shadow_style=”preset5″ text_text_shadow_horizontal_length=”-1.5px” text_text_shadow_vertical_length=”-1.5px” text_text_shadow_color=”#DB0EB7″ global_colors_info=”{}”] pc [/et_pb_text][et_pb_text _builder_version=”4.14.7″ header_font=”Barlow Condensed|500|||||||” header_text_color=”#FFFFFF” header_font_size=”122px” custom_margin=”||0px||false|false” header_font_size_tablet=”42px” header_font_size_phone=”26px” header_font_size_last_edited=”on|tablet” global_colors_info=”{}”] low-code machine learning [/et_pb_text][et_pb_button button_url=”https://pycaret.gitbook.io” url_new_window=”on” button_text=”GET STARTED” _builder_version=”4.14.7″ […]
Concluding this three-part series covering a step-by-step review of statistical survival analysis, we look at a detailed example implementing the Kaplan-Meier fitter based on different groups, a Log-Rank test, and Cox Regression, all with examples and shared code.
A comprehensive guide on standard generative graph approaches with implementation in NetworkX

How to identify and segregate specific blobs in your image

A complete explanation of the inner workings of Support Vector Machines (SVM) and Radial Basis Function (RBF) kernel
An Overview of the Most Important Features in Version 0.24

Demystifying the inner workings of BFGS optimization
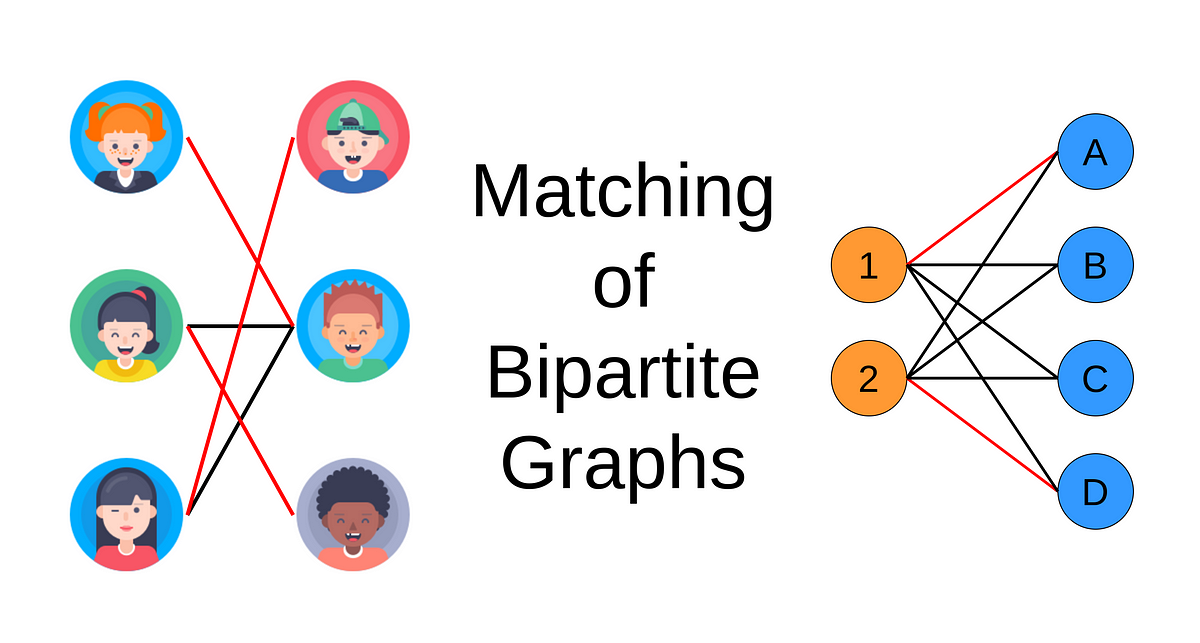
A simple introduction to matching in bipartite graphs with Python code examples

Learn which of the 9 most prominent automatic speech recognition engines is best for your needs, and how to use it in Python programs.

Explained with examples

A step-by-step guide to apply perspective transformation on images
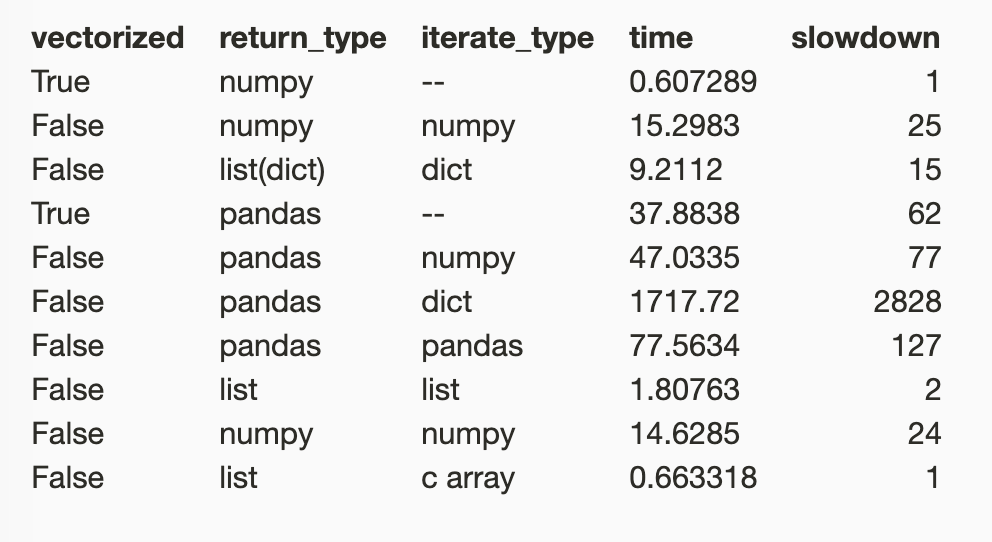
I come from the world of MATLAB and numerical computing, where for loops are shorn and vectors are king. During my PhD at UVM, Professor…

A tour of one of the most popular topic modelling techniques and a guide to implementing and visualising it using pyLDAvis
Python 3.9 New Feature Guide
Overview of the latest developments in version 0.23

Do you know about these packages?
Not enough data for Deep Learning? Try Eigenfaces.
Introduction
Check out these 5 cool Python libraries that the author has come across during an NLP project, and which have made their life easier.
Building up the intuition for how matrices help to solve a system of linear equations and thus regressions problems

Explaining outlier detection with PyCaret library in python

Recursive Feature Elimination, or RFE for short, is a popular feature selection algorithm. RFE is popular because it is easy to configure and use and because it is effective at selecting those features (columns) in a training dataset that are more or most relevant in predicting the target variable. There are two important configuration options when using RFE: the choice…

This new Python package accelerates notebook-based machine learning experimentation

Using q-learning for sequential decision making and therefore learning to play a simple game.

I came across Pycaret while I was browsing on a slack for data scientists. It's a versatile library in which you can apply/evaluate/tune…

Learn matrix multiplication for machine learning by following along with Python examples

How does pivot work? What is the main pandas building block? And more …
5 lesser-known pandas tricks that help you be more productive
https://github.com/sepandhaghighi/pycm https://www.pycm.ir custom_rounder function added #279 complement function added sparse_matrix attribute added…

Extract data from different sources

Expedite your data analysis process

Why and How to use with examples of Keras/XGBoost

Using ARIMA model, you can forecast a time series using the series past values. In this post, we build an optimal ARIMA model from scratch and extend it to Seasonal ARIMA (SARIMA) and SARIMAX models. You will also see how to build autoarima models in python
A Python Library for Outlier and Anomaly Detection, Integrating Classical and Deep Learning Techniques - yzhao062/pyod

Recently I’ve started using PyMC3 for Bayesian modelling, and it’s an amazing piece of software! The API only exposes as much of heavy machinery of MCMC as you need — by which I mean, just the pm.sample() method (a.k.a., as Thomas Wiecki puts it, the Magic Inference Button™). This really frees up your mind to think about your data and model, which is really the heart and soul of data science! That being said however, I quickly realized that the water gets very deep very fast: I explored my data set, specified a hierarchical model that made sense to me, hit the Magic Inference Button™, and… uh, what now? I blinked at the angry red warnings the sampler spat out.

Using the FeatureSelector for efficient machine learning workflows
Using mlxtend to perform market basket analysis on online retail data set.
An easy-to-use library for recommender systems.

In this article, I'll take you through a list of guided projects to master AI & ML with Python. AI & ML Projects with Python.

Documentation, tutorials and guides for the Gradio ecosystem..
-->
wordclouds
categories:
tags: wordclouds
date: 28 Mar 2025
slug:raindrop-wordclouds

A Step by Step Guide to Build a Trend Finder Tool with Python: Web Scraping, NLP (Sentiment Analysis & Topic Modeling), and Word Cloud Visualization
Consider building a word cloud of your writing. It might be all the text on your website, or the last 50 emails you sent. It might be your new book or the speech you’re going to give at Rice …
Create your own word cloud from any text to visualize word frequency.
-->
python (all)
categories:
tags: python
date: 28 Mar 2025
slug:raindrop-python-all
tags: dask, python

Learn how to implement a parallelization process in your data pipeline.
tags: python, best-practices

Learn to leverage Python patterns like a professional.
tags: python
Python is one of the most widely adopted programming languages in the world. Yet, because of it’s ease and simplicity to just “get something working”, it’s also one of the most underappreciated. If you search for Top 10 Advanced Python Tricks on Google or any other search engine, you’ll find tons of blogs or LinkedIn articles going over trivial (but still useful) things like generators or tuples. However, as someone who’s written Python for the past 12 years, I’ve come across a lot of really interesting, underrated, unique, or (as some might say) “un-pythonic” tricks to really level up what Python can do.
tags: spatial, python, clustering

In this article, I'll take you through a practical guide to geospatial clustering with Python. Geospatial Clustering with Python.
tags: python, datasets

This Statology Sprint brings together our most valuable content on Faker, Python's powerful synthetic data generation library, to help you create realistic, privacy-compliant test data for your projects.
tags: prob-stats, python

This article explains its features, installation, and how to use it with examples.
tags: excel, python, csv

tags: mcp, python
Agent Framework / shim to use Pydantic with LLMs
tags: python

In this article, we will explore different vectorized operations with examples.
tags: python, llms

In this article, we explore 10 of the Python libraries every developer should know in 2025.
tags: pandas, python, excel

In this article, we'll explore when and why you might want to use openpyxl directly, and understand its relationship with pandas.
tags: linux, python, packages

I am sharing how I packaged my python application into an executable .deb package in this tutorial.
tags: python

In this article, I'll walk you through a list of 50 Data Analytics projects on various domains to help you gain practical expertise.
tags: python

Check out this guide to learn how you can use asyncio for asynchronous programming in Python.
tags: llms, tokens, python

A Step-by-Step Guide to Setting Up a Custom BPE Tokenizer with Tiktoken for Advanced NLP Applications in Python
tags: python, machine-learning
In this article, I will introduce you to 10 little-known Python libraries every data scientist should know.
tags: sqlite, aws, python
Neat open source project on the GitHub organisation for the UK government's Department for Business and Trade: a "Python virtual filesystem for SQLite to read from and write to S3." …
tags: llms, pip, python

I just released llm-smollm2, a new plugin for LLM that bundles a quantized copy of the SmolLM2-135M-Instruct LLM inside of the Python package. This means you can now pip install …
tags: python, machine-learning
In this article, I'll take you through a list of 50+ Data Analysis Projects you should try to learn Data Analysis.
tags: machine-learning, python
In this article, I'll take you through a list of 80+ hands-on Data Science projects you should try to learn everything in Data Science.
tags: python, machine-learning
In this article, I'll take you through a list of 50+ AI & ML projects solved & explained with Python that you should try.
tags: llms, nlp, machine-learning, python
This is a standalone notebook implementing the popular byte pair encoding (BPE) tokenization algorithm, which is used in models like GPT-2 to GPT-4, Llama 3,...
tags: python, images

In this step-by-step tutorial, you'll learn how to use the Python Pillow library to deal with images and perform image processing. You'll also explore using NumPy for further processing, including to create animations.
tags: python, forecasting-predictions
A hands-on tutorial with Python and Darts for demand forecasting, showcasing the power of TiDE and TFT
tags: python, chip-design

Designing neuromorphic sensory processing units (NSPUs) based on Temporal Neural Networks (TNNs) is a highly challenging task due to the reliance on manual, labor-intensive hardware development processes. TNNs have been identified as highly promising for real-time edge AI applications, mainly because they are energy-efficient and bio-inspired. However, available methodologies lack automation and are not very accessible. Consequently, the design process becomes complex, time-consuming, and requires specialized knowledge. It is through overcoming these challenges that one can unlock the full potential of TNNs for efficient and scalable processing of sensory signals. The current approaches to TNN development are fragmented workflows, as
tags: python, flask

tags: python

In this article, I’ll take you through a list of 75 guided projects to master Data Science with Python. 75 Data Science Projects with Python.
tags: dask, python

Ever wondered how to handle large data without slowing down your computer? Let’s learn about Dask, a tool that helps you work with large data quickly.
tags: python, machine-learning
Popular MLOps Python tools that will make machine learning model deployment a piece of cake.
tags: python, github

Photo by Luke Chesser on Unsplash

tags: python

The richness of Python’s ecosystem has one downside – it makes it difficult to decide which libraries are the best for your needs. This article is an attempt to amend this by suggesting ten (and some more, as a bonus) libraries that are an absolute must in data science.
tags: python

When you need to assign a value to a variable, based on a single condition, and you want to keep your code short and sweet, a ternary operator might be your best option.
tags: python

In this article, I'll take you through the task of document analysis using LLMs with Python. Document Analysis using LLMs with Python.
tags: python, cpython

All you need to know about the latest Python release including Global Interpreter Lock and Just-in-Time compilation.
tags: python

This tutorial explains the Python global interpreter lock (GIL), which prevents multiple threads from executing Python code at the same time.
tags: analytics, machine-learning, python
Learn which variables you should and should not take into account in your model.
tags: python
Re-ranking is an integral component of many retrieval pipelines; however, there exist numerous approaches to it, all with different implementation methods. To mitigate this, we propose rerankers, a Python library which provides a simple, easy-to-use interface to all commonly used re-ranking approaches.
tags: gaussian, python

Understanding and coding Gaussian Splatting from a Python Engineer’s perspective
tags: gaussian, python
Understanding and coding how Gaussian’s are used within 3D Gaussian Splatting
tags: gaussian, python

Part 3 of our Gaussian Splatting tutorial, showing how to render splats onto a 2D image.
tags: books, graphs, python
Modern Graph Theory Algorithms with Python, published by Packt - PacktPublishing/Modern-Graph-Theory-Algorithms-with-Python
tags: analytics, custsvc, python

In this article, I'll take you through the task of Customer Satisfaction Analysis with Python. Customer Satisfaction Analysis with Python.
tags: chatgpt, command-line, markdown, python
Introduction In this post, I want to introduce Mark, a simple CLI tool that uses Markdown and its syntax to interact naturally with the GPT4-vision/GPT4o models.
tags: algorithms-math, python

Understanding what genetic algorithms are and how they can be implemented in Python.
tags: python, search

In the era of vast data, information retrieval is crucial for search engines, recommender systems, and any application that needs to find documents based on their content. The process involves three key challenges: relevance assessment, document ranking, and efficiency. The recently introduced Python library that implements the BM25 algorithm, BM25S addresses the challenge of efficient and effective information retrieval, particularly the need for ranking documents in response to user queries. The goal is to enhance the speed and memory efficiency of the BM25 algorithm, a standard method for ranking documents by their relevance to a query. Current methods for implementing
tags: dask, databases, devops, python

This post is meant to guide you through some of the lessons I’ve learned while working with multi-terabyte datasets. The lessons shared are focused on what someone may face as the size of the…
tags: python, recommenders

In this article, I'll take you through the recommendation algorithms you should know and how to implement them using Python.
tags: jekyll, python, yaml
tags: python

Every command-line tool included with Python. These can be run with python -m module_name.
tags: a-b, prob-stats, python

A deep-dive into how and why Statsmodels uses numerical optimization instead of closed-form formulas
tags: python, venv

How to create, activate, use, and delete a Python venv on Windows, Linux, and MacOS. We'll also look at how a Python venv works internally.
tags: python, sqlite

Get started with SQLite databases in Python using the built-in sqlite3 module.
tags: python
Optimize Your Python Workflow: Proven Techniques for Crafting Production-Ready Code
tags: python

In the vast world of data science, countless tools are available to help analysts and researchers make sense of data and build powerful machine-learning models. While some tools are widely known and used, others might not be as familiar to many. Here are the ten great Python packages that can significantly enhance your workflow. 1. LazyPredict: LazyPredict is all about efficiency. It allows the training, testing, and evaluation of multiple machine-learning models simultaneously with just a few lines of code. Whether one is working on regression or classification tasks, LazyPredict streamlines the process and helps find the best model for
tags: python

With the help of PyScript, you can develop rich frontends with Python for the web and even make use of various Python modules.
tags: pdfs, python
Extracting text from a PDF file using GNU less or Python's pypdf. Why its not entirely clear just what a text extractor should do.
tags: pip, python

After setting up your Python project, creating a requirements.txt file is essential for simplifying...
tags: python, scipy
tags: data-structures, python

Advanced Data Structures: Sets, Tuples, and Comprehensions In the world of programming,...
tags: python
A dense Python cheat sheet with just what you need. Comprehensive but selective coverage of core Python, with links to detailed documentation and resources. Responsive design with light and dark modes. Download and print PDF. Feedback is welcome.
tags: finance, python

In this article, I'll take you through a guide to some essential formulas for Data Science in finance with implementation using Python.
tags: python, programming

In the rapidly evolving world of technology and artificial intelligence, a new development has emerged that promises to impact the Python and AI communities significantly. Modular, a pioneering tech firm, has announced the open-sourcing of Mojo, a programming language designed to enhance Python's capabilities, allowing developers to write code that scales 'all the way down to metal code.' This move is set to transform Python programming, offering unprecedented speed and efficiency. Modular has long championed open-source principles, and the release of Mojo under the Apache 2 license represents a significant step towards fulfilling its vision. Since its initial release in
tags: optimization, python
How to implement PSO
tags: python

In this tutorial, you'll learn about duck typing in Python. It's a typing system based on objects' behaviors rather than on inheritance. By taking advantage of duck typing, you can create flexible and decoupled sets of Python classes that you can use together or individually.
tags: python

30 Python libraries to solve most AI problems, including GenAI, data videos, synthetization, model evaluation, computer vision and more.
tags: geofencing, geography, python

Strategically enhancing address mapping during data integration using geocoding and string matching
tags: elasticsearch, python

This blog will introduce you to some core concepts and building blocks of working with the official...
tags: algorithms-math, machine-learning, python
Insanely fast and reliable smoothing and interpolation with the Whittaker-Eilers method.
tags: fastapi, python

GitLab.com
tags: llms, pdfs, python

LlamaIndex is a simple, flexible data framework for connecting custom data sources to large language models (LLMs).
tags: deep-learning, numpy, python

Understanding how convolutional neural networks (CNNs) operate is essential in deep learning. However, implementing these networks, especially convolutions and gradient calculations, can be challenging. Many popular frameworks like TensorFlow and PyTorch exist, but their complex codebases make it difficult for newcomers to grasp the inner workings. Meet neograd, a newly released deep learning framework developed from scratch using Python and NumPy. This framework aims to simplify the understanding of core concepts in deep learning, such as automatic differentiation, by providing a more intuitive and readable codebase. It addresses the complexity barrier often associated with existing frameworks, making it easier for
tags: python, scikit-learn
Python library for portfolio optimization built on top of scikit-learn - skfolio/skfolio
tags: forecasting-predictions, python

This article will take you through some of the best Business Forecasting project ideas you should try. Business Forecasting Project Ideas.
tags: python

FastAPI framework, high performance, easy to learn, fast to code, ready for production
tags: python

Reviewing the JIT in Python 3.13
tags: python, venv, virtualization

Python has been my go-to programming language since I started coding. Python, as a programming...
tags: algorithms-math, machine-learning, market-basket, python
In this article, I'll take you through the task of Market Basket Analysis using Python. Market Basket Analysis using Python.
tags: python

Let's continue our exploration of Python's magic methods in this second part of the series. This part...
tags: jupyter, python, venv
I trying to use virtualenv on jupyter notebook, to use all packages installed in an environment, but inside jupyter they are not recognized. Already tried: pip install tornado==4.5.3 pip install
tags: python

Source code: Lib/venv/ The venv module supports creating lightweight “virtual environments”, each with their own independent set of Python packages installed in their site directories. A virtual en...
tags: flask, python

Introduction In the vast landscape of web development, Flask stands out as a lightweight yet...
tags: fonts-typography, llms, python

This is a story of my journey learning to build generative ML models from scratch and teaching a computer to create fonts in the process.
tags: python
Enhance your code quality with the beauty of match statements and object slicing.
tags: algorithms-math, dsp, fourier, github, python
Notebooks for the python tutorials of my youtube channel. See specific youtube video for link to specifc notebook. - lukepolson/youtube_channel
tags: python

In less than 100 pages, the book covers all important topics about discrete chaotic dynamical systems and related time series and stochastic processes, ranging from introductory to advanced, in one and two dimensions. State-of-the art methods and new results are presented in simple English. Yet, some mathematical proofs appear for the first time in this
tags: graphs, python

An increasingly popular method for representing data in a graph structure is the usage of knowledge graphs (KGs). A KG is a group of triples (s, p, o), where s (subject) and o (object) are two graph nodes, and p is a predicate that describes the type of connection that exists between them. KGs are often supported by a schema (such as an ontology) that outlines the key ideas and relationships in a field of study and the constraints that govern how these ideas and relationships can interact. Many of the activities for which KGs are employed have a small
tags: apis, llms, python
A complete beginner-friendly introduction with example code
tags: python

In this tutorial, you'll learn how to use a Python virtual environment to manage your Python projects. You'll also gain a deep understanding of the structure of virtual environments created with the venv module, as well as the rationale behind using virtual environments.
tags: dask, numpy, pandas, python, sympy

3 Python libraries for scientific computation you should know as a data professional.
tags: python

And why you should learn how to use them to filter Python sequences more elegantly.
tags: python, supply-chain
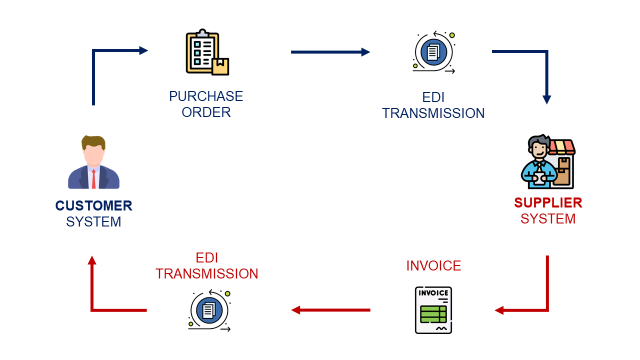
Explore how Electronic Data Interchange (EDI) facilitates modern supply chain management.
tags: jupyter, python
A much overlooked way to save some time.
tags: forecasting-predictions, optimization, python

In this article, I'll take you through the task of Demand Forecasting and Inventory Optimization using Python.
tags: excel, python

The realm of data analysis has long struggled with seamlessly integrating the capabilities of Python—a powerful programming language widely used for analytics—with the familiar interface and functionalities of Microsoft Excel. This challenge has hindered efficient decision-making and data processing for professionals who rely on both tools for their tasks. The need for a cohesive solution that bridges this gap is evident. Existing attempts to merge Python and Excel have often been cumbersome and involved complex setups. Analysts resorted to using external scripts, third-party tools, or manual data transfers between the two environments. These methods introduced inefficiencies, raised security concerns, and
tags: antennas, python

Modeling electric and magnetic fields
tags: python

Introduction: Python, a popular programming language known for its simplicity and versatility,...
tags: llms, pdfs, python
Use these text extraction techniques to get quality data for your LLM models
tags: prob-stats, python, quality
Total Productive Maintenance
tags: analytics, prodmgmt, python
8 stories · A guide to building an end-to-end marketing mix optimization solution for your organization.
tags: python

Seth Michael Larson pointed out that the Python gzip module can be used as a CLI tool like this:
tags: machine-learning, python, survival-analysis
Understand survival analysis, its use in the industry, and how to apply it in Python
tags: python

Filtering sequences, like lists, is a common task for developers. However, the code can become...
tags: analytics, machine-learning, prodmgmt, python, uplift
Applying causal machine learning to trim the campaign target audience
tags: linux, pip, python
Cleaning Pip cache helps you in troubleshooting and getting fresh Python packages.
tags: python

You keep using that word. I don’t think it means what you think it means.
tags: machine-learning, python, scikit-learn
Master Sklearn pipelines for effortless and efficient machine learning. Discover the art of building, optimizing, and scaling models with ease. Level up your data preprocessing skills and supercharge your ML workflow today
tags: python

When we see the documentation of any function that contains *args and **kwargs, have you ever...
tags: pandas, python, spatial
Learn how to manipulate and visualize vector data with Python’s GeoPandas
tags: music, python, spotify, youtube

I developed the script to convert the Spotify playlist to YouTube playlist. I am here to share how I...
tags: pytest, python
How to use Pytest fixtures and mock for unit testing
tags: analytics, pricing, python

In this article, I will walk you through the task of Retail Price Optimization with Machine Learning using Python. Retail Price Optimization.
tags: python

No headaches and unreadable code from os.path
tags: python
tags: python, sales-ops-planning, supply-chain

In this article, I will take you through the task of Supply Chain Analysis using Python. Supply Chain Analysis using Python.
tags: pandas, programming, python

Demonstrating how to use the new blazing fast DataFrame library for interacting with tabular data
tags: python

Discover the Hidden Secrets of Python Exception Handling
tags: python
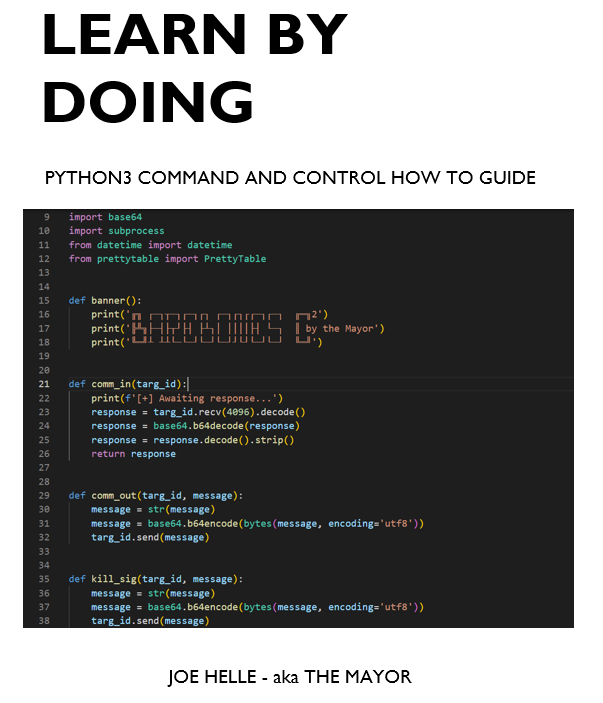
Introduction and Chapter One
tags: python
Static type checking for Python
tags: association-rules, machine-learning, market-basket, python
Create insights from frequent patterns using market basket analysis with Python
tags: geography, programming, python
Understanding spatial trends in the location of Tokyo convenience stores
tags: machine-learning, programming, pycaret, python
Exploring the Latest Enhancements and Features of PyCaret 3.0
tags: python

Introduction If you're a Python developer looking to take your code to the next level,...
tags: python, visualization

DISCLAIMER: This blog post was written by a human with the help of AI Hypotrochoids and epitrochoids...
tags: jupyter, python, voila
tags: jupyter, programming, python, visualization, voila
Voilà turns Jupyter notebooks into standalone web applications
tags: flask, pytest, python

Welcome to this tutorial on how to test Flask applications with Pytest. Flask is a popular web...
tags: matplotlib, python, visualization
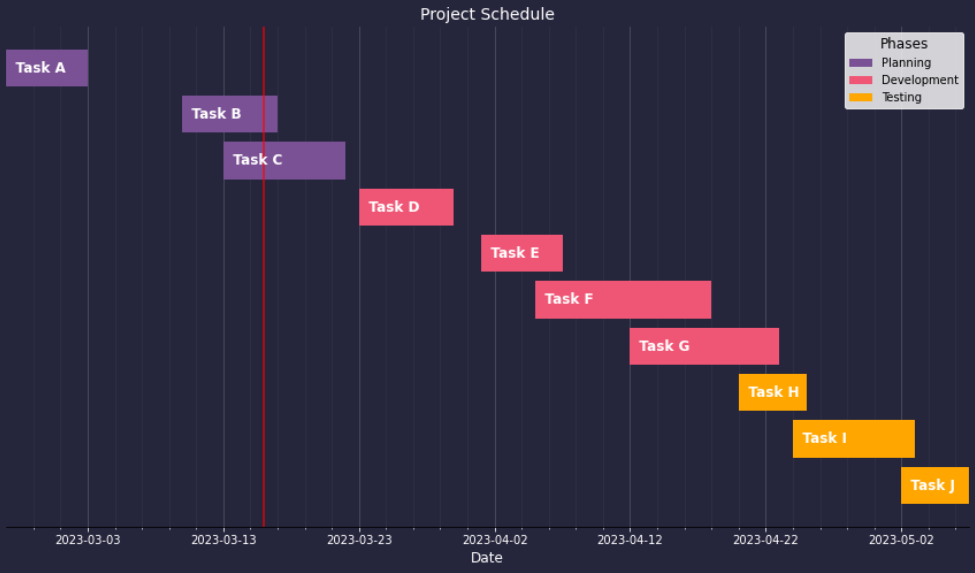
Utilising Python’s Matplotlib to Create Advanced Data Visualisations
tags: python, yaml

YAML is easy to write for humans, and read for computers. Learn how to open, parse, and read YAML with Python. With lots of example code!
tags: machine-learning, programming, python, visualization
A quick guide on how to make clean-looking, interactive Python plots to validate your data and model
tags: cpus, python, scikit-learn
How to considerable reduce training time changing only 1 line of code
tags: python, pytorch

We are excited to announce the release of PyTorch® 2.0 which we highlighted during the PyTorch Conference on 12/2/22! PyTorch 2.0 offers the same eager-mode development and user experience, while fundamentally changing and supercharging how PyTorch operates at compiler level under the hood with faster performance and support for Dynamic Shapes and Distributed.
tags: python

After needing to do a deep dive on the venv module (which I will explain later in this blog post as to why), I thought I would explain how virtual environments work to help demystify them. Why do virtual environments exist? Back in my the day, there was no concept
tags: python
Decorators provide a new and convenient way for everything from caching to sending notifications.
tags: machine-learning, programming, python, testing
Use natural language to test the behavior of your ML models
tags: graphs, python
Learn how to use the NetworkX package to visualize complex networks
tags: python

I reviewed 1,000+ Python libraries and discovered these hidden gems I never knew even existed.
tags: python

While multiprocessing allows Python to scale to multiple CPUs, it has some performance overhead compared to threading.
tags: jupyter, programming, python, visualization

An Introduction to the PyGWalker Library for Easy Data Visualisation
tags: python

Learn about Python generators and write memory-efficient and Pythonic code.
tags: python, sympy
An introduction into symbolic computations in Python. Don't worry, it's much simpler than it sounds. It's about making Python do your math for you with very little investment in the technology.
tags: programming, python
tags: pandas, programming, python

Pandas receives over 3M downloads per day. But 99% of its users are not using it to its full potential.
tags: machine-vision, python
A concise computer vision project for building image filters using Python
tags: ecommerce, python, recommenders
I built a recommender system for Amazon’s electronics category
tags: python
Do more things with less code without compromising on quality
tags: machine-learning, outliers, python
Discover how to effectively detect multivariate outliers in machine learning with PyOD in Python. Learn to convert anomaly scores to probability confidence, choose the best outlier classifier and determine the right probability threshold for improved model accuracy.
tags: jupyter, programming, python

We are pleased to announce a major update to JupyterLab Desktop which adds many new features with main focus on the user experience…
tags: python, visualization

Learn how to quickly create a presentation-ready plot to aid your data storytelling
tags: python, visualization
A Great Alternative to Pie Charts for Data Visualisation
tags: pocket, python
Export archived article data from Pocket · GitHub
tags: machine-learning, python, scikit-learn
There are various challenges in MLOps and model sharing, including, security and reproducibility. To tackle these for scikit-learn models, we've developed a new open-source library: skops. In this article, I will walk you through how it works and how to use it with an end-to-end example.
tags: books, python
translate python documents to Chinese for convenient reference 简而言之,这里用来存放那些Python文档君们,并且尽力将其翻译成中文~~ - hiddenJuliet/pythondocument
tags: hyperparameters, machine-learning, python
Become familiar with some of the most popular Python libraries available for hyperparameter optimization.
tags: machine-learning, python
Circular data can present unique challenges when it comes to analysis and modeling
tags: packages, python
The Python Package Index (PyPI) is a repository of software for the Python programming language.
tags: python
Your Comprehensive Guide to SHAP, TreeSHAP, and DeepSHAP
tags: best-practices, machine-learning, python, scikit-learn
Tips for taking full advantage of this machine learning package
tags: deep-learning, python, pytorch, tensorflow

Many developers who use Python for machine learning are now switching to PyTorch. Find out why and what the future could hold for TensorFlow.
tags: malware, python

Six malicious Python packages distributed via PyPI deploying info stealers and use Cloudflare tunnels to sneak through firewalls.
tags: geometry, machine-learning, programming, python
A cross-framework package for kernels and Gaussian processes on manifolds, graphs, and meshes
tags: feature-engineering, machine-learning, python
Python Feature Engineering Cookbook Second Edition, published by Packt - PacktPublishing/Python-Feature-Engineering-Cookbook-Second-Edition
tags: datasets, geofencing, geography, programming, python
A ready-to-run code which identifies and anonymises places, based on the GeoNames database
tags: advertising-commercials, analytics, programming, python
Media Mix modeling, its implementation, and practical tips
tags: python
Discover the power of anonymous functions and functional programming in Python
tags: pytest, python

Unit-testing is a really important skill for software development. There are some great Python libraries to help us write and run unit-test…
tags: datasets, plotly, python, visualization

Some Unique Data Visualization Techniques for Getting High-Level Insight into the Data
tags: programming, python, youtube

The post highlights three useful applications of using python to automate simple desktop tasks. Stay tuned till the end of the post to find the reference for a bonus resource.
tags: machine-learning, python, supply-chain
Mathematical Modeling, Solution, and Visualization Using PuLP and VeRoViz
tags: python, seaborn, visualization

Using a heatmap to visualise a confusion matrix, time-series movements, temperature changes, correlation matrix and SHAP interaction values
tags: gifs, matplotlib, python
A data visualization technique for 2-dimensional time series data using imageio
tags: python, seaborn, visualization
Simple and easy pieces of code to enhance your seaborn scatter plots
tags: python, visualization

A guide on how to make different types of maps using Python
tags: debugging, python
Logging crash course with common logging issues addressed
tags: python

Python decorator is a very useful tool to help us code efficiently. As I mentioned in my previous article, coding efficiently is one of the…
tags: python, sankey, visualization
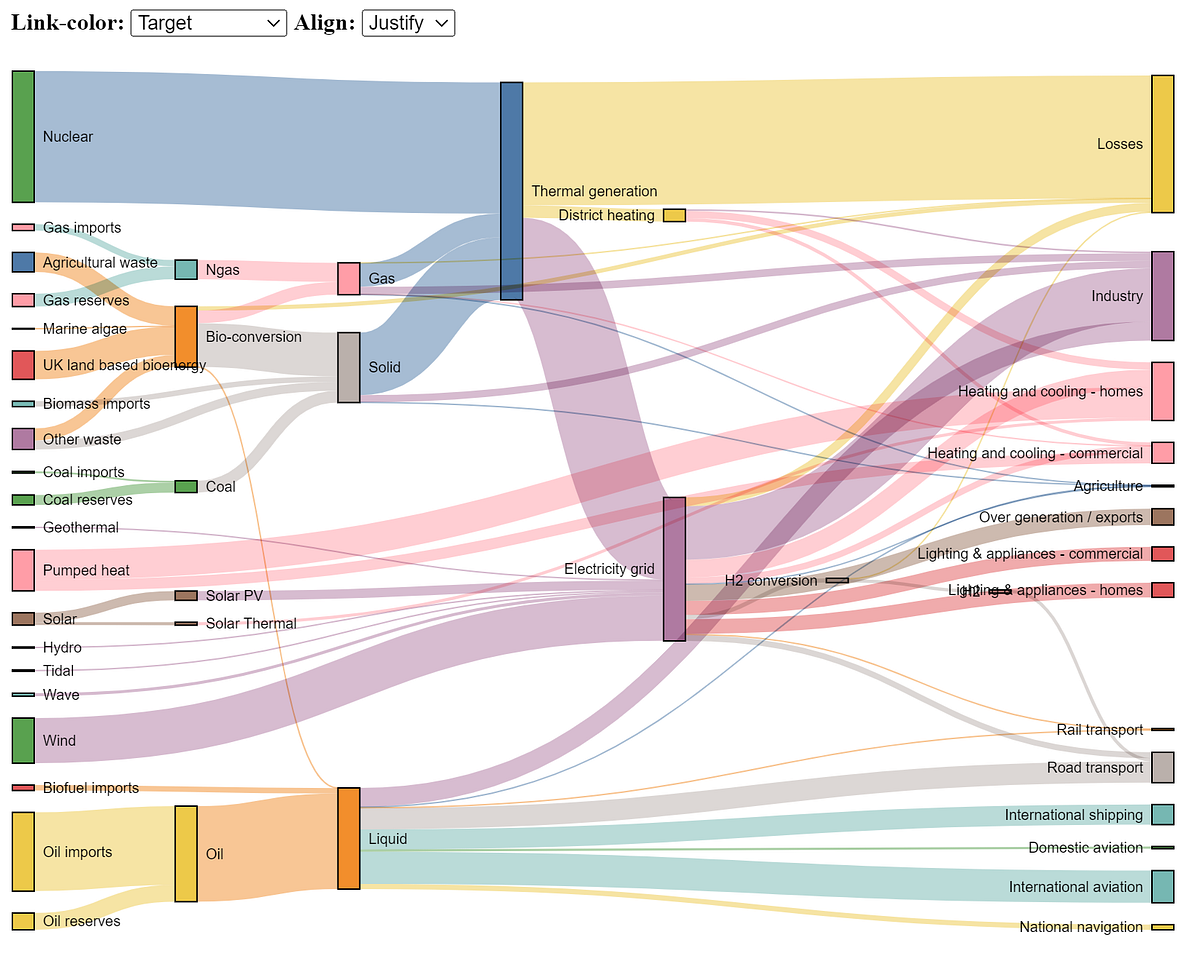
The Sankey chart is a great way to discover the most prominent contributions just by looking at how individual items flow across states.
tags: python, visualization

We look at how to create the 12 most useful graphs and charts in Python and Streamlit
tags: nlp, python, scikit-learn

The post explains the significance of CountVectorizer and demonstrates its implementation with Python code.
tags: debugging, python
Why I stopped using print() statements for debugging and why you should too
tags: deep-learning, python, search
Pure python implementation of product quantization for nearest neighbor search - matsui528/nanopq
tags: d3, python, visualization
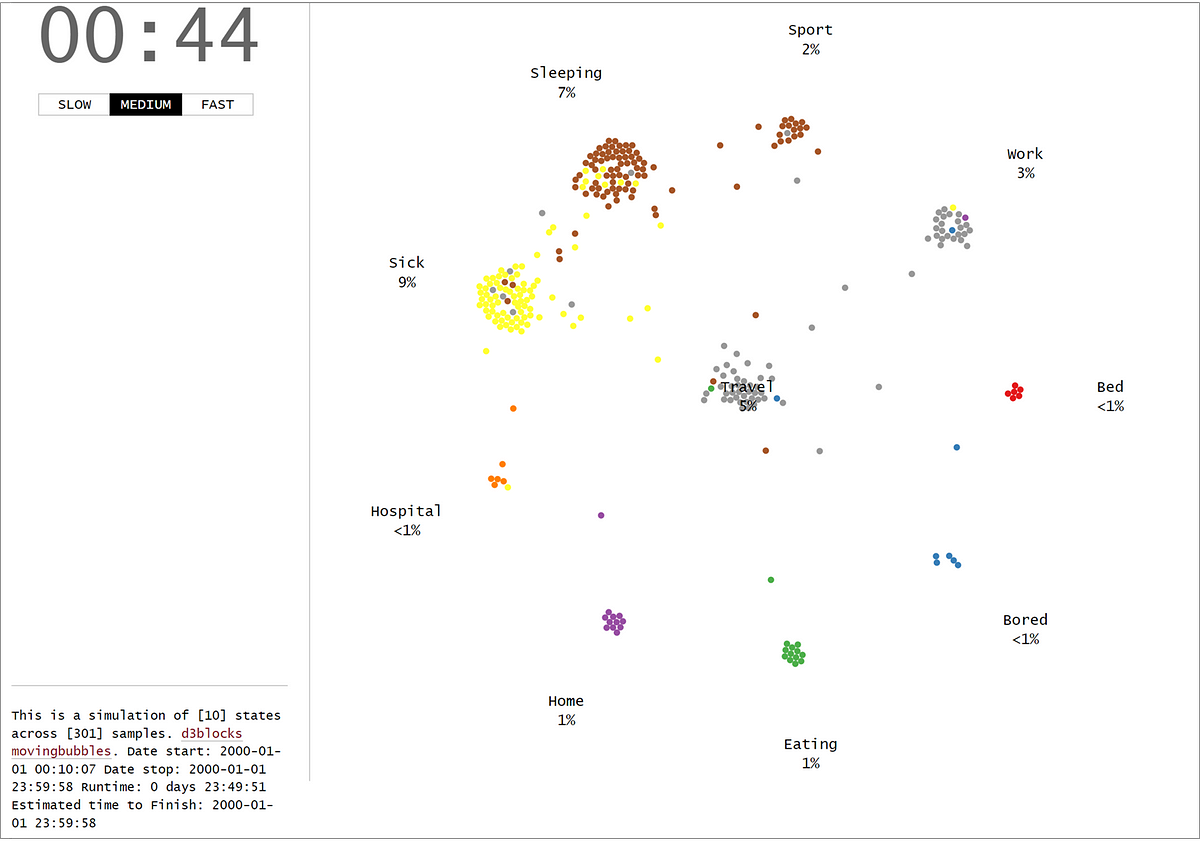
The MovingBubble chart is one of those mind-blowing charts to look at. Learn how to create them using your own data set and Python!
tags: cuda, numba, python

Follow this series to learn about CUDA programming from scratch with Python. Part 4 of 4.
tags: machine-learning, metrics, python, search
How to compress and fit a humongous set of vectors in memory for similarity search with asymmetric distance computation (ADC)
tags: analytics, bayes, forecasting-predictions, machine-learning, python
Learn how to build MMMs for different countries the right way
tags: algorithms-math, dsp, fourier, python

From a theoretical introduction to the hands-on implementation: here’s what you need to know about the Chirplet Transform
tags: d3, python, visualization
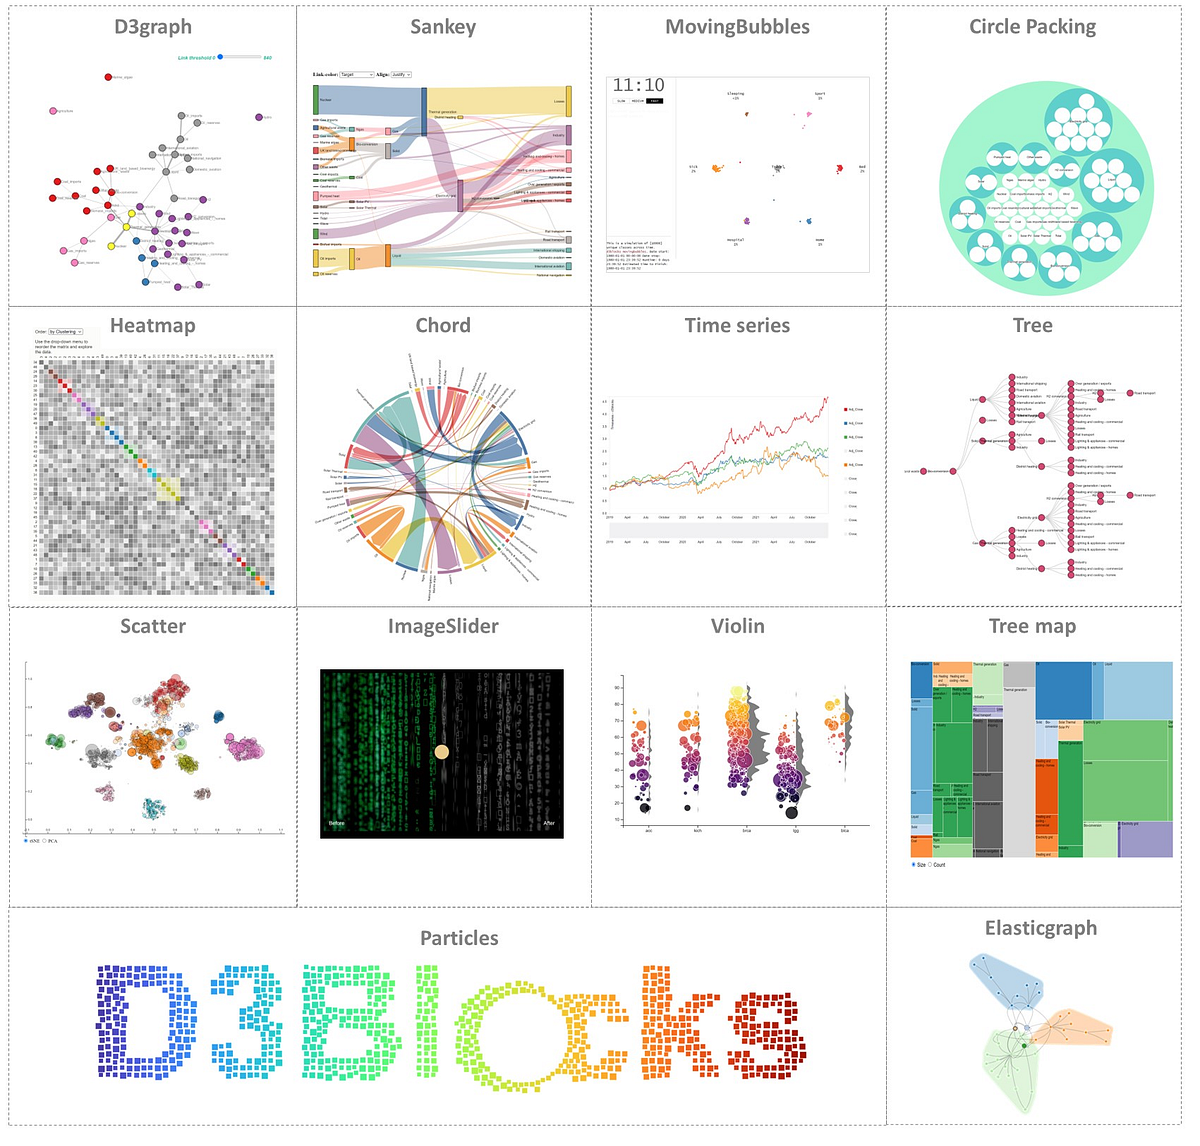
Create interactive, and stand-alone charts that are built on the graphics of d3 javascript (d3js) but configurable with Python.
tags: jupyter, python
tags: python
— Mike Driscoll (@driscollis)
tags: cameras, machine-vision, movies-television, python

Everything you need to know about Stereo Geometry
tags: python

I subscribed to the Real Python mailing list two years ago, and I learned a lot of tips and tricks...
tags: python
Python has become the most popular language in many rapidly evolving sectors, such as deep learning and data sciences. Yet its easy readability comes at the cost of performance. Of course, we all complain about program performance from time to time, and Python should certainly not take all the blame. Still, it's fair to say that Python's nature as an interpreted language does not help, especially in computation-intensive scenarios (e.g., when there are multiple nested for loops).
tags: python
Making you understand the characteristics of Python Tuples and how you deal with them
tags: machine-learning, programming, python, visualization
tags: pycaret, python
A beginner’s guide to PyCaret’s natural language processing module.
tags: python
Deep dive into the import system
tags: nlp, python, spacy
I’ve never used spaCy beyond simple named entity recognition tasks. Boy was I wrong.
tags: pandas, python
Simple tips to optimize the memory utilization in Pandas
tags: python

This article will take you through some of the most important Python modules for beginners. Most Important Python Modules for Beginners.
tags: python

Some off-the-beaten uses of Python learned from reading libraries.
tags: python

How to painlessly monitor file creation, modification, and deletion programmatically.
tags: python
Crystalise your understanding of this amazing library through animated GIFs and learn how to write more elegant code
tags: nlp, nltk, python, spacy
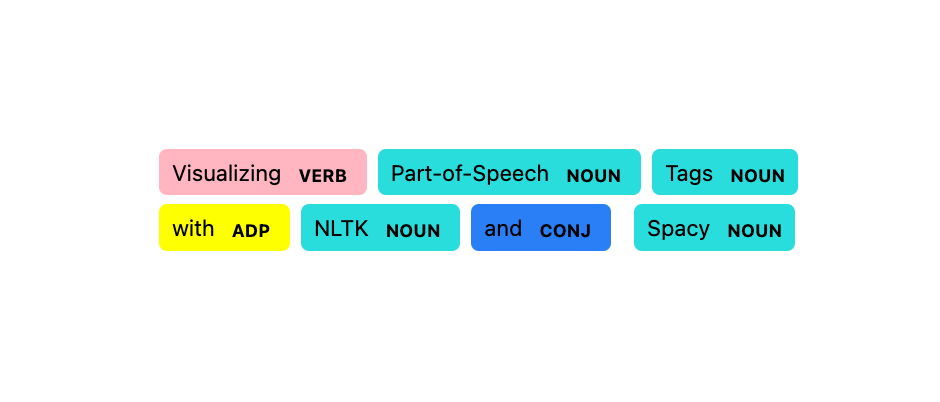
Customizing displaCy’s entity visualizer
tags: python
— Mike Driscoll (@driscollis)
tags: machine-learning, python, visualization
Creating eye-catching graphs with Python to use instead of bar charts.
tags: clustering, graphs, machine-learning, python
Graph partitioning has been a long-lasting problem and has a wide range of applications. This post shares the methodology for graph…
tags: machine-learning, programming, python
Reduce time in your data science workflow with these libraries.
tags: python

Learn various techniques to reduce data processing time by using multiprocessing, joblib, and tqdm concurrent.
tags: pytest, python
Write robust unit tests with Python pytest
tags: graphs, matplotlib, python, visualization

The good-looking cousin of stacked area charts
tags: matplotlib, python, visualization

Easily adding arrows, multiple axes, gradient fill, and more
tags: databases, python
3 steps (+examples) to connect to MS SQL Server, MySQL, Oracle and many other databases
tags: graphs, programming, python, visualization
DOT rendering programs and utilities.
tags: javascript, programming, python, ruby
Master programming by recreating your favorite technologies from scratch. - codecrafters-io/build-your-own-x
tags: books, graphs, python, _r_

A technical manual of graphs, networks and their applications in the people and social sciences
tags: machine-learning, python, splines
Capturing non-linear advertising saturation and diminishing returns without explicitly transforming media variables
tags: python, reinforcement-learning
One of the biggest barriers to traditional machine learning is that most supervised and unsupervised machine learning algorithms need huge amounts of data to be useful in real world use cases. Even…
tags: machine-learning, python, scikit-learn, time-series
How to forecast with scikit-learn and XGBoost models with sktime
tags: crypto, python
I'm sick of complex blogging solutions, so markdown files in a git repo it is - francisrstokes/githublog
tags: algorithms-math, machine-learning, python
Brain-inspired unsupervised machine learning through competition, cooperation and adaptation
tags: machine-learning, python
Use linear programming to minimize the difference between required and scheduled resources
tags: python
— Mike Driscoll (@driscollis)
tags: gifs, python
Here you can add multiple Images and duration as well in the code. — Python Coding (@clcoding)

tags: machine-learning, python
The BAIR Blog
tags: browsers, programming, python, web-crawlers
🗃 Open source self-hosted web archiving. Takes URLs/browser history/bookmarks/Pocket/Pinboard/etc., saves HTML, JS, PDFs, media, and more... - ArchiveBox/ArchiveBox
tags: pandas, pocket, python
I’ve been using Pocket for many years to collate all the articles, blog posts, recipes, etcI’ve found online. I decided it would be…
tags: python

Python has a secret superpower with a similarly stupendous name: Magic Methods. These methods can...
tags: geography, machine-learning, python, visualization
Using the Folium Package to Create Stunning Choropleths
tags: python, visualization

How to make choropleths with different data structures in Python
tags: machine-learning, python
How to use Python libraries like Open3D, PyVista, and Vedo for neighborhood analysis of point clouds and meshes through KD-Trees/Octrees
tags: programming, python
Part 6: Multiple Measures of Performance
tags: command-line, pip, python

Whenever you are installing python packages, you should always use a virtual environment. pip makes...
tags: ocr, programming, python

Introduction Hello! In this quick tutorial I will show how to create a simple program...
tags: python, streamlit
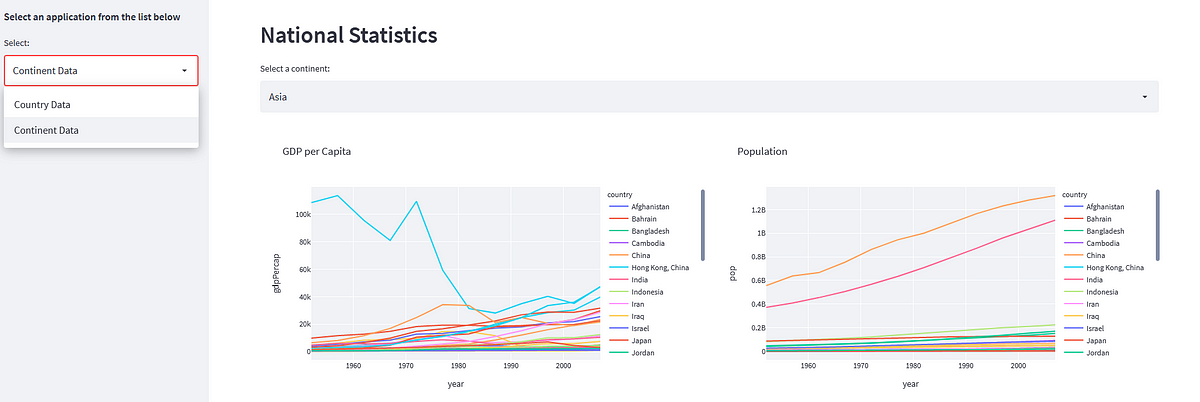
Streamlit may not have been designed for full-blown websites, but it is fairly straightforward to create multiple pages in a single app
tags: cython, python
Easy Python code compilation for blazingly fast applications
tags: design-patterns, python
A collection of design patterns/idioms in Python.
tags: geography, python

Maps and geography have been a long passion of mine, especially in my International Relations background. A side goal of mine as I grow as…
tags: command-line, python
(BTW, bat: ) — Ned Batchelder (@nedbat)
tags: decorators, python

Going knee-deep into the internals of Python
tags: decorators, machine-learning, python
I show toy implementations of Python decorator patterns that may be useful for Data Scientists.
tags: machine-learning, programming, python, scikit-learn
The introduction of the intel sklearn extension. Make your Random Forest even faster than XGBoost.
tags: machine-learning, python
Which is the best algorithm?
tags: golang, python

Switching to a new language is always a big step, especially when only one of your team members has prior experience with that language. Early this year, we switched Stream’s primary programming language from Python to Go. This post will explain some of the reasons why we decided to leave Python behind and make the switch to
tags: python, seaborn, visualization
Learn how to visualize data using Seaborn’s axes-level and figure-level plots
tags: autoencoders, deep-learning, python

A comparison between Undercomplete and Sparse AE with a detailed Python example
tags: pandas, python
A detailed explanation of how groupby works under the hood to help you understand it better.
tags: python
Let’s compare Python 3.10 vs. Python 3.11 in an extensive benchmark test. Spoiler alert: Python 3.11 is up to 64% faster!
tags: clustering, machine-learning, python
Apply Louvain’s Algorithm in Python for Community Detection
tags: python

In this article we will focus on a complete walk through of a Python tuple data structure
tags: python

I was recently reading Django’s Source Code, and I came across the @wraps decorator, which led me to...
tags: python, sql

Finally, start practicing SQL with your own database
tags: python

Saving time and code with flexible utility functions and paradigms
tags: python

Here is my take on this must-have Python library and why you should give it a try
tags: github-awesome, glossaries, python
>>>, The default Python prompt of the interactive shell. Often seen for code examples which can be executed interactively in the interpreter.,,..., Can refer to:- The default Python prompt of the i...
tags: geography, python
Create interactive maps with just a few lines of Python code
tags: github-awesome, python
An opinionated list of awesome Python frameworks, libraries, software and resources. - vinta/awesome-python
tags: python
A peek into data structures, programming concepts, and best practices.
tags: python

Understanding the purpose of requirements.txt, setup.py and setup.cfg in Python when developing and distributing packages
tags: programming, python
A test is code that executes code. When you start developing a new feature for your Python project,...
tags: machine-learning, programming, prophet, python
As a data analyst at Microsoft, I must investigate and understand time-series data every day. Besides looking at some key performance…
tags: pdfs, python, web-scraping

You want to make friends with tabula-py and Pandas
tags: ocr, pdfs, python

This is a cross-post from my blog Arcadian.Cloud, go there to see the original post. I have some...
tags: pdfs, python, web-scraping

Extract Data from PDF Files Effectively
tags: python

Understanding Attributes in Python Python is a very dynamic language by nature. Variables...
tags: algorithms-math, graphs, python
tags: machine-learning, nlp, python, topic-modeling
Topic modeling can bring NLP to the next level. Here’s how.
tags: pdfs, python
🐍🔥 — Mike Driscoll (@driscollis)
tags: python
Immediately start using them…
tags: algorithms-math, graphs, machine-learning, python
Because Graph Analytics is the future
tags: machine-learning, python, scikit-learn
based on "Hands-On Machine Learning with Scikit-Learn & TensorFlow" (O'Reilly, Aurelien Geron) - bjpcjp/scikit-and-tensorflow-workbooks
tags: decorators, python
Do you want to write concise, readable, and efficient code? Well, python decorators may help you on your journey.
tags: machine-learning, python, survival-analysis
A Quick Guide to The Weibull Analysis
tags: machine-learning, prophet, python
Prophet (FB time series prediction package) docs to Python code. - bjpcjp/fb-prophet
tags: python, visualization
Based on scatterplot by Myriam Barnes. A simple to viz categories in a scatter plot. - bjpcjp/category-scatterplot
tags: maps, python, spatial, visualization

Who needs GIS when you can build eye-catching 3D topography maps with Python?
tags: postgres, python

This PostgreSQL Python section shows how to work with PostgreSQL from Python programming language using the psycopg2 database driver.
tags: python, seaborn
Sourced from O'Reilly ebook of the same name.
tags: pycaret, python
Introductin to PyCaret.
tags: machine-learning, python, svm
based on "Hands-On Machine Learning with Scikit-Learn & TensorFlow" (O'Reilly, Aurelien Geron) - bjpcjp/scikit-and-tensorflow-workbooks
tags: numpy, python
Sourced from O'Reilly ebook of the same name.
tags: numba, python
tags: pandas, python
Sourced from O'Reilly ebook of the same name.
tags: hyperparameters, machine-learning, optimization, python
Easily and efficiently optimize your model’s hyperparameters with Optuna with a mini project
tags: python, youtube
🐍🔥 — Mike Driscoll (@driscollis)
tags: finance, python

Build in minutes. Deploy in seconds. Quant workflow reimagined. Built by developers for developers 🚀
tags: finance, python, risk

Metrics surround us. Whether you're building the next big thing and need to measure customer churn,...
tags: excel, python
tags: jupyter, python
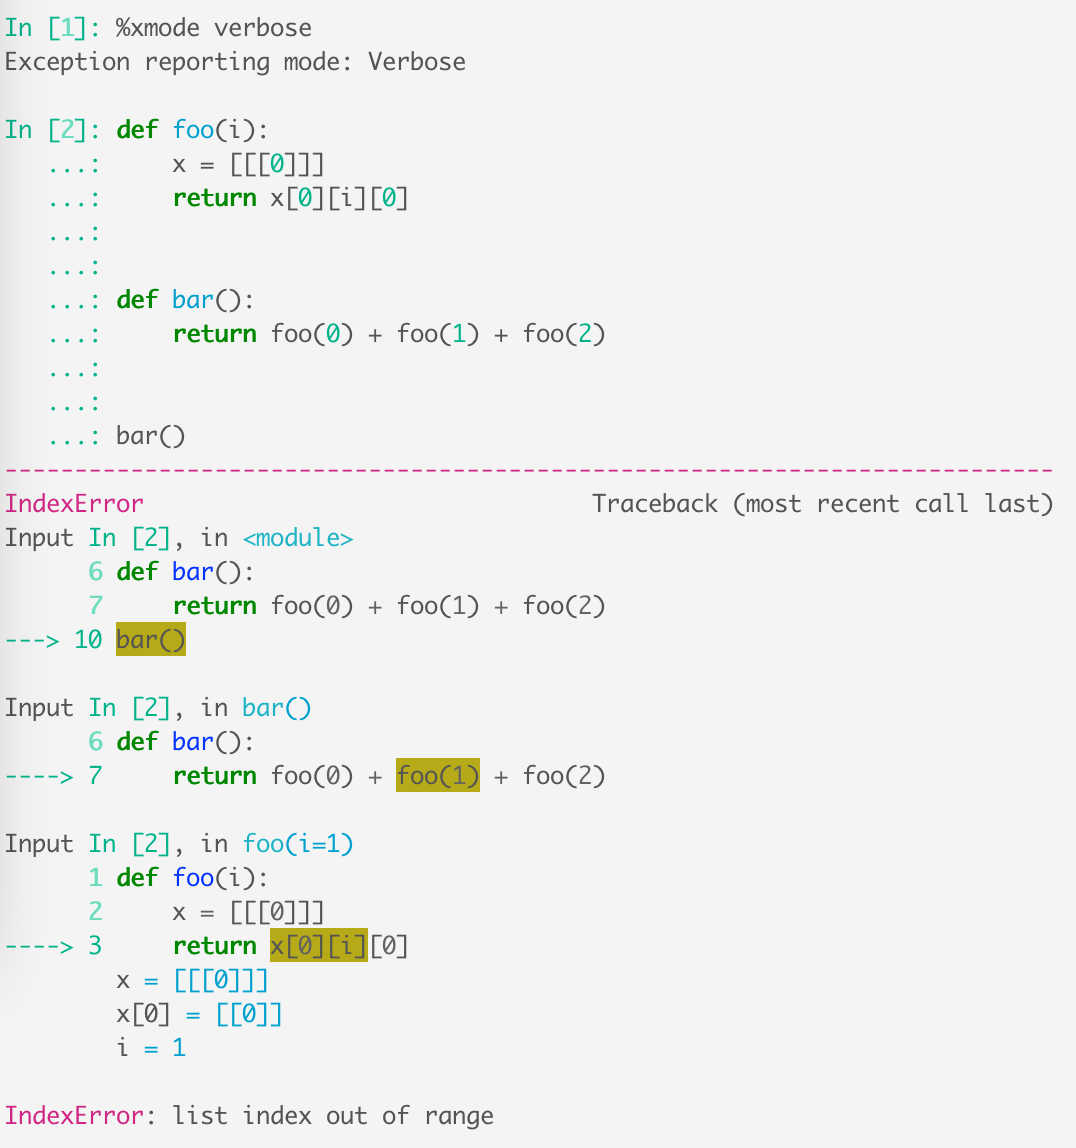
IPython is a powerful Python REPL that gives you tab completion, better tracebacks, multiline editing, and several useful features on top…
tags: pandas, python
various tips and tricks.
tags: books, python
tags: pdfs, programming, python

This article is a comprehensive overview of different open-source tools to extract text and tabular data from PDF Files
tags: csv, machine-learning, pandas, python
Master usecols, chunksize, parse_dates in pandas read_csv().
tags: machine-learning, python
Here is my take on this cool Python library and why you should give it a try
tags: dimentionality-reduction, machine-learning, python
Dimensionality reduction is a vital tool for data scientists across industries. Here is a guide to getting started with it.
tags: machine-learning, programming, python
In this first post in a series on how to build a complete machine learning product from scratch, I describe how to setup your project and tooling.
tags: distributions, prob-stats, python, scipy

How to Model random Processes with Distributions and Fit them to Observational Data
tags: programming, python
Source code: Lib/functools.py The functools module is for higher-order functions: functions that act on or return other functions. In general, any callable object can be treated as a function for t...
tags: python
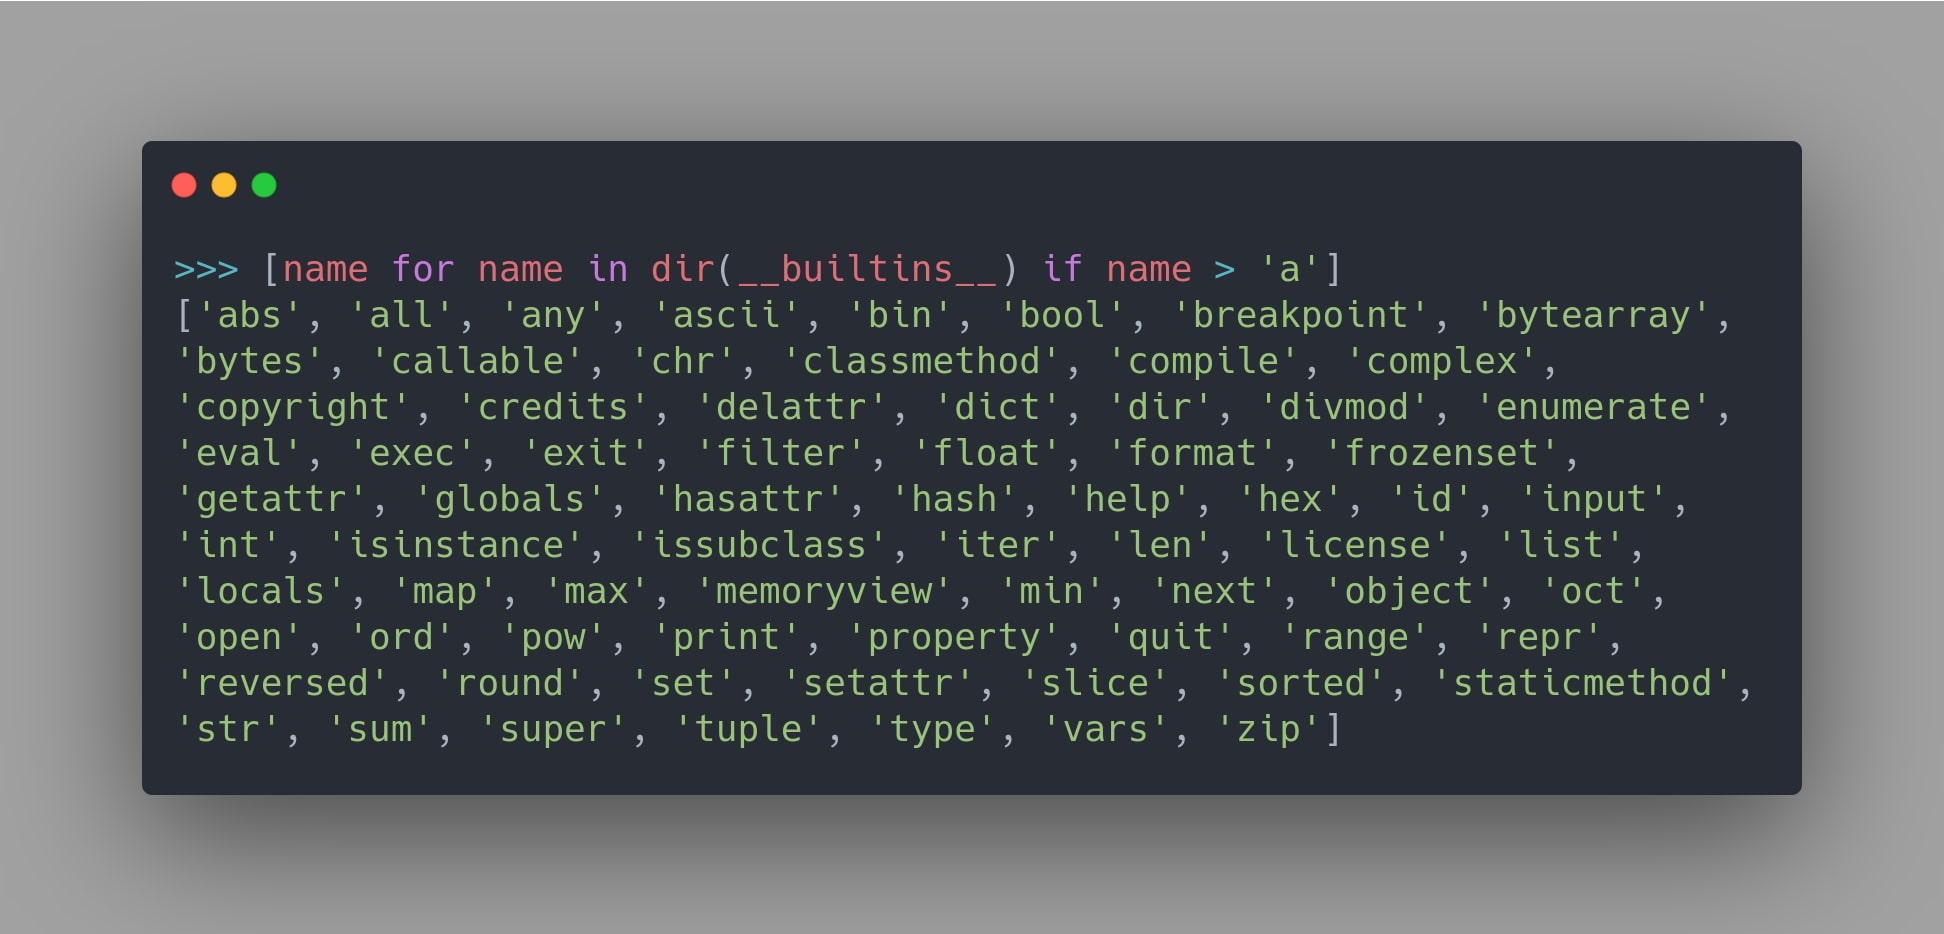
Python has a whole lot of builtins that are unknown to most people. This guide aims to introduce you to everything that Python has to offer, through its seemingly obscure builtins.
tags: python, streamlit
Create, deploy, and test your Python applications, analyses, and models with ease using Streamlit Key Features Learn how to showcase machine learning models in a Streamlit application effectively and efficiently … - Selection from Getting Started with Streamlit for Data Science [Book]
tags: python

Why, when, and how — Learn assert statements in Python right now.
tags: machine-learning, pycaret, python
Low-code Machine Learning with a Powerful Python Library
tags: machine-learning, programming, python, streamlit
Streamlit releases v1.0 of its DataOps platform for data science apps to make it easier for data scientists to share code and components.
tags: algorithms-math, github, python
All Algorithms implemented in Python.
tags: heroku, python, streamlit

Hello everyone, This is a step by step tutorial about how to deploy your Streamlit app to Heroku. ...
tags: heroku, mongodb, python, streamlit
An aspiring Full Stack Developer’s guide to quickly developing and deploying scalable web applications
tags: machine-learning, python, regressions, scikit-learn
Hands-on tutorial to effectively use different Regression Algorithms
tags: dask, python

This article is the second article of an ongoing series on using Dask in practice. Each article in this series will be simple enough for beginners, but provide useful tips for real work. The first article in the series is about using LocalCluster.
tags: pdfs, programming, python
Leveraging automation to create dazzling PDF documents effortlessly
tags: python, scikit-learn
For a short description of the main highlights of the release, please refer to Release Highlights for scikit-learn 1.0. Legend for changelogs something big that you couldn’t do before., something t...
tags: programming, python, regexes, web-scraping
tags: github, python
Just a place to store cheatsheets.
tags: command-line, pandas, programming, python

Quick Python solutions to help your data science cycle.
tags: programming, python

In this article, I will introduce you to a tutorial on the Python Imaging Library. Learn how to use Python Imaging Library or PIL.
tags: geofencing, python

Taking Advantage of Your Location Data for an Expansive Range of Possibilities
tags: machine-learning, machine-vision, python
OpenCV is not the only one
tags: machine-learning, python, scikit-learn
Intel(R) Extension for Scikit-learn is a seamless way to speed up your Scikit-learn application.
tags: biology, deep-learning, programming, python, visualization
tags: algorithms-math, python
How does a generator in Python work?
tags: command-line, pip, programming, python

Exploring some of the most useful pip commands for everyday programming
tags: pytest, python
Passing Arguments to Fixtures and Test Functions
tags: python
There are lots of great Python libraries, but most of them don't come close to what built-in itertools and also
tags: decorators, python

Analyze, test, and re-use your code with little more than an @ symbol
tags: algorithms-math, machine-learning, python, survival-analysis
What companies can learn from employee turnover data
tags: python, storytelling
Facebook AI Research Sequence-to-Sequence Toolkit written in Python. - facebookresearch/fairseq
tags: excel, machine-learning, pandas, python, supply-chain
In this article, I’ll show you five ways to load data in Python. Achieving a speedup of 3 orders of magnitude.
tags: algorithms-math, glossaries, python
All Algorithms implemented in Python.
tags: excel, programming, python, streamlit
Present your data as an interactive dashboard web application using the python library Streamlit
tags: linear-algebra, python, pytorch
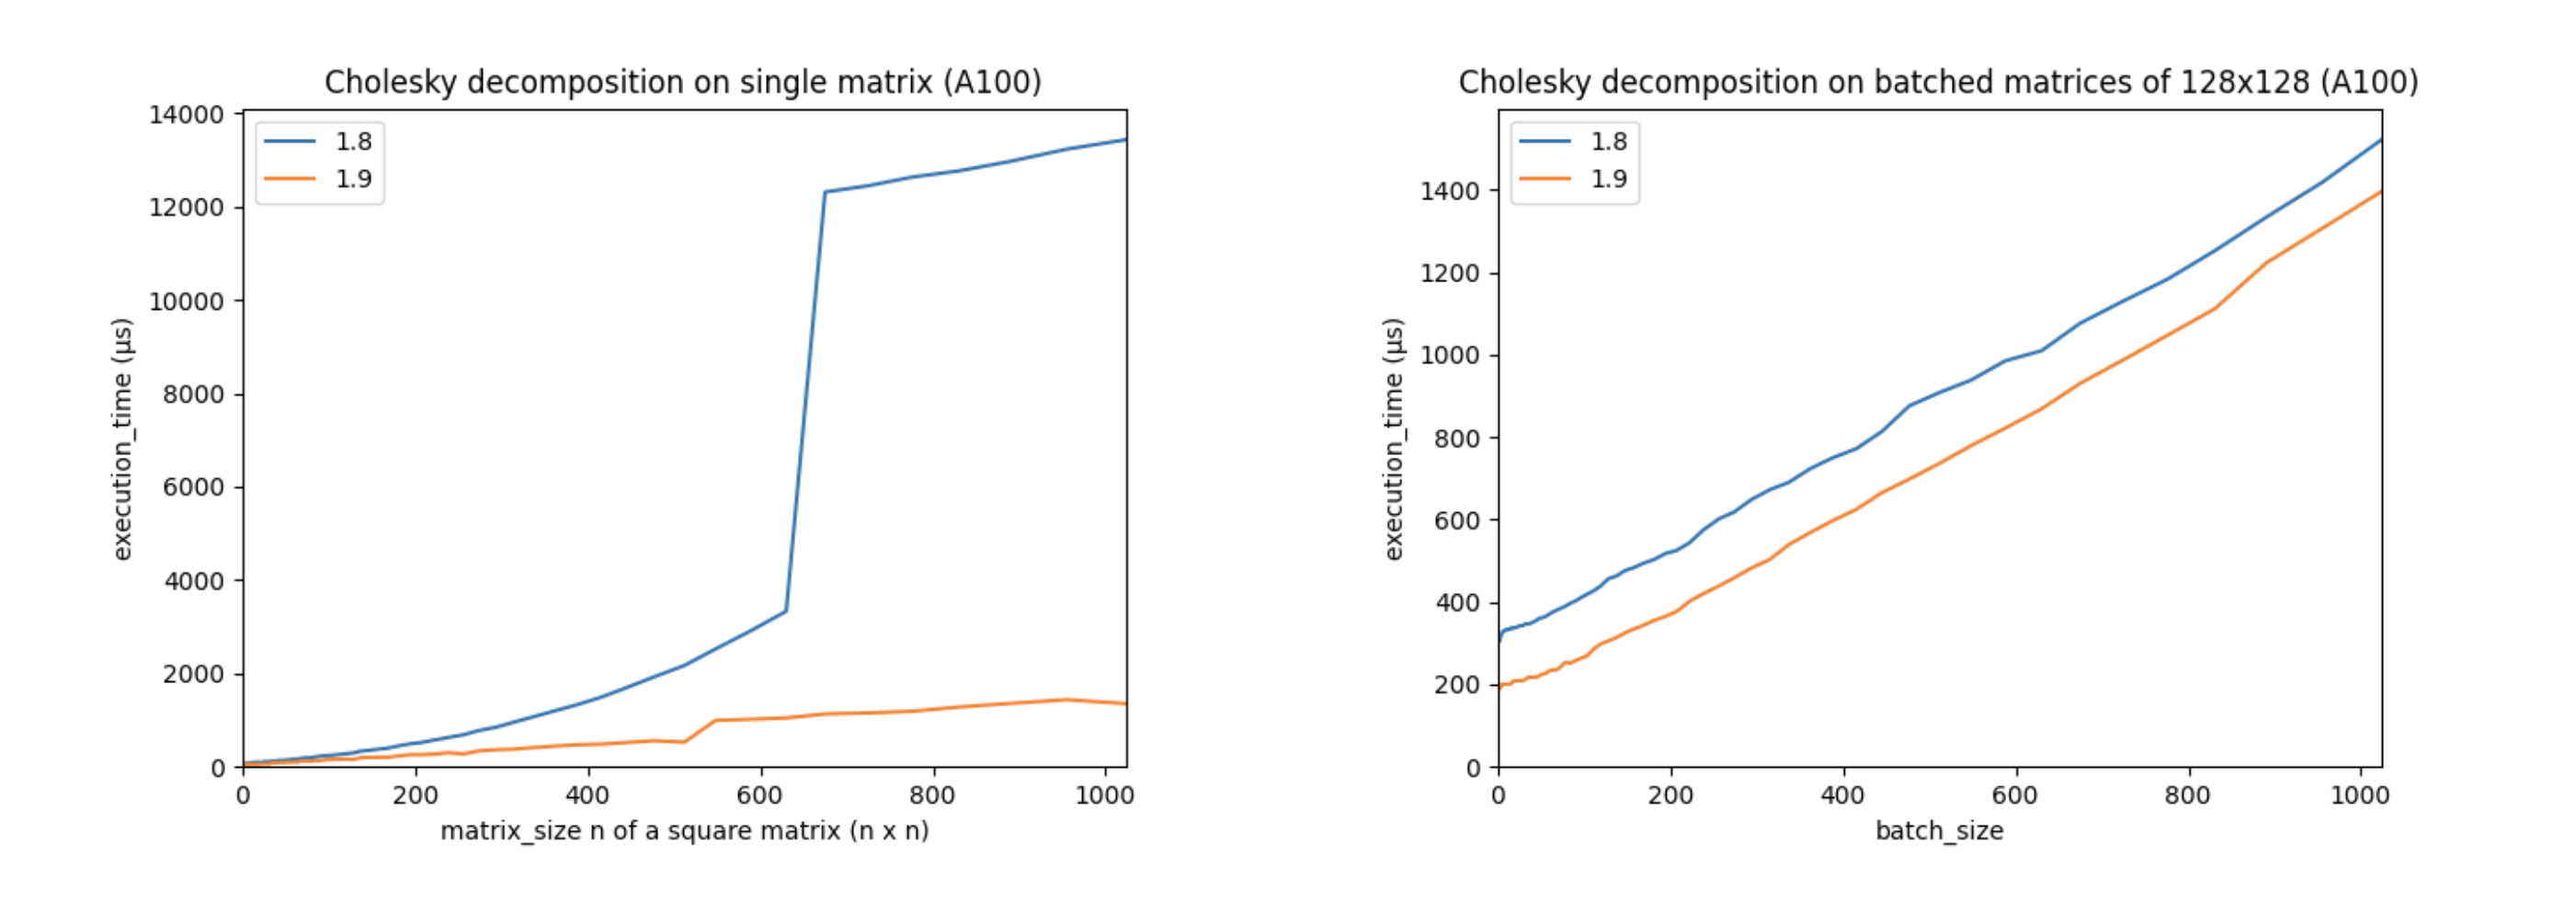
Linear algebra is essential to deep learning and scientific computing, and it’s always been a core part of PyTorch. PyTorch 1.9 extends PyTorch’s support for linear algebra operations with the torch.linalg module. This module, documented here, has 26 operators, including faster and easier to use versions of older PyTorch operators, every function from NumPy’s linear algebra module extended with accelerator and autograd support, and a few operators that are completely new. This makes the torch.linalg immediately familiar to NumPy users and an exciting update to PyTorch’s linear algebra support.
tags: boosting, gaussian, machine-learning, python
Combining tree-boosting with Gaussian process and mixed effects models - fabsig/GPBoost
tags: bitcoin, python
Musings of a Computer Scientist.
tags: deep-learning, python, pytorch

We’re on a journey to advance and democratize artificial intelligence through open source and open science.
tags: python

In this post, we will understand how python functional programming can be used efficiently to achieve tasks artistically as it is rightly said programming is indeed an art. We prefer using higher-order functions than simply looping because internally these are implemented in C making them more effic
tags: programming, python

Automate your Python script execution — works on Linux and macOS.
tags: programming, python
A deep dive into Python virtual environments, pip and avoiding entangled dependencies
tags: python
Set your application secrets, load, and retrieve them easily in your Data Science apps.
tags: dash, programming, python

Draw with Plotly, Embed Bootstrap CSS, Upload & Download files, Change Inputs after selection, Navbars, Spinners, and more…
tags: programming, python, streamlit

Using Streamlit to Build an ML-based Web Application
tags: matplotlib, python, seaborn, visualization
Should you bypass Matplotlib?
tags: python

In a real-life factory, the production of identical or similar objects is not done individually but rather streamlined in assembly lines. Similarly, the factory design pattern allows you to create…
tags: pandas, python
Learn how to speed up your Pandas workflow using the PyPolars library.
tags: machine-learning, python, visualization
Scroll down to see how to interpret a plot created by a great tool for comparing two classes and their corpora.
tags: dask, pandas, python

Are you a Data Scientist experienced with Pandas? Then you know its pain points. There's an easy solution - Dask - which enables you to run Pandas computations in parallel.
tags: python
If you are a beginning Python programmer, you might come across function declarations with parameters that look like this: The * and the ** operators above allow you to pass in variable number of…
tags: finance, python

To be honest, the title of the article does quite a good job in describing what Quantra actually is. It’s a platform that helps potential students with their journey of learning about quantitative…
tags: opencv, python

In this tutorial, I will show you how to give a cartoon-effect to an image in Python with OpenCV. Op...
tags: prodmgmt, pycaret, python

A step-by-step guide on how to predict customer churn the right way using PyCaret that actually optimizes the business objective and improves ROI for the business.
tags: python

In this post, I show you a real-life example of how to create, handle and log exceptions effectively in Python.
tags: deep-learning, python, pytorch, video
tags: datasets, python, web-scraping

In this article, I'm going to walk you through a tutorial on web scraping to create a dataset using Python and BeautifulSoup.
tags: matplotlib, python, visualization
Publication-quality data representation library based on Matplotlib. - alopezrivera/mpl_plotter
tags: machine-learning, python, pytorch
Word on the street is that PyTorch lightning is a much better version of normal PyTorch. But what could it possibly have that it brought such consensus in our world? Well, it helps researchers scale…
tags: pandas, python, vaex
If you are working with big data, especially on your local machine, then learning the basics of Vaex, a Python library that enables the fast processing of large datasets, will provide you with a productive alternative to Pandas.
tags: deep-learning, machine-vision, programming, python

Computer vision is the field of computer science that focuses on replicating parts of the complexity...
tags: bash, linux, python
Commandline one liners that makes your workflow more productive
tags: machine-learning, prophet, python, time-series
Prophet is a forecasting procedure implemented in R and Python. It is fast and provides completely automated forecasts that can be tuned by hand by data scientists and analysts.
tags: python, spatial, visualization

I recently wrote a post about visualizing weather data from NOAA. We walked through processing the data and making some basic interactive maps with Plotly. In this article I want to use the same data…
tags: python, streamlit

Sometimes you make a data science , machine learning or computer vision projects but suddenly you stu...
tags: dask, programming, python

This article will first address what makes Dask special and then explain in more detail how Dask works. So: what makes Dask special? Python has a rich ecosystem of data science libraries including…
tags: python, sql, sqlite

To explore SQLite along with Python, which is a user-friendly and no-nonsense language, we are going...
tags: cellular-automata, python

Automation epitomizes the last few decades of rapid technological development where many processes take place without human intervention. But what exactly does it mean? These are the two most common…
tags: pandas, python

Pandas is a data analysis and manipulation library for Python. It is one of the most popular tools among data scientists and analysts. Pandas can handle an entire data analytics pipeline. It provides…
tags: machine-learning, programming, python
As Data Science continues to grow and develop, it’s only natural for new tools to emerge, especially considering the fact that data…
tags: machine-learning, python, scikit-learn
If you are dealing with a classification task, I recommend the modAL. As for the sequence labeling task, the AlpacaTag is the only choice for you. Active learning could decrease the number of labels…
tags: geography, pandas, python
Part 1: Introduction to geospatial concepts (follow here) Part 2: Geospatial visualization and geometry creation (follow here) Part 3: Geospatial operations (this post) Part 4: Building geospatial…
tags: numpy, python
How to stack your array horizontally and vertically, find unique values, split your array and some more tips to use Numpy effectively.
tags: machine-learning, pycaret, python, time-series
PyCaret is an alternate low-code library that can be used to replace hundreds of lines of code with few lines only. See how to use PyCaret's Regression Module for Time Series Forecasting.
tags: music, python
A basic introduction to Western music theory using the Python programming language to derive scales, chords, and modes in every key.
tags: excel, programming, python
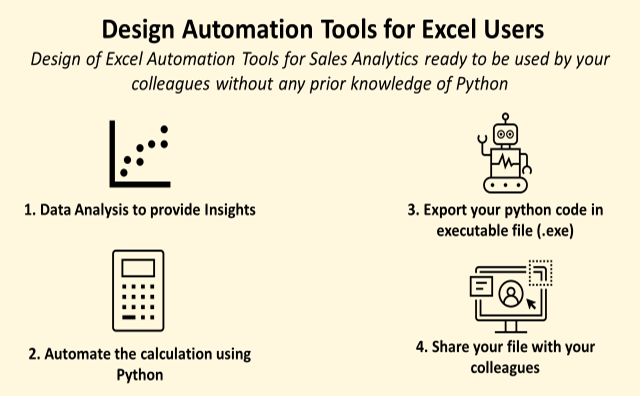
Design of Excel Automation Tools for Sales Analytics ready to be used by your colleagues without any prior knowledge of Python
tags: pdfs, programming, python

How to extract and convert tables from PDFs into Pandas Dataframe using Camelot
tags: python

Explained with examples
tags: boosting, machine-learning, python
XGBoost explained as well as gradient boosting method and HP tuning by building your own gradient boosting library for decision trees.
tags: numpy, python, pytorch
A bug that plagues thousands of open-source ML projects.
tags: gpus, nvidia, python

This post is the seventh installment of the series of articles on the RAPIDS ecosystem. The series explores and discusses various aspects of RAPIDS that allow its users solve ETL (Extract, Transform…
tags: python

A quick look at an easy way to make Python faster and more effective for machine-learning by using the itertools module.
tags: pandas, python

A quick tutorial to drop duplicates using the Python Pandas library.
tags: keywords-ppc-seo, python, search
Full-text search is everywhere. From finding a book on Scribd, a movie on Netflix, toilet paper on Amazon, or anything else on the web through Google (like [how to do your job as a software engineer](https://localghost.dev/2019/09/everything-i-googled-in-a-week-as-a-professional-software-engineer/)), you've searched vast amounts of unstructured data multiple times today. What's even more amazing, is that you've even though you searched millions (or [billions](https://www.worldwidewebsize.com/)) of records, you got a response in milliseconds. In this post, we are going to build a basic full-text search engine that can search across millions of documents and rank them according to their relevance to the query in milliseconds, in less than 150 lines of code!
tags: boosting, machine-learning, python
GPU vs CPU training speed comparison for xgboost
tags: pandas, python
No need to install, import and initialize — Just use them
tags: jupyter, machine-learning, python
for beginners as well as advanced users
tags: pandas, python

Pandas tips and tricks to help you get started with data analysis
tags: pandas, python

A comprehensive practical guide
tags: python

Photo by Divide By Zero on Unsplash There are a ton of awesome packages available in the Python ecos...
tags: machine-learning, pycaret, python
Train, visualize, evaluate, interpret, and deploy models with minimal code.
tags: pandas, python
Groupby is so powerful, which may sound daunting to beginners, but you don’t have to know all of its features.
tags: jupyter, python

JupyterLab moves closer to becoming a full-fledged IDE with xeus-python.
tags: machine-learning, optimization, python
Simple and reliable optimization with local, global, population-based and sequential techniques in numerical discrete search spaces. - SimonBlanke/Gradient-Free-Optimizers
tags: analytics, dask, pandas, python, vaex
Pandas doesn’t handle well Big Data. These two libraries do! Which one is better? Faster?
tags: machine-learning, programming, pycaret, python
tags: machine-learning, programming, pycaret, python
[et_pb_section fb_built=”1″ admin_label=”Header” _builder_version=”4.12.0″ background_color=”#01012C” collapsed=”on” global_colors_info=”{}”][et_pb_row column_structure=”1_2,1_2″ _builder_version=”4.12.0″ collapsed=”on” global_colors_info=”{}”][et_pb_column type=”1_2″ _builder_version=”4.12.0″ z_index=”10″ custom_padding=”18%||||false|false” global_colors_info=”{}”][et_pb_text _builder_version=”4.14.7″ text_font=”Montserrat|800|||||||” text_text_color=”#01012C” text_font_size=”470px” text_line_height=”1em” positioning=”absolute” custom_margin=”|-30%||-10%|false|false” custom_margin_tablet=”|0%||-5%|false|false” custom_margin_phone=”|0%|||false|false” custom_margin_last_edited=”on|desktop” text_font_size_tablet=”40vw” text_font_size_phone=”40vw” text_font_size_last_edited=”on|tablet” text_text_shadow_style=”preset5″ text_text_shadow_horizontal_length=”-1.5px” text_text_shadow_vertical_length=”-1.5px” text_text_shadow_color=”#DB0EB7″ global_colors_info=”{}”] pc [/et_pb_text][et_pb_text _builder_version=”4.14.7″ header_font=”Barlow Condensed|500|||||||” header_text_color=”#FFFFFF” header_font_size=”122px” custom_margin=”||0px||false|false” header_font_size_tablet=”42px” header_font_size_phone=”26px” header_font_size_last_edited=”on|tablet” global_colors_info=”{}”] low-code machine learning [/et_pb_text][et_pb_button button_url=”https://pycaret.gitbook.io” url_new_window=”on” button_text=”GET STARTED” _builder_version=”4.14.7″ […]
tags: machine-learning, python, survival-analysis
Concluding this three-part series covering a step-by-step review of statistical survival analysis, we look at a detailed example implementing the Kaplan-Meier fitter based on different groups, a Log-Rank test, and Cox Regression, all with examples and shared code.
tags: a-b, analytics, python

Optimizing web marketing strategies through statistical testing
tags: a-b, analytics, python
A/B Testing — A complete guide to statistical testing - bjpcjp/AB_Testing
tags: graphs, machine-learning, python
A comprehensive guide on standard generative graph approaches with implementation in NetworkX
tags: python

The essential for Python in tasks automation apps
tags: image-segmentation, machine-vision, python, scikit-image

How to use the Gaussian Distribution for Image Segmentation
tags: images, python, scikit-image

How to identify similar objects in your image
tags: images, machine-learning, python, scikit-image
How to identify and segregate specific blobs in your image
tags: kern, machine-learning, python, svm
A complete explanation of the inner workings of Support Vector Machines (SVM) and Radial Basis Function (RBF) kernel
tags: pdfs, python, visualization

Create PDF reports with beautiful visualizations in 10 minutes or less.
tags: python

Essential guide to multiprocessing with Python.
tags: machine-learning, python, scikit-learn
An Overview of the Most Important Features in Version 0.24
tags: python

Go beyond the usual
tags: images, python, scikit-image

How do you apply convolution kernels to colored images?
tags: analytics, python

Uplift models seek to predict the incremental value attained in response to a treatment. For example, if we want to know the value of showing an advertisement to someone, typical response models will only tell us that a person is likely to purchase after being given an advertisement, though they may have been likely to purchase already. Uplift models will predict how much more likely they are to purchase after being shown the ad. The most scalable uplift modeling packages to date are theoretically rigorous, but, in practice, they can be prohibitively slow. We have written a Python package, pylift, that implements a transformative method wrapped around scikit-learn to allow for (1) quick implementation of uplift, (2) rigorous uplift evaluation, and (3) an extensible python-based framework for future uplift method implementations.
tags: images, python, scikit-image

A deeper look into the fundamentals of image dilation and erosion with the use of kernels.
tags: analytics, python, visualization

A heatmap is a graphical representation of data in which data values are represented as colors. That is, it uses color in order to…
tags: algorithms-math, python

The string matching problem also known as “the needle in a haystack” is one of the classics. This simple problem has a lot of application…
tags: algorithms-math, machine-learning, optimization, python
Demystifying the inner workings of BFGS optimization
tags: python

There are so many amazing Python libraries out there that it's hard to keep track of all of them. That's why we share with you our hand-picked selection of some top libraries.
tags: devops, python
Source code: Lib/shutil.py The shutil module offers a number of high-level operations on files and collections of files. In particular, functions are provided which support file copying and removal...
tags: azure, devops, flask, python

Get started with Azure App Service by deploying your first Python app to Azure App Service.
tags: gifs, images, python
A visual analysis of Brazilian Higher Education history
tags: python, supply-chain
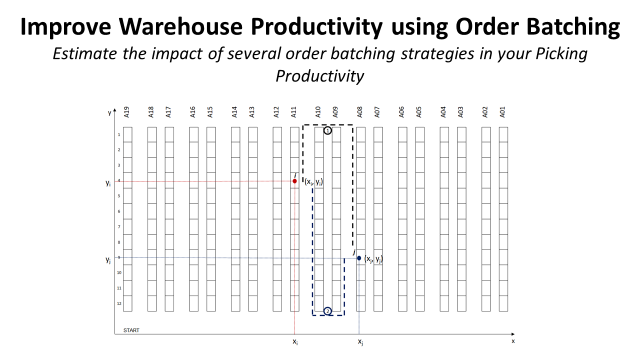
Design a simulation model to estimate the impact of several Single Picker Routing Problem strategies in your Picking Productivity
tags: prophet, python

Using Prophet to forecast commodity prices
tags: graphs, machine-learning, python
A simple introduction to matching in bipartite graphs with Python code examples
tags: python

This article was written by Louis Tiao. In this series of notebooks, we demonstrate some useful patterns and recipes for visualizing animating optimization algorithms using Matplotlib. We shall restrict our attention to 3-dimensional problems for right now (i.e. optimizing over only 2 parameters), though what follows can be extended to higher dimensions… Read More »Visualizing and Animating Optimization Algorithms with Matplotlib
tags: flask, linux, python

In this article we'll discuss how to install Flask on Ubuntu 20.04 inside a Python virtual environment.
tags: python

Color transfer, Image editing and Automatic Translation
tags: python, visualization

Learn to Develop Choropleth Map Easily Using Python’s Folium Library
tags: python, visualization

Create stunning visualizations for Pandas DataFrames
tags: python
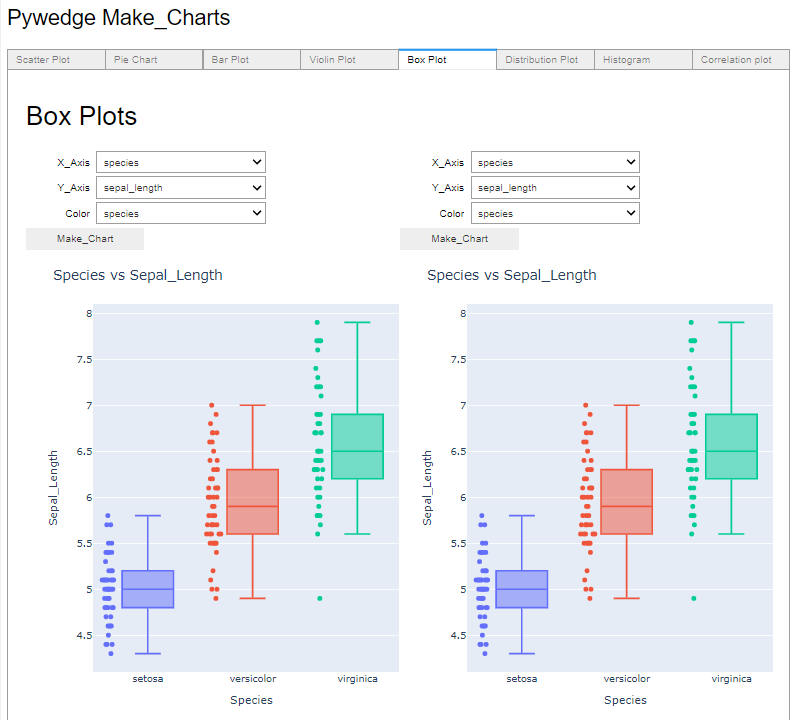
Pywedge helps in visualizing the data, preprocessing, and creating baseline models
tags: numpy, python

NumPy forms the basis of many Python libraries in the data science domain.
tags: monte-carlo, python
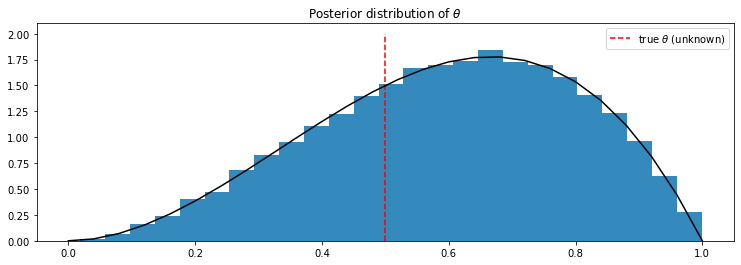
An introduction to PyMC3 through a concrete example
tags: python
A brief introduction to Python’s Peephole optimization technique
tags: cpp, programming, python, ruby

Find static code analysis tools and linters for Java, JavaScript, PHP, Python, Ruby, C/C++, C#, Go, Swift, and more. All tools and linters are peer-reviewed by fellow developers to select the best tools available. Avoid bugs in production, outages on weekends, and angry customers.
tags: python
Understand Python’s optimization technique — Interning.
tags: python
Curly brace scopes, autovivification, and other methods for writing better code
tags: python, time-series

Finding Conserved Patterns Across Two Time Series
tags: decorators, python
Let’s master the more advanced topics in no-time
tags: machine-learning, python, speech-recognition
Learn which of the 9 most prominent automatic speech recognition engines is best for your needs, and how to use it in Python programs.
tags: machine-learning, pandas, python
Explained with examples
tags: pyspark, python
Performing Data Visualization using PySpark
tags: python, venv
A nice thing about Python is that there is tons of modules available out there. Not all those modules are readily available for your distro and even if there were, chances are that a newer release with new features is already out there.
tags: python

Asyncio helps you to write asynchronous functions using python making your application a lot faster with better user experience with its easy to use syntax.
tags: geography, python
Geometric Algebra for Python.
tags: numba, python

A quick look at a fantastic tool for making Python better in 2020.
tags: python

In a previous post, I created a guide for JavaScript higher-order functions to make dealing with arra...
tags: machine-learning, python, vision
A step-by-step guide to apply perspective transformation on images
tags: python
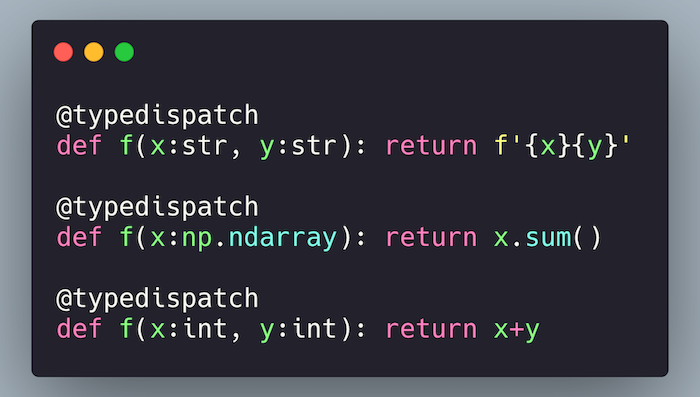
A unique python library that extends the python programming language and provides utilities that enhance productivity.
tags: python
How you could use defaultdict and Counter to make your code short and readable
tags: cpython, python
In the first post of the series we've looked at the CPython VM. We've learned that it works by executing a series of instructions called bytecode....
tags: python
Let’s look at the performance of our Python programs and see how to make them up to 30% faster!
tags: flask, heroku, python, reactjs
Making a Framework for API Development and Deployment
tags: machine-learning, python
I come from the world of MATLAB and numerical computing, where for loops are shorn and vectors are king. During my PhD at UVM, Professor…
tags: python

A Comprehensive Guide to Pytest for your Data Science Projects
tags: machine-learning, python
A tour of one of the most popular topic modelling techniques and a guide to implementing and visualising it using pyLDAvis
tags: geography, python
How to easily and effectively incorporate spatial features in Python using Geopandas
tags: databases, python

How to manage external resources in Python with your custom context managers
tags: dask, pandas, python
Scaling your Pythonic data science and machine learning to the cloud using Dask. All from the comfort of your own laptop.
tags: plotly, python, visualization

I have been working as a Data Analyst for almost 5 years now but, in this time I have mostly used business intelligence software for all…
tags: geography, python
How to use GeoPandas and Leaflet?
tags: machine-learning, python
Python 3.9 New Feature Guide
tags: pandas, python
tags: dask, python

A simple solution for data analytics for big data parallelizing computation in Numpy, Pandas, and Scikit-Learn Frameworks.
tags: cython, python

This article was originally published on the Paperspace blog. You can run the code for my tutorials for free on Gradient.
tags: python
How to make CPython faster.
tags: movies-television, python

A look into how Python is used to bring your favorite movies to the big screen.
tags: pdfs, python
A quick guide for extracting the tables from PDF files in Python using Camelot library
tags: python
Top 3 Excel-Python integration methods and what you can do with them
tags: pandas, python

Explained with examples.
tags: python, pytorch
As the ever-growing demand for deep learning continues to rise, more developers and data scientists are joining the deep-learning…
tags: machine-learning, python
Overview of the latest developments in version 0.23
tags: python
As a Data Scientist, you are already spending most of your time getting your data ready for prime time. Follow these real-world scenarios to learn how to leverage the advanced techniques in Python of list comprehension, Lambda expressions, and the Map function to get the job done faster.
tags: python

Enhance your data science project
tags: algorithms-math, python

We show how to emulate Brownian motion, the most famous stochastic process used in a wide range of applications, using simple Python code.
tags: python, visualization
Confused about which Visualization Tool to Use? I Broke Down the Pros and Cons of Each Libary for You
tags: python, seaborn, visualization

But really should know
tags: python
Master the Python Dictionary with these tips
tags: pandas, python

When and how to use which.
tags: pyspark, python

A short guide to the PySpark DataFrames API
tags: python

Compare good writing style and bad writing style with the code runtime
tags: python
Effectively merge an unknown number of lists
tags: python
Understand the basics with a concrete example!
tags: debugging, python
Even if you write clear and readable code, even if you cover your code with tests, even if you are very experienced developer, weird bugs will inevitab...
tags: pandas, python

Pandas: From Journeyman to Master — Voice from the victim.
tags: machine-learning, python
Do you know about these packages?
tags: python
with usage examples
tags: machine-learning, python
Not enough data for Deep Learning? Try Eigenfaces.
tags: python, visualization

Ultra high resolution satellite and elevation imagery
tags: datasets, python

A different approach to import data files automatically in python.
tags: python

Use Python to set your path towards it.
tags: machine-learning, nlp, python
Introduction
tags: flask, python

Hey guys this my first blog on Medium. This is an Iris classification ML model turned into a flask app for hosting on Heroku.
tags: python
A deep dive beginner’s guide into different python virtual environments, the benefits of each, and how to get started using them
tags: dask, pandas, python

Use Pandas with Dask to save time and resources. This combination will make your notebook ultra fast
tags: fonts-typography, python, visualization

A Picture is worth a thousand words. Literally! there are 2200+ words in this picture. 😱
tags: python
tags: machine-learning, programming, python
Check out these 5 cool Python libraries that the author has come across during an NLP project, and which have made their life easier.
tags: machine-learning, python
Building up the intuition for how matrices help to solve a system of linear equations and thus regressions problems

tags: python

Elegant, comfortable, concise, and fast way to build lists
tags: python, sets

Guidelines to use sets in Python
tags: machine-learning, python
Explaining outlier detection with PyCaret library in python
tags: feature-engineering, machine-learning, python
Recursive Feature Elimination, or RFE for short, is a popular feature selection algorithm. RFE is popular because it is easy to configure and use and because it is effective at selecting those features (columns) in a training dataset that are more or most relevant in predicting the target variable. There are two important configuration options when using RFE: the choice…
tags: concurrency, python
This is a quick guide to Python’s asyncio module and is based on Python version 3.8. Introduction Why focus on asyncio? A quick asyncio summary A quick concurrent.futures summary Green Threads? Event Loop Awaitables Coroutines Tasks Futures Running an asyncio program Running Async Code in the REPL Use another Event Loop Concurrent Functions Deprecated Functions Examples gather wait wait_for as_completed create_task Callbacks Pools Executors asyncio.Future vs concurrent.futures.Future asyncio.wrap_future Introduction So let’s start by addressing the elephant in the room: there are many modules provided by the Python standard library for handling asynchronous/concurrent/multiprocess code…
tags: python
A guide to modern Python tooling with a focus on simplicity and minimalism.
tags: pandas, python

Sample, where, isin explained in detail with examples.
tags: flask, python
tags: pandas, python

Clearly distinguish loc and iloc
tags: prodmgmt, python
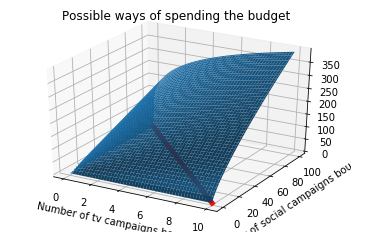
Lagrange Multiplier on a function with 2 variables with 1 equality constraint
tags: python, sqlite

Everything You Need to Get Started!
tags: python
Important list of 10 python snippets to make your code efficient
tags: pandas, python

This post will address the issues that can arise when Pandas slicing is used improperly. If you see the warning that reads "A value is trying to be set on a copy of a slice from a DataFrame", this post is for you.
tags: pandas, python
Know your Pandas library function arsenal as a data scientist
tags: numpy, python

A practical guide to modify the shape of arrays
tags: devops, machine-learning, pandas, python
This new Python package accelerates notebook-based machine learning experimentation
tags: algorithms-math, machine-learning, numpy, python
Using q-learning for sequential decision making and therefore learning to play a simple game.
tags: python

A basic guide to using Python to fit non-linear functions to experimental data points
tags: dask, python
The Pandas library for Python is a game-changer for data preparation. But, when the data gets big, really big, then your computer needs more help to efficiency handle all that data. Learn more about how to use Dask and follow a demo to scale up your Pandas to work with…
tags: machine-learning, pycaret, python
I came across Pycaret while I was browsing on a slack for data scientists. It's a versatile library in which you can apply/evaluate/tune…
tags: geography, python, visualization
A Walkthrough on Hyperspectral Image Analysis Using Python.
tags: python
How to linearize a quadratic function to use it in a linear solver, (a.k.a. I don’t have money to pay for Gurobi) using a retail example
tags: pyspark, python

Apache Spark is one of the hottest new trends in the technology domain. It is the framework with probably the highest potential to realize…
tags: pandas, python
A code-along guide for Pandas’ advanced functionalities.
tags: category-theory, python
Parts 1 and 2 are found here and here
tags: python
The right way to represent a finite set of alternatives
tags: geography, python

The ultimate guide on open source GIS tools for spatial analysis. Find the tools you need to support your next spatial data project!
tags: deep-learning, nlp, python

An Overview Of popular python libraries for Natural Language Processing
tags: django, python

Getting Started with Django
tags: command-line, python

A simple guide to create your own Python script with command line arguments
tags: python
I don’t know how I lived without them
tags: plotly, python, visualization

Most common baby names in Barcelona
tags: matplotlib, python, seaborn, visualization

In real life, data preprocessing is really a pain for most data scientists. But with the help of data visualization libraries, it actually…

tags: algorithms-math, machine-learning, numpy, python
Learn matrix multiplication for machine learning by following along with Python examples
tags: pandas, python

Understanding the Groupby Method
tags: machine-learning, pandas, python
How does pivot work? What is the main pandas building block? And more …
tags: matplotlib, python, visualization

What if you can create a scatter plot for categorical features?
tags: geography, python

Tutorial — Triggering notifications and Nudging GPS locations from users.
tags: python, vision

Learn the basics of working with RGB and Lab images to boost your computer vision projects!
tags: machine-learning, pandas, python
5 lesser-known pandas tricks that help you be more productive
tags: pandas, python
In this post, we’ll go over how to write DataFrames to CSV files.
tags: python, seaborn, visualization
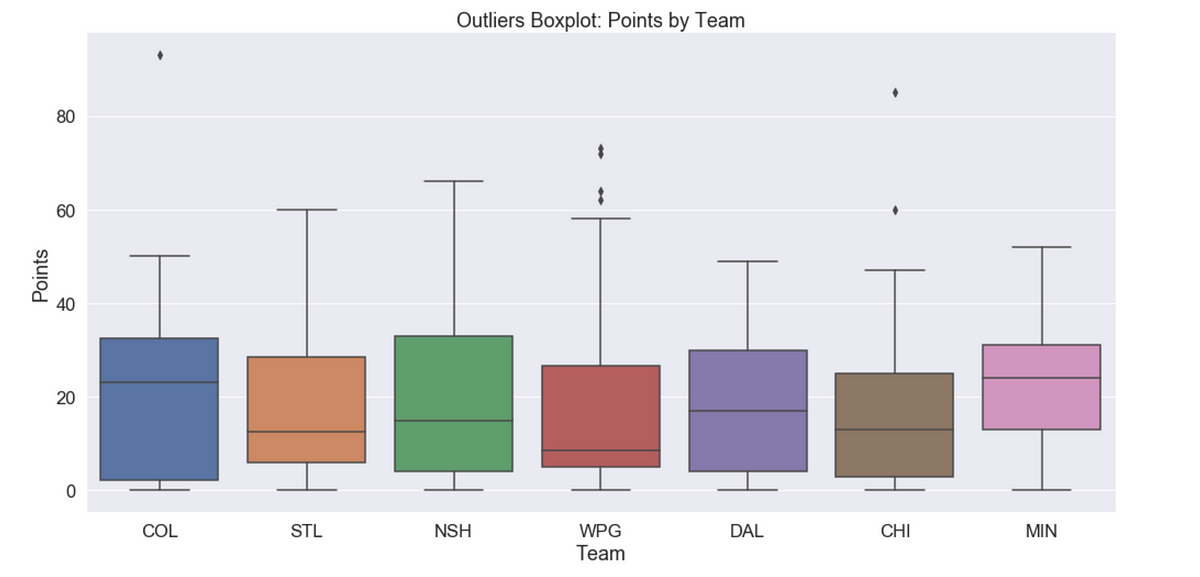
A walkthrough of many Seaborn tools using NHL Statistics
tags: monte-carlo, python

Learn Monte Carlo Methods with three simple examples
tags: machine-learning, python
https://github.com/sepandhaghighi/pycm https://www.pycm.ir custom_rounder function added #279 complement function added sparse_matrix attribute added…
tags: machine-learning, pandas, python
Extract data from different sources
tags: machine-learning, pandas, python
Expedite your data analysis process
tags: machine-learning, python
Why and How to use with examples of Keras/XGBoost
tags: python
tags: python

with usage examples
tags: numpy, python

NumPy is the universal standard for working with Numerical data in Python. Multidimensional NumPy arrays are extensively used in Pandas…
tags: postgres, python
In this tutorial, you will learn how to connect to the PostgreSQL database server from Python using the psycopg2 package.
tags: numpy, python
The ones not covered in every How-to Guide
tags: pandas, python
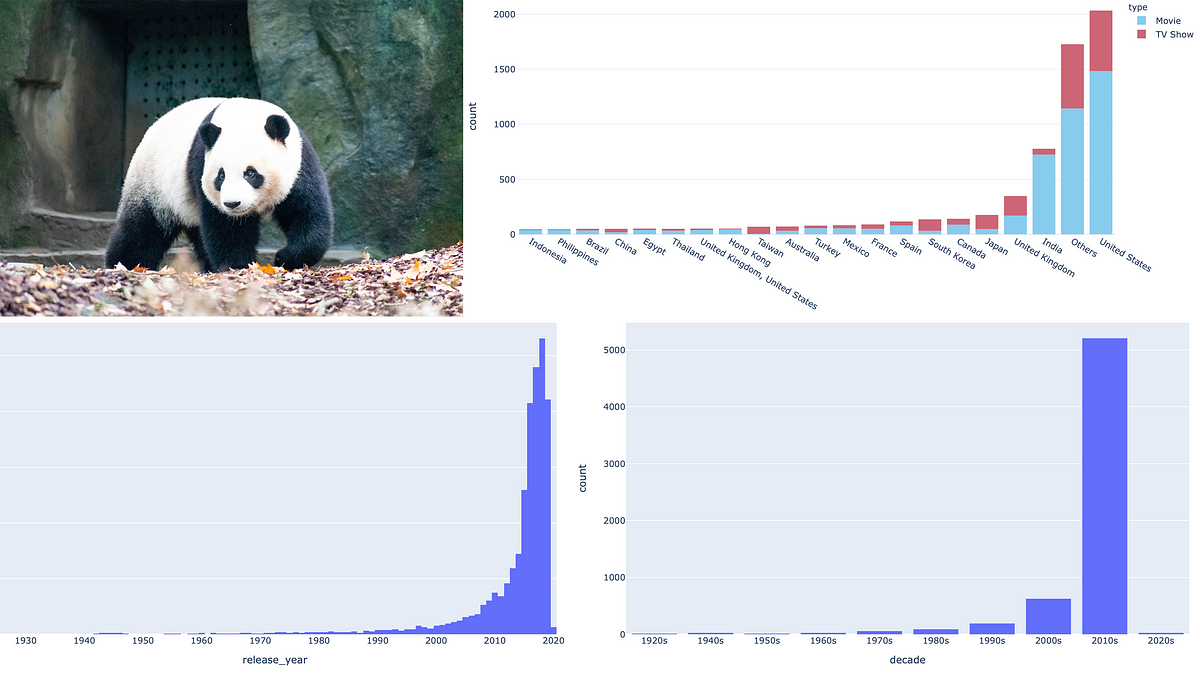
Master these pandas functions (and methods) to shorten your code, improve performance and avoid headaches.
tags: python
As a Data Scientist
tags: decorators, python

Learn how you can change the behavior of objce
tags: python
Cleaner Code and Fewer Loops? Count me in.
tags: python
Learn about the advanced features the requests library hides under the hood. DRY base URLs, hooks, retry on failure, default timeouts and mocking.
tags: pandas, python
These mistakes are super common, and super easy to fix.
tags: python, regexes

"The Ultimate Guide to using the Python regex module" https://lttr.ai/Nt5c #regex #Python #datascience #nlp
tags: python

Accelerate Your Requests Using asyncio
tags: dsp, python

If you have ever heard Python and Fourier nouns, chances are you’ll find this post useful: here I will explore a simple way to implement…
tags: ocr, python, vision

Convert images to a string with Google Tesseract and then into a static HTML site using python
tags: numpy, pandas, python

Make your day to day life easier by using these functions in your analysis
tags: animation, python
Python has some great data visualization librairies, but few can render GIFs or video animations. This post shows how to use MoviePy as a generic …
tags: python
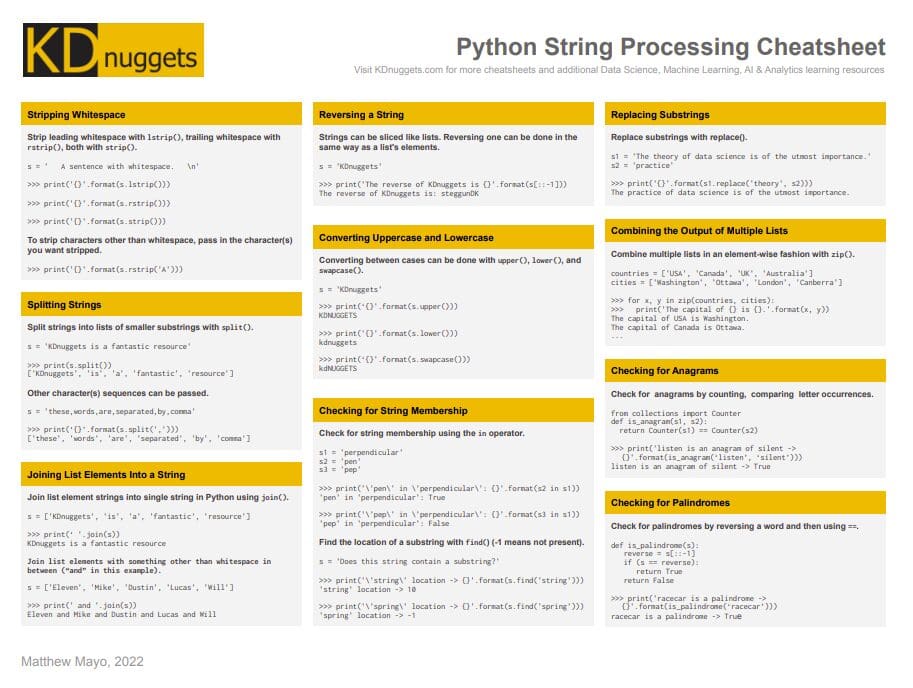
Try this string processing primer cheatsheet to gain an understanding of using Python to manipulate and process strings at a basic level.
tags: pandas, python

We show how to build intuitive and useful pipelines with Pandas DataFrame using a wonderful little library called pdpipe.
tags: python
Python haters always say, that one of reasons they don't want to use it, is that it's slow. Well, whether specific program - regardle...
tags: python
Check out this collection of 10 Python snippets that can be taken as a reference for your daily work.
tags: programming, python

Spend more time modeling, and less time managing infrastructures. A hands-on tutorial.
tags: python, scipy

Nature Methods - This Perspective describes the development and capabilities of SciPy 1.0, an open source scientific computing library for the Python programming language.
tags: html, python, web-scraping

A tutorial about a HTML parser for Python 3. Learn about the basic of a library for easily parsing web pages and extracting useful information.
tags: ocr, python

Dive deep into OCR with Tesseract, including Pytesseract integration, training with custom data, limitations, and comparisons with enterprise solutions.
tags: python
Brush up on your Python basics with this post on creating, using, and manipulating tuples.
tags: pandas, python
While Pandas is the library for data processing in Python, it isn't really built for speed. Learn more about the new library, Modin, developed to distribute Pandas' computation to speedup your data prep.
tags: python, semiconductor-memory

You can process data that doesn’t fit in memory by using four basic techniques: spending money, compression, chunking, and indexing.
tags: python, scikit-learn
In this post, learn how to extend Scikit-learn code to make your experiments easier to maintain and reproduce.
tags: pandas, python
The pandas library offers core functionality when preparing your data using Python. But, many don't go beyond the basics, so learn about these lesser-known advanced methods that will make handling your data easier and cleaner.
tags: cpus, python
On the Linux command line it is fairly easy to use the perf command to measure number of floating point operations (or other performance metrics). (See for example this old blog post ) with this approach it is not easy to get a fine grained view of how different stages of processings within a single process. In this short note I describe how the python-papi package can be used to measure the FLOP requirements of any section of a Python program.
tags: python
Editor, Raymond Hettinger,. This article explains the new features in Python 3.8, compared to 3.7. Python 3.8 was released on October 14, 2019. For full details, see the changelog. Summary – Releas...
tags: json, python

Introduction In the last year or two I have worked on and off on making PyPy's JSON faster, particularly when parsing large JSON files. I...
tags: python

Learn how to simplify your Python code using partial functions to create more flexible, reusable, and concise function calls
tags: python

This tutorial will give you a firm grasp of Python’s approach to async IO, which is a concurrent programming design that has received dedicated support in Python, evolving rapidly from Python 3.4 through 3.7 (and probably beyond).
tags: python, visualization
tags: pyspark, python
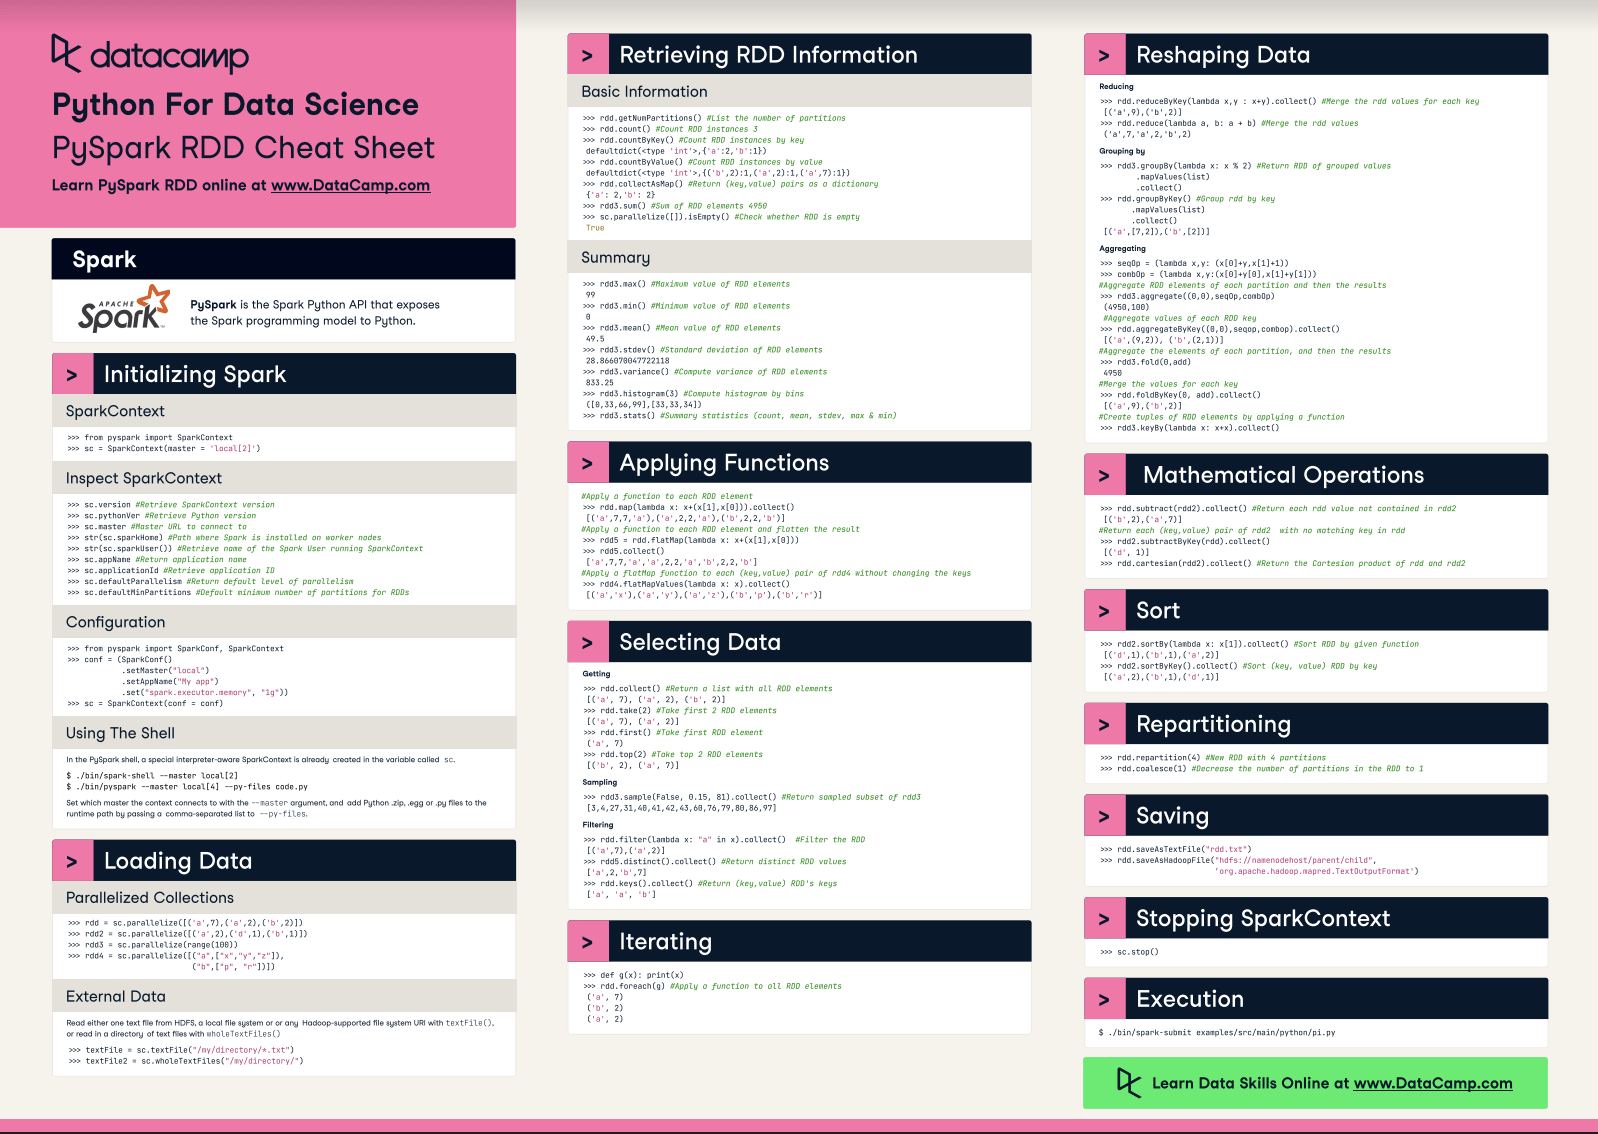
This PySpark cheat sheet with code samples covers the basics like initializing Spark in Python, loading data, sorting, and repartitioning.
tags: machine-learning, python, time-series
Using ARIMA model, you can forecast a time series using the series past values. In this post, we build an optimal ARIMA model from scratch and extend it to Seasonal ARIMA (SARIMA) and SARIMAX models. You will also see how to build autoarima models in python
tags: python

By Pythonistas at Netflix, coordinated by Amjith Ramanujam and edited by Ellen Livengood
tags: books, machine-learning, python
tags: pandas, python

This post is a part of my series on Python Shorts. Some tips on how to use python. This post is about using the computing power we have at hand and applying it to the data structure we use most.
tags: cpp, python
Did you know you can write functions in C and then call them directly from Python? Isn't that cool? L...
tags: cpp, cython, python
tags: machine-learning, python
A Python Library for Outlier and Anomaly Detection, Integrating Classical and Deep Learning Techniques - yzhao062/pyod
tags: python
This article lists some curated tips for working with Python and Jupyter Notebooks, covering topics such as easily profiling data, formatting code and output, debugging, and more. Hopefully you can find something useful within.
tags: cpp, cython, python
Build software that combines Python’s expressivity with the performance and control of C (and C++). It’s possible with Cython, the compiler and hybrid programming language used by foundational packages such … - Selection from Cython [Book]
tags: python
tags: flask, python

In recent years REST (REpresentational State Transfer) has emerged as the standard architectural design for web services and web APIs.In this article I'm going to show you how easy it is to create a…
tags: javascript, python

Something a lot of beginners struggle with is the concept of passing data between different programmi...
tags: python, visualization

Bokeh is a Python library for creating interactive visualizations for modern web browsers. It helps you build beautiful graphics, ranging from simple plots to complex dashboards with streaming data...
tags: python

A guided walkthrough of how to use the Prophet python library to solve a common forecasting problem.
tags: dash, programming, python, webdev

Create Reactive Web Apps in pure Python
tags: prob-stats, python

Quick-reference guide to the 17 statistical hypothesis tests that you need in applied machine learning, with sample code in Python. Although there are hundreds of statistical hypothesis tests that you could use, there is only a small subset that you may need to use in a machine learning project. In this post, you will discover a cheat sheet for the…
tags: python

When I discovered Python’s new pathlib module a few years ago, I initially wrote it off as being a slightly more awkward and unnecessarily …
tags: python

Profiling Python applications using Pyflame
tags: python
Here are the top 15 Python libraries across Data Science, Data Visualization. Deep Learning, and Machine Learning.
tags: python, visualization
Anaconda is the birthplace of Python data science. We are a movement of data scientists, data-driven enterprises, and open source communities.
tags: python
Simplified python article discovery & extraction.
tags: dimentionality-reduction, python

Learn how these 12 dimensionality reduction techniques can help you extract valuable patterns and insights from high-dimensional datasets.
tags: python

By Peter Gleeson Python is one of the world’s most popular, in-demand programming languages. This is for many reasons: it’s easy to learn it’s super versatile it has a huge range of modules and libraries I use Python daily as an integral part of my...
tags: nlp, python, spacy
A context-preserving word cloud generator.
tags: bayes, machine-learning, python
Recently I’ve started using PyMC3 for Bayesian modelling, and it’s an amazing piece of software! The API only exposes as much of heavy machinery of MCMC as you need — by which I mean, just the pm.sample() method (a.k.a., as Thomas Wiecki puts it, the Magic Inference Button™). This really frees up your mind to think about your data and model, which is really the heart and soul of data science! That being said however, I quickly realized that the water gets very deep very fast: I explored my data set, specified a hierarchical model that made sense to me, hit the Magic Inference Button™, and… uh, what now? I blinked at the angry red warnings the sampler spat out.
tags: feature-engineering, machine-learning, python
Using the FeatureSelector for efficient machine learning workflows
tags: machine-learning, python
Using mlxtend to perform market basket analysis on online retail data set.
tags: finance, python

Originally published at https://www.datacamp.com/community/tutorials/finance-python-trading
tags: prob-stats, python

During my years as a Consultant Data Scientist I have received many requests from my clients to provide frequency distribution
tags: algorithms-math, python
Last time we saw a geometric version of the algorithm to add points on elliptic curves. We went quite deep into the formal setting for it (projective space $ \mathbb{P}^2$), and we spent a lot of time talking about the right way to define the “zero” object in our elliptic curve so that our issues with vertical lines would disappear. With that understanding in mind we now finally turn to code, and write classes for curves and points and implement the addition algorithm.
tags: decorators, python

Python decorators are a useful but flawed language feature. Intended to make source code easier to write, and a little more readable, they neglect to address another use case: that of the programmer who will be calling the decorated code. If you’re a Python programmer, the following post will show you why decorators exist, and how to compensate for their limitations. And even if you’re not a Python a programmer, I hope to demonstrate the importance of keeping in mind all of the different audiences for the code you write.
tags: machine-learning, python
An easy-to-use library for recommender systems.
tags: cohorts, python

Discover 100 collaborative articles on domains such as Marketing, Public Administration, and Healthcare. Our expertly curated collection combines AI-generated content with insights and advice from industry experts, providing you with unique perspectives and up-to-date information on many skills and their applications.
tags: pandas, python
tags: gensim, nlp, python

Topic Modeling is a technique to understand and extract the hidden topics from large volumes of text. Latent Dirichlet Allocation(LDA) is an algorithm for topic modeling, which has excellent implementations in the Python's Gensim package. This tutorial tackles the problem of finding the optimal number of topics.
tags: python, visualization
tags: python
How do I import files in Python? I want to import: a file (e.g. file.py) a folder a file dynamically at runtime, based on user input one specific part of a file (e.g. a single function)
tags: python

Generators make it easy to create iterations in Python and in return write less code. This tutorial will introduce you to Python generators, their benefits, and how they work. Basics A generator...
tags: heroku, python

A step-by-step guide for deploying your first Python app and mastering the basics of Heroku
tags: algorithms-math, python
Minimal examples of data structures and algorithms in Python - keon/algorithms
tags: distributions, prob-stats, python

Standard Deviation is one of the most underrated statistical tools out there. It’s an extremely useful metric that most people know how to calculate but very few know how to use effectively.
tags: cuda, numba, python
Numba is an open-source Python compiler from Anaconda that can compile Python code for high-performance execution on CUDA-capable GPUs or multicore CPUs.
tags: python

In this tutorial, I will be focusing on arguments (*args) and keyword arguments (*kwargs) in Python. I will teach you what args and kwargs are and, most importantly, how to use them—that is...
tags: python
A tutorial on organizing python code into reusable units, building packages, and using conda. - vestuto/reusable-python
tags: python, visualization

The Python Graph Gallery displays hundreds of charts made with Python, always with explanation and reproduciible code
tags: python, webdev
Yes, really, nothing but Python! Anvil has a drag-and-drop editor, Python in the browser and on the server, and one-click deployment.
tags: benchmarks, python
tags: fastapi, python

FastApi is a contemporary web framework designed for creating RESTful APIs with Python 3.8 or later.
tags: llms, python, graphs

The challenge of managing and recalling facts from complex, evolving conversations is a key problem for many AI-driven applications. As information grows and changes over time, maintaining accurate context becomes increasingly difficult. Current systems often struggle to handle the evolving nature of relationships and facts, leading to incomplete or irrelevant results when retrieving information. This can affect the effectiveness of AI agents, especially when dealing with user memories and context in real-time applications. Some existing solutions have attempted to address this problem. One common approach is using a Retrieval-Augmented Generation (RAG) pipeline, which involves storing extracted facts and using techniques
tags: python, machine-learning, deep-learning
In this article, I'll take you through a list of guided projects to master AI & ML with Python. AI & ML Projects with Python.
tags: gradio, python, machine-learning
Documentation, tutorials and guides for the Gradio ecosystem..
tags: python
Code level discussion of web scraping, gray hat automation, growth hacking and bounty hunting
tags: python, pdf
PyMuPDF is a high-performance Python library for data extraction, analysis, conversion & manipulation of PDF (and other) documents.
tags: pdfs, python

Extracting structured data from unstructured sources like PDFs, webpages, and e-books is a significant challenge. Unstructured data is common in many fields, and manually extracting relevant details can be time-consuming, prone to errors, and inefficient, especially when dealing with large amounts of data. As unstructured data continues to grow exponentially, traditional manual extraction methods have become impractical and error-prone. The complexity of unstructured data in various industries that rely on structured data for analysis, research, and content creation. Current methods for extracting data from unstructured sources, including regular expressions and rule-based systems, are often limited by their inability to maintain
-->
python/pandas
categories:
tags: pandas python
date: 28 Mar 2025
slug:raindrop-python-pandas
In this article, we'll explore when and why you might want to use openpyxl directly, and understand its relationship with pandas.
3 Python libraries for scientific computation you should know as a data professional.
Learn how to manipulate and visualize vector data with Python’s GeoPandas
Demonstrating how to use the new blazing fast DataFrame library for interacting with tabular data
Pandas receives over 3M downloads per day. But 99% of its users are not using it to its full potential.
Simple tips to optimize the memory utilization in Pandas
I’ve been using Pocket for many years to collate all the articles, blog posts, recipes, etcI’ve found online. I decided it would be…
A detailed explanation of how groupby works under the hood to help you understand it better.
Sourced from O'Reilly ebook of the same name.
various tips and tricks.
Master usecols, chunksize, parse_dates in pandas read_csv().
Quick Python solutions to help your data science cycle.
In this article, I’ll show you five ways to load data in Python. Achieving a speedup of 3 orders of magnitude.
Learn how to speed up your Pandas workflow using the PyPolars library.
Are you a Data Scientist experienced with Pandas? Then you know its pain points. There's an easy solution - Dask - which enables you to run Pandas computations in parallel.
If you are working with big data, especially on your local machine, then learning the basics of Vaex, a Python library that enables the fast processing of large datasets, will provide you with a productive alternative to Pandas.
Pandas is a data analysis and manipulation library for Python. It is one of the most popular tools among data scientists and analysts. Pandas can handle an entire data analytics pipeline. It provides…
Part 1: Introduction to geospatial concepts (follow here) Part 2: Geospatial visualization and geometry creation (follow here) Part 3: Geospatial operations (this post) Part 4: Building geospatial…
A quick tutorial to drop duplicates using the Python Pandas library.
No need to install, import and initialize — Just use them
Pandas tips and tricks to help you get started with data analysis
A comprehensive practical guide
Groupby is so powerful, which may sound daunting to beginners, but you don’t have to know all of its features.
Pandas doesn’t handle well Big Data. These two libraries do! Which one is better? Faster?
Explained with examples
Scaling your Pythonic data science and machine learning to the cloud using Dask. All from the comfort of your own laptop.
Explained with examples.
When and how to use which.
Pandas: From Journeyman to Master — Voice from the victim.
Use Pandas with Dask to save time and resources. This combination will make your notebook ultra fast
Sample, where, isin explained in detail with examples.
Clearly distinguish loc and iloc
This post will address the issues that can arise when Pandas slicing is used improperly. If you see the warning that reads "A value is trying to be set on a copy of a slice from a DataFrame", this post is for you.
Know your Pandas library function arsenal as a data scientist
This new Python package accelerates notebook-based machine learning experimentation
A code-along guide for Pandas’ advanced functionalities.
How does pivot work? What is the main pandas building block? And more …
5 lesser-known pandas tricks that help you be more productive
In this post, we’ll go over how to write DataFrames to CSV files.
Extract data from different sources
Expedite your data analysis process
Master these pandas functions (and methods) to shorten your code, improve performance and avoid headaches.
These mistakes are super common, and super easy to fix.
Make your day to day life easier by using these functions in your analysis
We show how to build intuitive and useful pipelines with Pandas DataFrame using a wonderful little library called pdpipe.
While Pandas is the library for data processing in Python, it isn't really built for speed. Learn more about the new library, Modin, developed to distribute Pandas' computation to speedup your data prep.
The pandas library offers core functionality when preparing your data using Python. But, many don't go beyond the basics, so learn about these lesser-known advanced methods that will make handling your data easier and cleaner.
This post is a part of my series on Python Shorts. Some tips on how to use python. This post is about using the computing power we have at hand and applying it to the data structure we use most.
-->
ui-ux (all)
categories:
tags: ui-ux
date: 28 Mar 2025
slug:raindrop-uiux-all
-->
webdev (all)
categories:
tags: webdev
date: 28 Mar 2025
slug:raindrop-webdev-all
-->
ecommerce (all)
categories:
tags: ecommerce
date: 28 Mar 2025
slug:raindrop-ecommerce-all
-->
prodmgmt (all)
categories:
tags: ecommerce
date: 30 Mar 2025
slug:raindrop-prodmgmt-all
-->
goodreads (all)
categories:
tags: goodreads
date: 30 Mar 2025
slug:raindrop-goodreads-all
-->
behaviors (all)
categories:
tags: behaviors
date: 30 Mar 2025
slug:raindrop-behaviors-all
-->
machine-learning (all)
categories:
tags: machine-learning
date: 30 Mar 2025
slug:raindrop-ml-all
-->
programming (all)
categories:
tags: programming
date: 30 Mar 2025
slug:raindrop-programming-all
-->
semiconductors (all)
categories:
tags: semiconductors
date: 30 Mar 2025
slug:raindrop-semiconductors-all
-->
deep-learning (all)
categories:
tags: deep-learning
date: 30 Mar 2025
slug:raindrop-deeplearning-all
-->
devops (all)
categories:
tags: devops
date: 30 Mar 2025
slug:raindrop-devops-all
-->
influence & persuasion (all)
categories:
tags: influence-persuasion
date: 30 Mar 2025
slug:raindrop-influence-persuasion-all
-->
music (all)
categories:
tags: music
date: 30 Mar 2025
slug:raindrop-algorithms-math-all
-->
history (all)
categories:
tags: history
date: 30 Mar 2025
slug:raindrop-history-all
-->
startups (all)
categories:
tags: startups
date: 30 Mar 2025
slug:raindrop-startups-all
-->
food & drink (all)
categories:
tags: food-drink
date: 30 Mar 2025
slug:raindrop-fooddrink-all
-->
analytics (all)
categories:
tags: analytics
date: 30 Mar 2025
slug:raindrop-analytics-all
-->
design patterns (all)
categories:
tags: design-patterns
date: 30 Mar 2025
slug:raindrop-designpats-all
-->
books (all)
categories:
tags: books
date: 30 Mar 2025
slug:raindrop-books-all
-->
pricing (all)
categories:
tags: pricing
date: 30 Mar 2025
slug:raindrop-pricing-all
-->
platforms (all)
categories:
tags: platforms
date: 30 Mar 2025
slug:raindrop-platforms-all
-->
movies & television (all)
categories:
tags: movies-television
date: 30 Mar 2025
slug:raindrop-moviestv-all
-->
large language models (LLMs) (all)
categories:
tags: llms
date: 30 Mar 2025
slug:raindrop-llms-all
-->
databases/sql (all)
categories:
tags: databases sql
date: 02 Apr 2025
slug:raindrop-sql-all

This tutorial shows you various ways to import CSV data into an SQLite table using sqlite3 and SQLite Studio tools.
Neat open source project on the GitHub organisation for the UK government's Department for Business and Trade: a "Python virtual filesystem for SQLite to read from and write to S3." …
An interesting twist in my recent usage of SQLite was the fact that I noticed my research scripts and the database intertwine more. SQLite is unique in that it really lives in-process, unlike standalone database servers. There is a feature to that which does not get used very frequently, but can be indispensable in some situations. By the way, the talk about the system that made me me to explore SQLite in anger can now be seen here. Normally it is your Ruby (or Python, or Go, or whatever) program which calls SQLite to make it “do stuff”. Most calls will be mapped to a native call like sqlite3_exec() which will do “SQLite things” and return you a result, converted into data structures accessible to your runtime. But there is another possible direction here - SQLite can actually call your code instead.
Some of the interesting and insane facts I learned about SQLite


#60: Break Into Google Spanner Architecture (5 Minutes)

Alex Garcia announced the much-anticipated release of sqlite-vec v0.1.0. This new SQLite extension, written entirely in C, introduces a powerful vector search capability to the SQLite database system. Released under the MIT/Apache-2.0 dual license, sqlite-vec aims to be a versatile and accessible tool for developers across various platforms and environments. Overview of sqlite-vec The sqlite-vec extension enables vector search functionality within SQLite by allowing the creation of virtual tables with vector columns. Users can insert data using standard SQL commands and perform vector searches using SELECT statements. This integration means that vector data can be stored and queried within the
Get started with SQLite databases in Python using the built-in sqlite3 module.
This is my personal site, where I write about Ruby, programming, and any of my varied fascinations.

While both WHERE and HAVING are used for filtering rows, condition in WHERE clause is applied before grouping of data and condition on HAVING is applied after grouping

Window functions are an advanced feature of SQL that provides powerful tools for detailed data analysis and manipulation without grouping data into single output rows, which is common in aggregate functions.
This is my personal site, where I write about Ruby, programming, and any of my varied fascinations.

"Deep" modules, mismatched interfaces - and why SAP is so painful

A complete GPT2 implementation as a single SQL query in PostgreSQL.

Introduction: Losing or forgetting the MySQL root password can be a stressful situation, but don't...

Developed by ETH Zürich, the language explores new paradigms for LLM programming.


Intro Hello guys! Today I try to write about how to start using psql in Terminal app,...

Recursive queries are a straightforward solution to querying hierarchical trees. However, one loop in the relationship references results in a failing or never ending query when cycle detection is not used.

Simple hacks to try before moving to a different data model altogether
The QUALIFY clause is pure syntactic sugar
A SQLite extension which loads a Google Sheet as a virtual table. - 0x6b/libgsqlite
Speed up your SQL learning curve.

Data is naturally at the heart of the job of a data scientist or data analyst. You can get your...
SQL (Structured Query Language) is a programming language used to manage and manipulate relational...

MySQL is an open-source database management system, commonly installed as part of the popular LAMP (Linux, Apache, MySQL, PHP/Python/Perl) stack. It implemen…
Learn SQL commands for filtering, string operations, alias, joining tables, if-else statements, and grouping.

a.k.a. leave BeautifulSoup in the past and embrace SQL I used DALL·E to generate thumbnails for this post: “cute cartoon|claymation abominable snowman scraping ice off his frozen car windshield” is nightmare fuel Some of the most common web-scraping tasks can be done in pure SQLite - meaning no Python, Node, Ruby, or other programming languages necessary, only the SQLite CLI and some extensions. The main extension that enables this: sqlite-http, which allows you to make HTTP requests and sa

We've open sourced Trilogy, the database adapter we use to connect Ruby on Rails to MySQL-compatible database servers.

Let's open a hex editor and see what this thing is made of

I figured out how to run a SQL query directly against a CSV file using the sqlite3 command-line utility:

When migrating from PostgreSQL to MySQL we often get stuck with syntax between databases. Here are...
general purpose extensions to golang's database/sql - jmoiron/sqlx
Finally, start practicing SQL with your own database

Databases are the houses of our data and data scientists HAVE TO HAVE A KEY! In this article, I discuss some lesser known concepts of SQL that data scientists do not familiarize themselves with.


Use these simple techniques to make your analysis and data extracts easier

Bringing it back to the basics
A Quick Guide to the IF, CASE, and IFNULL Statements

This 2-page SQL Basics Cheat Sheet will be a great value for beginners as well as for professionals. Download it in PDF or PNG format.

Implementing search in your Rails app can be vexing. Here's a great pattern to use that combines the best parts of ActiveRecord and Postgres.
I was writing a tiny website to display statistics of how much sponsored content a Youtube creator has over time when I noticed that I often write a small tool as a website that queries some data from a database and then displays it in a graph, a table, or similar. But if you want to use a
This is a chronicle of my experiment where I set out to insert 1B rows in SQLite
Reviewing more advanced SQL operations to extract additional data insights from the Irish Weather dataset.

SQL is a programming language used by relational database management systems. It provides numerous functions and methods that operate on the data stored in relational databases. SQL is not just a…
Are you a NoSQL beginner, but want to become a NoSQL Know-It-All? Well, this is the place for you. Get up to speed on NoSQL technologies from a beginner's point of view, with this collection of related progressive posts on the subject. NoSQL? No problem!
One of the most valuable technical skills I use working on a data science team in the retail space is SQL…
To explore SQLite along with Python, which is a user-friendly and no-nonsense language, we are going...

If you’ve been practicing your SQL religiously, like I suggested in Top Skills to Ace Every SQL Interview Question, then you’ve probably…
The ultimate set of SQLite extensions.

Here is why SQLite is a perfect tool for you - whether you are a developer, data analyst, or geek.
The last SQL guide for data analysis you'll need! OK, maybe it’s actually the first, but it’ll give you a solid head start.

Historically speaking, processing large amounts of structured data has been the domain of relational databases. Databases, consisting of tables that can be joined together or aggregated…

How to avoid those dreaded pitfalls and “gotcha” moments when selecting databases for your next application?
A practical guide with MongoDB
MySQL is an open-source database management system, commonly installed as part of the popular LAMP (Linux, Apache, MySQL, PHP/Python/Perl) stack. It implemen…

From the power of hierarchical queries to that of procedural constructs in SQL
Using SQLite to store your Pandas dataframes gives you a persistent store and a way of easily selecting and filtering your data
DuckDuckGo. Privacy, Simplified.

521 votes, 27 comments. 411K subscribers in the computerscience community. The hot spot for CS on reddit.
Transforming spreadsheets into queryable database tables

MongoDB and SQL databases are two polar opposite sides of the backend world. The former deals with chaotic unstructured data, while the…

This post is about installing SQL, explaining SQL and running SQL.
Everything You Need to Get Started!

The SQL queries I use as a data scientist and software engineer

I'm re-installing MySQL (5.7.29) for Ubuntu Linux 18.04 LTS. I installed the package using apt & started the service without issue. I was not asked for a root password during the install and am...
How to combine data spread over two CSV files, like separate tables in a normalized relational database.

In this new chapter, we are going to show the following examples in a local SQL Server using SQL Server command line (sqlcmd).
A command-line client for SQL Server with auto-completion and syntax highlighting - dbcli/mssql-cli
-->
signaling (behavior)
categories:
tags: behavior signaling
date: 02 Apr 2025
slug:signaling

I thought for sure that I’d previously written about the secret jelly packet & pickle-based system that chefs at the Waffle House use to “store” all of the orders that come in for food during service, but I can’t find it in the a
01 Intro One of the best books I have read in the last few years is The Elephant in the Brain by Robin Hanson and Kevin Simler. The book makes two main arguments: a) Most of our everyday actions can be traced back to some form of signaling or status seeking b) Our brains deliberately hi

New research on consumer behavior shows that we tend to match some types of choices the people around us make, but not others.

For a couple of centuries, the British were in an unlikely frenzy for the exotic fruit.

How do false beliefs spread, and what are the consequences?

Smiles can be a way to dupe people because they’re easy to fake – but we’ve figured out which smiles can be trusted

The psychological quirks that make it tricky to get an accurate read on someone's emotions

I’ve spent a lot of time recently thinking about different proof-of-work mechanisms. When I say proof-of-work, I’m not talking about consensus algorithms like the ones that some crypto currencies use. I’m talking about social networks.

Many brands overshoot the subtleties of virtue signaling. They preach, posture, and alienate the people they’re trying to impress. We show how big companies can better bang their virtue drums. #brand #marketing #PR #business #SocialMedia #CX
The most commonly used introduction to signaling, promoted both by Robin Hanson and in The Art of Strategy, starts with college degrees. Suppose, the…
-->
pycaret
categories:
tags: pycaret python
date: 02 Apr 2025
slug:raindrop-pycaret
This article illustrates defining and using custom metrics through a code example.
This article explains early stopping and how to use it in PyCaret for classification.
Exploring the Latest Enhancements and Features of PyCaret 3.0
A beginner’s guide to PyCaret’s natural language processing module.
Introductin to PyCaret.
Combining the “Trend” and “Difference” Terms
Low-code Machine Learning with a Powerful Python Library
A step-by-step guide on how to predict customer churn the right way using PyCaret that actually optimizes the business objective and improves ROI for the business.
PyCaret is an alternate low-code library that can be used to replace hundreds of lines of code with few lines only. See how to use PyCaret's Regression Module for Time Series Forecasting.
Train, visualize, evaluate, interpret, and deploy models with minimal code.
[et_pb_section fb_built=”1″ admin_label=”Header” _builder_version=”4.12.0″ background_color=”#01012C” collapsed=”on” global_colors_info=”{}”][et_pb_row column_structure=”1_2,1_2″ _builder_version=”4.12.0″ collapsed=”on” global_colors_info=”{}”][et_pb_column type=”1_2″ _builder_version=”4.12.0″ z_index=”10″ custom_padding=”18%||||false|false” global_colors_info=”{}”][et_pb_text _builder_version=”4.14.7″ text_font=”Montserrat|800|||||||” text_text_color=”#01012C” text_font_size=”470px” text_line_height=”1em” positioning=”absolute” custom_margin=”|-30%||-10%|false|false” custom_margin_tablet=”|0%||-5%|false|false” custom_margin_phone=”|0%|||false|false” custom_margin_last_edited=”on|desktop” text_font_size_tablet=”40vw” text_font_size_phone=”40vw” text_font_size_last_edited=”on|tablet” text_text_shadow_style=”preset5″ text_text_shadow_horizontal_length=”-1.5px” text_text_shadow_vertical_length=”-1.5px” text_text_shadow_color=”#DB0EB7″ global_colors_info=”{}”] pc [/et_pb_text][et_pb_text _builder_version=”4.14.7″ header_font=”Barlow Condensed|500|||||||” header_text_color=”#FFFFFF” header_font_size=”122px” custom_margin=”||0px||false|false” header_font_size_tablet=”42px” header_font_size_phone=”26px” header_font_size_last_edited=”on|tablet” global_colors_info=”{}”] low-code machine learning [/et_pb_text][et_pb_button button_url=”https://pycaret.gitbook.io” url_new_window=”on” button_text=”GET STARTED” _builder_version=”4.14.7″ […]
I came across Pycaret while I was browsing on a slack for data scientists. It's a versatile library in which you can apply/evaluate/tune…
-->
a/b testing (analytics)
categories:
tags: analytics
date: 03 Apr 2025
slug:ab-testing

A/B testing is a cornerstone of data science, essential for making informed business decisions and optimizing customer revenue. Here, we delve into six widely used statistical methods in A/B testing, explaining their purposes and appropriate contexts. 1. Z-Test (Standard Score Test): When to Use: This method is ideal for large sample sizes (typically over 30) when the population variance is known. Purpose: Compares the means of two groups to determine if they are statistically different. Applications: This technique is frequently employed in conversion rate optimization and click-through rate analysis. It helps identify whether changes in website elements or marketing strategies
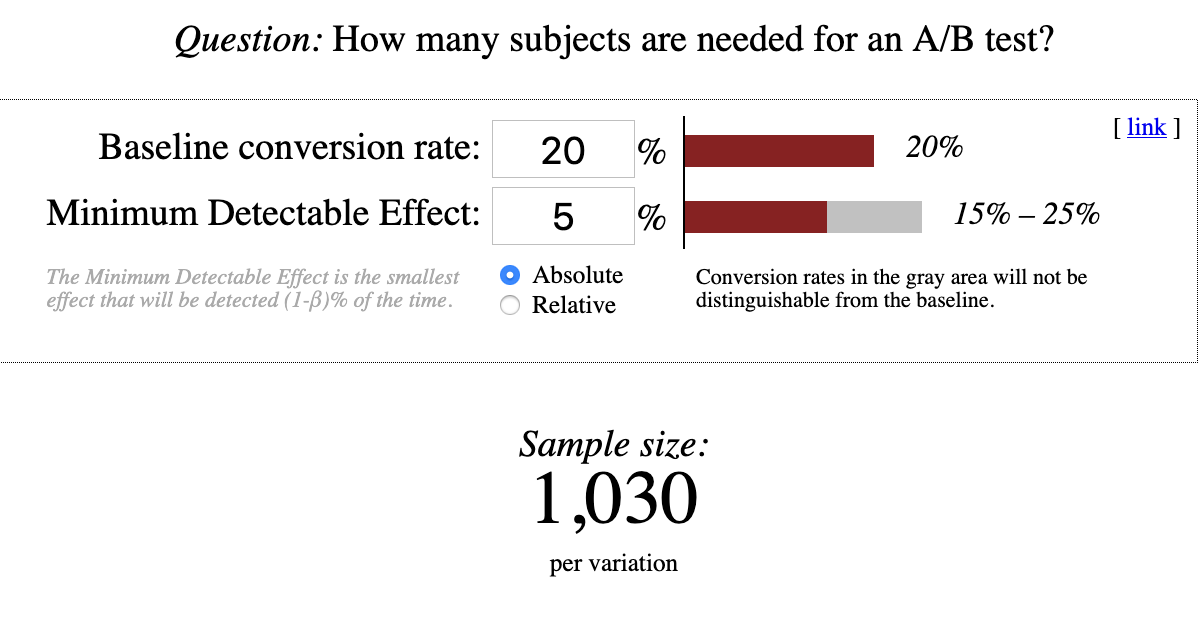
Visual, interactive sample size calculator ideal for planning online experiments and A/B tests.
Evaluating ad targeting product using causal inference: propensity score matching!
For non-tech industry folks, an “A/B test” is just a randomized controlled trial where you split users or other things into treatment and control groups, and then later compare key metr…

Running experiments is equal parts powerful and terrifying. Powerful because you can validate changes that will transform your product for the better…
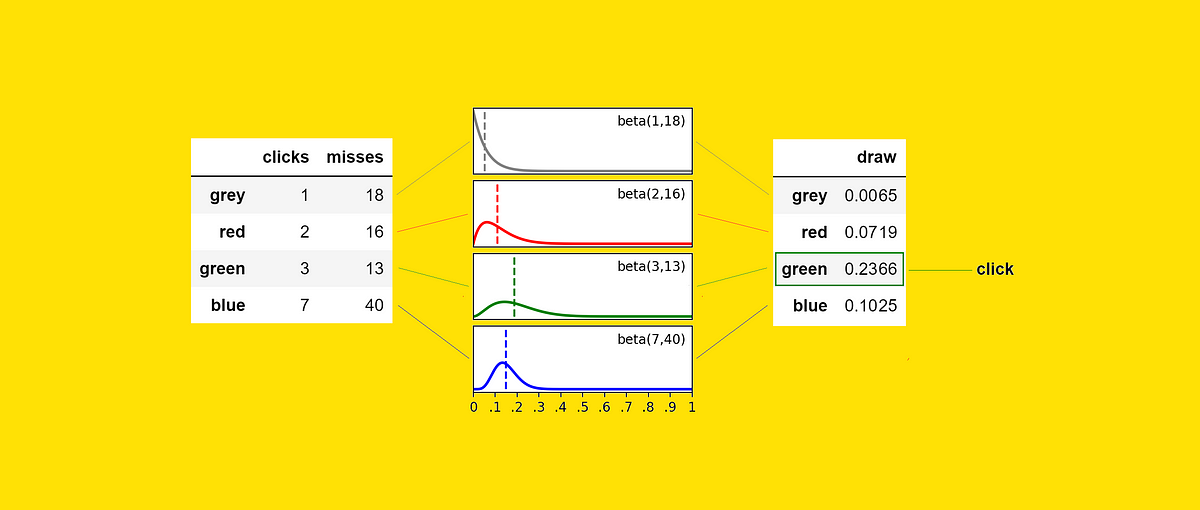
An in-depth explanation of “Thompson Sampling”, a more efficient alternative to A/B testing for online learning
Questions on A/B testing are being increasingly asked in interviews but reliable resources to prepare for these are still far and few…
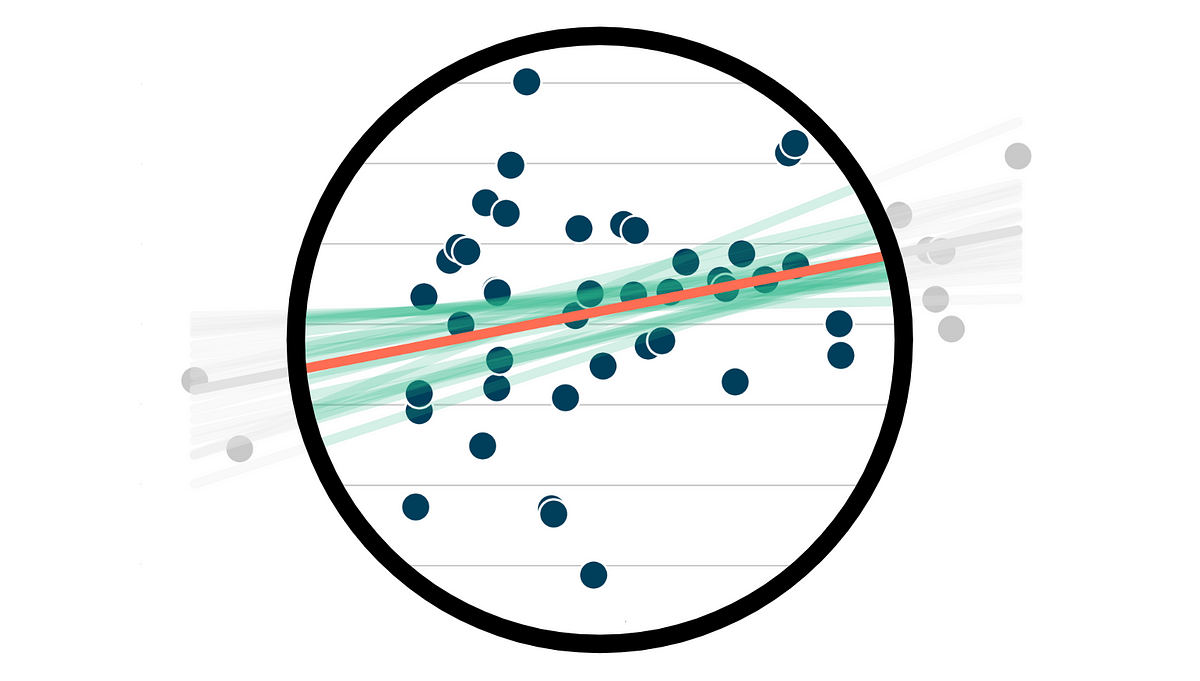
Using and choosing priors in randomized experiments.
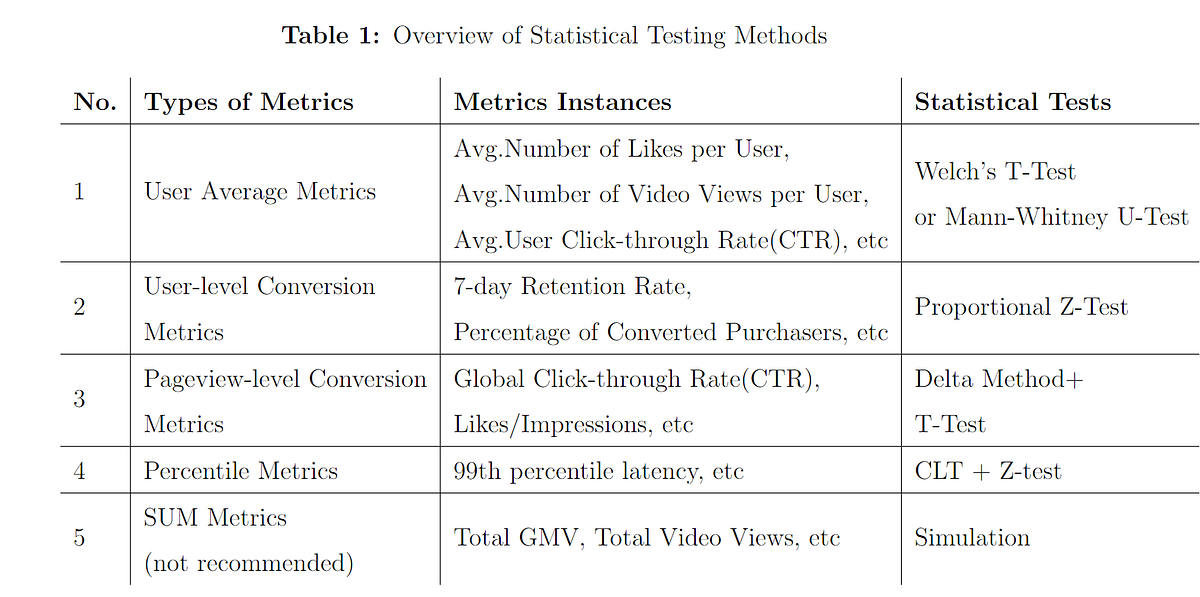
A Discussion of the go-to methods for 5 Types of A/B Metrics
How today’s tech companies make data-driven decisions in Machine Learning production
While Fisher’s exact test is a convenient tool for A/B testing, the idea and results of the test are often hard to grasp and difficult to…

A/B testing is hitting the mainstream because it is so effective. And with so many tools available it has become very easy and very inexpensive to run. Here are 23 helpful tips on how you can take your A/B tests from basic to the next level.

A/B tests provide more than statistical validation of one execution over another. They can and should impact how your team prioritizes projects.
We’re Agile, we think lean, we’re data-driven. If you live in the new economy and work in some sort of digital product you hear some of…

An applied introduction to causal inference in tech
We spoke with Etsy’s iOS Software Engineer, Lacy Rhoades, about their culture of continuous experimentation. Learn about their a/b testing culture

A/B testing is a very popular technique of checking granular changes in a product without mistakenly taking into account changes that were…
Multivariate tests indicate how various UI elements interact with each other and are a tool for making incremental improvements to a design.
The best way to determine what works best for your site is to carry out an A/B test for your landing pages. Check out this A/B significant test calculator.

Our A/B test calculator will help you to compare two or three variants to determine which test will be statistically significant.
Elaborate usability tests are a waste of resources. The best results come from testing no more than 5 users and running as many small tests as you can afford.

A/B testing, the process of exposing randomized visitors to one or more variables, is among the most effective strategies to optimize user experiences and conversion rates. Here is a list of A/B testing tools.
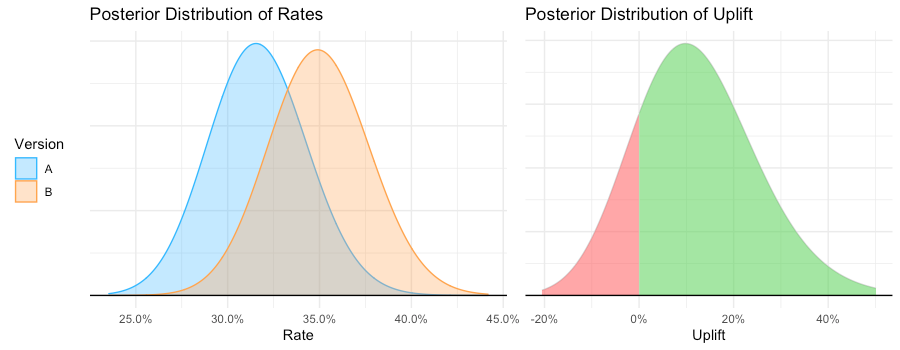
Statistics & Business can share the same Language

Experimentation is widely used at tech startups to make decisions on whether to roll out new product features, UI design changes, marketing campaigns and more, usually with the goal of improving…
The best way to optimise your website is usually the simplest.

How not to fail your online controlled experimentation
Optimizing web marketing strategies through statistical testing
A/B Testing — A complete guide to statistical testing - bjpcjp/AB_Testing

The intuitive way of A/B testing. The advantages of the Bayesian approach and how to do it.
Big success. Bigger failure. And lots of lessons. Learn why building a growth team may be a multi-million dollar mistake.
The biggest question in ecommerce A/B testing is not “how.”

A/B tests are controlled experiments of two attributes, to measure which one was most popular with users. You can apply A/B testing to just about anything that you can measure. Multivariate testing allows you to measure multiple variables simultaneously.
Data Science, Machine Learning, AI & Analytics
-->
animation
categories:
tags: animation webdev
date: 03 Apr 2025
slug:animation

Exploring SVG and its visual effects applications

How an image format changed the way we communicate

Keeping characters looking the same across different scenes and styles has always been tricky. But now, with the new Midjourney

Something happened earlier this year where I got on a run making checkbox animations and just couldn’t stop.

Video and audio recordings of people saying or doing things they never said or did can be created using AI deepfake generators and software tools that use artificial intelligence to make convincing fakes. A neural network is trained using a massive collection of authentic media featuring the target individual to accomplish this. The web is trained to recognize individuals and imitate their appearance, speech, and behavior. There is a wide range of potential good and bad uses for AI deepfake generators. You can use them to make comedic videos or instructional materials. Here are some AI deepfake generators for photos

Geoff Bailey and Lucy York Struever used C.G.I. to create a world that’s layered and cozy, even when Death comes knocking.

Browse MakeaGif's great section of animated GIFs, or make your very own. Upload, customize and create the best GIFs with our free GIF animator! See it. GIF it. Share it.

In the ever-evolving landscape of web development, creating captivating user experiences is a...

Introduction Cascading Style Sheet (CSS) is a style sheet language that's used to design,...

1. Animated Background with SVG in CSS Output Source Code 2. CSS...

Live Demo / Download -- In this tutorial, we will utilize the power of HTML canvas to...

Since the moviegoing public first started hearing it twenty years ago, Wes Anderson's name has been a byword for cinematic meticulousness.


Learn how to use JavaScript to draw any regular shape to a HTML canvas with a single function, and how to modify it to draw multiple shapes.

Lerp is the nickname for Linear Interpolation between two points. It's a fairly simple effect to implement but can really improve the look of your animations if you're moving an object from a point A to point B.

Web Animations API is a JavaScript API that provides a standardized approach to creating and...

For the longest time, developers were limited to Flash players and gifs when they wanted to display...

SVG `` provides a way to define how an element moves along a motion path. In this article, Paul Scanlon shares an idea of how to use it by animating race cars in an infinite loop as easy as one-two-three!

Developers often feel discouraged from editing SVG markup and experimenting with SVG animations, thinking it’s a significant time investment or they need to use a complex animation library to do so. In this article, Adrian showcases his favorite tricks, which make the process streamlined and fun.

Smashing Magazine — front-end, UX and design for front-end engineers and designers

Some of the best animation software are Visme, Adobe Animate, Blender, Pencil2D, Animaker and Biteable. Find out how these and other tools compare.
A React+D3 animated bubble chart.

Welcome to the second tutorial in this series on animating with anime.js! In the previous post,...

Let’s get things moving! 🎞

Animation can help people make sense of all the data at their fingertips.

From sequence to shot to frame, explore our studio pipeline.

Nowadays it’s hard to impress or even surprise with an interface animation. It shows interactions between screens, explains how to use the…

Used correctly, it can capture audience attention, make your website more engaging, and even improve your chances of delivering conversions for your clients.Unfortunately, like many things in the web design world, it’s also easy to get too carried away with animation. As professional designers and…

Motion is a powerful tool to attract users’ attention. When designing an animation consider its goal, its frequency of occurrence, and its mechanics.

This collection of the best JavaScript animation libraries will help you get a headstart in animating any element on your website.

Oh, animation… we want to get it right so badly, don’t we? I mean, does anybody really enjoys a stiff, snappy UI? Can anyone admit they’re…

Transitions from one CSS style configuration to another can be animated using CSS animations. A style...
Its popularity fluctuates, but it’s always there somewhere, as an essential component in any web site.From tiny, barely visible, loading spinners, to whole page transitions like a movie experience, animation reaches into every area of our designs.For designers looking to incorporate animation,…

Introduction Libraries help us to code faster through their predefined classes for...

Here is the list of awesome CSS animation resources that will help you to animate components quickly...
This comprehensive guide shows how to use CSS transitions! A back-to-basics look at the fundamental building blocks we need to create microinteractions and other animations.

From Bugs Bunny to Spike Spiegel to Miles Morales, retracing 128 years of an art form that continues to draw us all in.
Python has some great data visualization librairies, but few can render GIFs or video animations. This post shows how to use MoviePy as a generic …

If you’re interested in creating content to promote your product or service, think about making a cartoon. Producing animation has several advantages over
-->
auctions
categories:
tags: auctions game-theory
date: 03 Apr 2025
slug:auctions

From flipping to white glove sales, here are terms to know before you attend an auction.

An auction is usually a process of buying and selling goods or services by offering them up for bids, taking bids, and then selling the item to the highest bidder or buying the item from the lowest bidder. Some exceptions to this definition exist and are described in the section about different types. The branch of economic theory dealing with auction types and participants' behavior in auctions is called auction theory.

There are many types of auctions. Learn the various auction types and when each one is used based on the lot. You may be surprised that...
A deep dive into why the DOJ thinks RGSP makes ad auctions unfair, and why Google believes it creates a better user experience.
How bid density impacts ads, recommender systems, and salary negotiations.
It’s a place for obsessives to buy, sell and geek out over classic cars. The company pops open its hood after 100,000 auctions to explain why.

Fliers on some airlines can upgrade at a discounted rate to avoid what could be a cramped flight. With some cruise ships and even Amtrak getting in on the act, is bidding up worth it?

Learn everything you need to know about an ad exchange, from how they function to their impact on advertising success. Here's an A to Z guide.

Auction houses and galleries are getting creative, partnering to drive demand and give their clients access to the best works.
The page you requested might have been removed, renamed or is temporarily unavailable.
Determining which promoted auction items to display in a merchandising placement is a multi-sided customer challenge that presents opportunities to both surface amazing auction inventory to buyers and help sellers boost visibility on their auction listings.

How easy is it to fall into auction addiction? Here we examine how one site, Quibids, tried its hand at behavioral design.

A broad overview of market mechanisms, with an emphasis on the interplay between theory and real-life applications; examples range from eBay auctions to scho...
The estate-sale industry is fragile and persistent in a way that doesn’t square with the story of the world as we have come to expect it.

Collectors fluent in catalogue symbology can see which lots are locked in, which might lead to surprising results, and how an entire auction is likely to go.

A Nobel-Prize winner spent years designing an auction to sell off the airwaves, which are owned by the public. But Wall Street found a tiny flaw. | Subscribe to our weekly newsletter here.
Prices for works by some relatively new artists have skyrocketed, seemingly overnight.

The Sveriges Riksbank Prize in Economic Sciences in Memory of Alfred Nobel 2020 was awarded jointly to Paul R. Milgrom and Robert B. Wilson "for improvements to auction theory and inventions of new auction formats"

Atreus provides a complete platform for selling and buying by online auction that includes several auctions types, auction management software, auction as a service solution (SaaS platform), Auctions API, bidding platform, custom auctions solutions.

Insiders may already know who’s going to buy what for how much, and lots are presented in a certain order just to build excitement.
As Christie’s, Sotheby’s and others vie to lure sellers of big-name artworks, analysts wonder if the houses are running oversize risks.

Their business model harkens to the 1700s, but the fight for buyers has moved to the internet and to Asia.

Even as auction house salesrooms have gone quiet amid the pandemic, Christie’s, Phillips’s, and Sotheby’s private sales departments are keeping busy.
A Vickrey–Clarke–Groves (VCG) auction is a type of sealed-bid auction of multiple items. Bidders submit bids that report their valuations for the items, without knowing the bids of the other bidders. The auction system assigns the items in a socially optimal manner: it charges each individual the harm they cause to other bidders. It gives bidders an incentive to bid their true valuations, by ensuring that the optimal strategy for each bidder is to bid their true valuations of the items; it can be undermined by bidder collusion and in particular in some circumstances by a single bidder making multiple bids under different names. It is a generalization of a Vickrey auction for multiple items.
-->
beliefs
categories:
tags: behavior beliefs
date: 03 Apr 2025
slug:beliefs

We put a lot of weight on the backstories of objects, even — maybe especially — when those stories aren’t happy ones.

Conspiracy theories abound. What should you believe − and how can you tell?
:extract_focal()/https%3A%2F%2Fimages.theconversation.com%2Ffiles%2F490737%2Foriginal%2Ffile-20221019-20-g6fx2h.jpg%3Fixlib%3Drb-1.1.0%26rect%3D44%252C0%252C2072%252C1414%26q%3D20%26auto%3Dformat%26w%3D320%26fit%3Dclip%26dpr%3D2%26usm%3D12%26cs%3Dstrip)
The source of 13’s bad reputation – “triskaidekaphobia” – is murky and speculative.
Improve your thinking, become smarter and pioneer the future
-->
charisma
categories:
tags: charisma influence-persuasion
date: 03 Apr 2025
slug:charisma
An in-depth breakdown of charismatic leadership tactics and how to tap into your own charisma when speaking in public.

Kamala Harris has energized Democrats with her personality, but charm in politics may be more limited and volatile than we think.
How our culture, politics and technology became infused with a mysterious social phenomenon that everyone can feel but nobody can explain.
Industrial genius Carl Braun believed that clear thinking and clear communication go hand in hand. Here the guide on writing productively to get things done.
Charisma, elusive gift bestowed upon a select few? Or a set of skills and qualities that anyone can learn? An in-depth breakdown of charismatic leadership tactics and communication.

What did JFK, Marilyn Monroe and Hitler all have in common?They were all renowned charismatics that lit up every room they entered. You’ve most likely met one of these kinds before. The guy/girl at the party. They possess some strange quality that causes them to be liked

What makes a person magnetic and why we should be wary.
Good body language is a crucial part of making an excellent first impression.

From the first moment you walk into a room people are making judgements about how much they like you. Fortunately, there are ways to improve your chances
-->
chivalry
categories:
tags: behavior chivalry
date: 03 Apr 2025
slug:chivalry

These methods have helped me enormously—and can save you much heartache and anxiety
-min.jpg)
The Curiosity Chronicle has quickly become one of the most popular newsletters for growth-minded individuals in the world. Each week, subscribers receive a deep dive that covers topics ranging from growth and decision-making to business, finance, startups, and technology. In addition, subscribers receive The Friday Five, a weekly newsletter with five ideas curated to spark curiosity headed into the weekend.

“Often we imagine that we will work hard until we arrive at some distant goal, and then we will be happy. This is a delusion. Happiness is the result of a life lived with purpose. Happiness is not an objective. It is the movement of life itself, a process, and an activity. It arises from …
-->
cognition (neurology)
categories:
tags: cognition neurology perception
date: 03 Apr 2025
slug:cognition


The compound has been linked to improved cognitive performance and reduced anxiety – but are you getting enough of it?

The brain is our most powerful information-processing machine, but can it sometimes glitch? Enter the Stroop Effect.
There are so many buzzwords and best practices out there, but let's focus on something more fundamental. What matters is the amount of confusion developers feel when going through the code.

Zero, which was invented late in history, is special among numbers. New studies are uncovering how the brain creates something out of nothing.

Different approaches can support varied forms of memory

Researchers are using AI and technological advancements to create companion robots

The pleasant feeling of knowing, the frustration of forgetting, and other ‘metacognitive feelings’ serve as unsung guides

For Perplexity, the partnership with SoundHound marks the addition of another strong distribution channel expanding the reach of its LLM-driven search capabilities.

While experts disagree on how common self-talk really is, they wholeheartedly agree that it’s a valuable tool for self-discovery.

From the time I learned to read, I have experienced a form of mental closed-captioning called ticker-tape synesthesia
Research shows that people are quick to form impressions of other people’s social class standing, which can have important consequences – but what specifically drives these impressions, and their relationship to judgements of harmful or advantageous stereotypes, has remained unknown.

Otter.ai uses an AI Meeting Assistant to transcribe meetings in real time, record audio, capture slides, extract action items, and generate an AI meeting summary.
Clone a voice in 5 seconds to generate arbitrary speech in real-time - CorentinJ/Real-Time-Voice-Cloning
Silero Models: pre-trained speech-to-text, text-to-speech and text-enhancement models made embarrassingly simple - snakers4/silero-models

PimEyes is a paid service that finds photos of a person from across the internet, including some the person may not want exposed. “We’re just a tool provider,” its owner said.

New research shows that detecting digital fakes generated by machine learning might be a job best done with humans still in the loop.

**Facial Recognition** is the task of making a positive identification of a face in a photo or video image against a pre-existing database of faces. It begins with detection - distinguishing human faces from other objects in the image - and then works on identification of those detected faces. The state of the art tables for this task are contained mainly in the consistent parts of the task : the face verification and face identification tasks. ( Image credit: [Face Verification](https://shuftipro.com/face-verification) )
Learn which of the 9 most prominent automatic speech recognition engines is best for your needs, and how to use it in Python programs.

Sixty years ago, a sharecropper’s son invented a technology to identify faces. Then the record of his role all but vanished. Who was Woody Bledsoe, and who was he working for?

A journey toward seeing myself more clearly.

Computers can generate faces that look real. What a time to be alive. As it becomes easier to do so, you can bet that the software will be used at some point for less innocent reasons. You should p…
-->
language & linguistics
categories:
tags: language linguistics
date: 03 Apr 2025
slug:language-linguistics

It began as an innocuous inquiry on Facebook. Nelson Felix, a resident of New York State, posted in the group ‘What’s My Typewriter Worth?’ about a curious find he made while clearing out the basement of his wife’s grandfather. He shared a few photos. The keys on the typewriter are all in Chinese, Felix noted, […]

Explore the fascinating world of untranslatable Japanese that reveal unique aspects of Japanese culture and daily life.

Utterances like um, wow and mm-hmm aren’t garbage — they keep conversations flowing

We insist that large language models repeatedly translate their mathematical processes into words. There may be a better way.

In an old Zen story, two monks argue over whether a flag is waving or whether it’s the wind that waves.

Contrary to somewhat popular belief, Chinese characters aren't just little pictures. In fact, most of them aren't pictures at all.

The mathematician Tai-Danae Bradley is using category theory to try to understand both human and AI-generated language.

A new study shows bonobos can combine vocal calls in ways that mirror human language, producing phrases with meanings beyond the sum of individual sounds. "Human language is not as unique as we thought," said Dr Melissa Berthet, the first author of the research from the University of Zurich. Another...

300 aspects of each call were cataloged, letting researchers estimate meaning.

Studying how extraterrestrials might communicate could help prepare for first contact and also hint at the point of language itself
METEOR Score is a metric used to evaluate the quality of machine translation based on precision, recall, word alignment, and linguistic flexibility.
Stemming is the linguistic process of reducing words to their base form, ignoring prefixes and suffixes, to enhance clarity and information retrieval.
Utterances like um, wow and mm-hmm aren’t garbage — they keep conversations flowing
/https://tf-cmsv2-smithsonianmag-media.s3.amazonaws.com/filer_public/49/d4/49d4cd58-5332-4784-9f63-60895717fca3/mar2025_a12_mespoptamia.jpg)
In the 1850s, cuneiform was just a series of baffling scratches on clay, waiting to spill the secrets of the ancient civilizations of Mesopotamia

An anthropologist explores laughter as a far more complex phenomenon than simple delight—reflecting on its surprising power to disturb and disrupt.

Linguists think that the words that we use to express pain might tell us something about our shared biology and the commonality of language.

In 1990, the federal government invited a group of geologists, linguists, astrophysicists, architects, artists, and writers to the New Mexico desert, to visit the Waste Isolation Pilot Plant. They would be there on assignment. The Waste Isolation Pilot Plant (WIPP) is the nation’s only permanent underground repository for nuclear waste. Radioactive byproducts from nuclear weapons manufacturing and nuclear power plants. WIPP was

How forensic linguists use grammar, syntax and vocabulary to help crack cold cases.

Findings suggest alphabetic writing may be some 500 years older than other discoveries
"How forensic linguists use grammar, syntax and vocabulary to help crack cold cases."

Some sentences just sound awkward. In order to ensure clarity, writers need to consider more than just grammar: weight is equally important. In the following extract from Making Sense, acclaimed linguist David Crystal shows how sentence length (and weight) affects writing quality.

A language scientist delves into historic and current efforts to catalog the planet’s 7,000-plus languages, uncovering colorful tales.

Up to 50% of twins develop their own communication pattern with one another. Most lose it over time, but for the Youlden twins it has become a normal way of communicating.

In defense of the supremely useful and unfairly maligned word.
Brain studies show that language is not essential for the cognitive processes that underlie thought
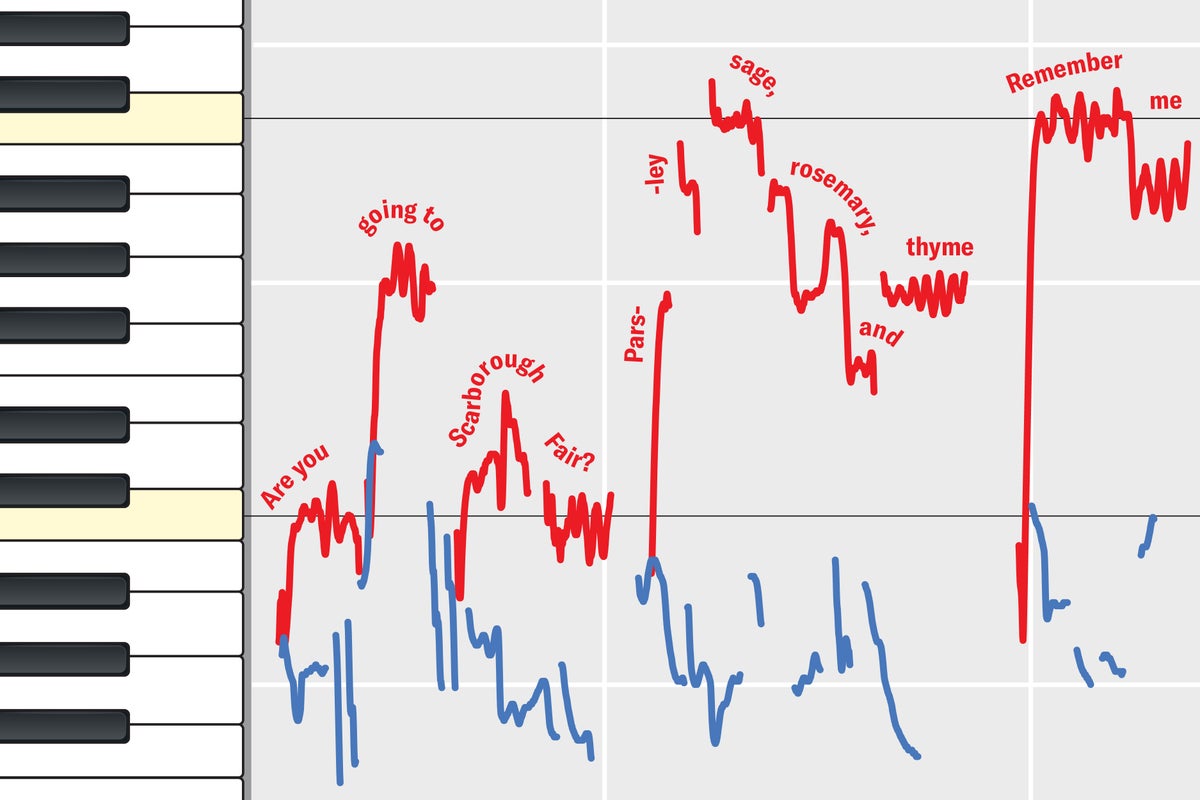
Songs and speech across cultures suggest music developed similar features around the world

Being cool is hard. Staying cool is harder. It’s an elusive quality, in part because it’s an elusive word with layers of nuanced meaning that peel off...

Prehistory professor Steven Mithen’s “The Language Puzzle” explores the mysteries of when and how we began to speak.

Don’t fixate on a few shaggy phrases. There’s something bigger going on.

Research on the rumbles of wild elephants suggest that these animals address each other with unique, name-like vocalizations. (Story aired on All Things Considered on June 10, 2024.)

The 7-38-55 rule claims that the majority of a conversation’s meaning is found in tone and body language. The truth is much more complicated.
:extract_focal()/https%3A%2F%2Fpocket-syndicated-images.s3.amazonaws.com%2Farticles%2F4844%2F1593012965_ezgif.com-webp-to-jpg44.jpg)
This piece of pseudo-profanity is what’s known as a taboo deformation—a word we say when we don’t want to say the word.

Your sixth-grade language arts class probably didn't cover kangaroo words and snowclones.
:extract_focal()/http%3A%2F%2Fstatic.nautil.us%2F4308_8cb94e7a9661ea20b1293c589216d396.jpg)
A new sign language is developing in the Negev desert and it’s catching linguists off-guard.
From the time I learned to read, I have experienced a form of mental closed-captioning called ticker-tape synesthesia


Some words, when used in specific situations, have deeper meanings than you realize: They’re codes to alert those in the know while keeping others in the dark.

The alien language spoken in Frank Herbert’s novels carries traces of Arabic. Why has that influence been scrubbed from the films?

There was a time in America, not so very long ago, when conventional wisdom discouraged immigrants from speaking the language of the old country at home. In fact, 'it used to be thought that being bilingual was a bad thing, that it would confuse or hold people back, especially children.

If we can learn to speak their language, what should we say?

How are so many politicians today able to get away with overtly racist utterances? By using rhetorical ‘figleaves’

Linguists and archaeologists have argued for decades about where, and when, the first Indo-European languages were spoken, and what kind of lives those first speakers led. A controversial new analytic technique offers a fresh answer.

Distinctive meanings for a word like “risk” can have a big impact on public messaging, especially when it comes to issues like climate change

Laughter is universal, but lol is not.

Argentine researchers studied a regional slang that reverses the order of word syllables or letters. Their findings give insight into our natural ability to engage in wordplay

The centuries-old texts were erased, and then written over, by monks at Saint Catherine’s Monastery in Egypt

From Wubi to Zhineng ABC, here are the different ways Chinese people have typed their language over the years.

Just a few days ago I saw an amazing video about Kurt Quinn, a man who can talk backwards. When I say backwards, I don’t mean that he reverses the order of the words in a sentence, but he act…

So I stumbled a few weeks ago on this video [https://www.youtube.com/watch?v=E4y7tf3VJAM] about the world's smallest conlang and I've been thinking about it ever since. [https://staging.cohostcdn.org/attachment/91c54129-9425-4695-bd68-6f65d83ae793/maxresdefault.jpeg] [https://www.youtube.com/watch?v=E4y7tf3VJAM] (You will probably have the idea more than fully by the ten minute mark.) This fascinated me. I think languages are really interesting but I'm also really bad at them. I cannot hack the memorization. I've mostly avoided conlangs (that's Constructed Languages, like Esperanto or Klingon) because like, oh no, now there's even more languages for me to fail at memorizing. So like, a language so minimal you can almost learn it by accident, suddenly my ears perk up. Toki pona is really interesting, on a lot of different axes. It's a thought experiment in Taoist philosophy that turns out to be actually, practically useful. It's Esperanto But It Might Actually Work This Time¹. It has NLP implications— it's a human language which feels natural to speak yet has such a deeply logical structure it seems nearly custom-designed for simple computer programs to read and write it². Beyond all this it's simply beautiful as an intellectual object— nearly every decision it makes feels deeply right. It solves a seemingly insoluble problem³ and does it with a sense of effortlessness and an implied "LOL" [https://staging.cohostcdn.org/attachment/747b4517-a3cf-438b-a6a0-07ad9e6883fd/Toki_pona.svg.png] at every step. So what toki pona is. Toki pona is a language designed around the idea of being as simple as it is possible for a language to be. It has 120 words in its original form (now, at the twenty year mark, up to 123), but you can form a lot of interesting sentences with only around twenty or thirty (I know this because this is roughly the size of my current tok vocabulary). The whole tok->en dictionary fits on seventeen printed pages [https://devurandom.xyz/tokipona/dictionary.html]⁴. There are no conjugations or tenses to memorize. There are no parts of speech, generally: almost every single word can be used as almost any part of speech, drop a pronoun or a preposition⁵ in the right place and it becomes a verb, drop a verb in the right place and it becomes an adjective. There are almost no ambiguities in sentence structure; I've only found one significant one so far (using "of" [pi] twice in the same clause) and the community deals with this by just agreeing not to do that. There's in one sense quite a lot of ambiguity in the vocabulary but in another sense there's none; for example nena is listed in the dictionary as meaning hill, mountain, button, bump, nose, but the official ideology of Toki Pona is that this is not a word with five definitions, it is a word with exactly one definition, that being the concept encompassing all five of hills, mountains, buttons, bumps, and noses. Toki pona words are not ambiguous, they're just broad. I will now teach you enough toki pona to understand most sentences (assuming you consult the dictionary [https://devurandom.xyz/tokipona/dictionary.html] as you go) in a paragraph shorter than this one: Every sentence has an "verb" or action clause. Most sentences also have a subject clause, which goes before the verb separated by "li". Some sentences also have an "object" or target clause, which goes after the verb clause separated by "e". So "[subject] li [verb] e [object]". All three clauses are any number of words, the first word is the noun (or verb) and the rest are adjectives (or adverbs). If the first word in a sentence is mi or sina you can omit the li in that case only. There is no "is", a sentence like "a flower is red" is just "[a plant] li [red]" because there are no parts of speech and adjectives are verbs. Pronounce everything the way you would in English except "j" sounds like "y". If you see "tawa", "lon", "tan" or "kepeken" in adjective/adverb position that's a preposition, so treat whatever comes after it as a fourth clause. "a" and "n" are interjections and can go anywhere in a sentence. If you see "o", "pi", "la", "taso, "anu" or "en", then you've found one of the few special words (particles) and you should probably either read the book [https://www.amazon.com/dp/B012M1RLXS/] or watch the jan Misali instructional videos [https://www.youtube.com/playlist?list=PLLIjft6ja7DM70MkOMu56c4Grku7LXR61] on YouTube. That's like… almost it!⁶ Watch one youtube video, or read a half page of grammar summary and keep the dictionary open on your phone, and you're basically ready to jump into conversations. (You'll need those last six particles to make nuanced sentences, but sentences do not have to be nuanced.) In my own case I watched the Langfocus video linked at the top and then lazily over the next week watched the jan Misali overview [https://www.youtube.com/watch?v=eLn6LC1RpAo] and two of their instructional videos then read a few chapters of the book, and was already able to construct a full paragraph and be understood by another person: > o! mi sona e toki pona. mi lukin sona e toki mute... taso mi toki ike e toki ale. toki mute li jo e nimi mute. nimi mute li pona ala tawa mi. toki pona li pona e mi tan ni. toki pona li jo nimi lili. nimi lili li pona e me :) (Translation: Hello! I am learning toki pona. I've tried to learn many languages… but I speak all of the[m] badly. Most languages have a lot of words. Lots of words is not good for me. Toki pona is good for me because of this. Toki pona has few words. Few words is good for me :)⁷) So that's week one. By the end of week three (that'll be this past Sunday) I had hit three milestones: * I was able to make a joke in toki pona. Not a good one. * When the joke misfired, I was able to successfully toss off an entire complex paragraph rapidly without really thinking about it. * Probably a sign I Am Getting It more significant than anything else: I realized that talking on the Discord I was dropping toki pona words into my English sentences solely because the toki pona word seemed to me to communicate a concept I wanted to communicate more precisely than any particular English word. (That last one actually kind of excited me when I realized, after the fact, that it had been happening for several days before I noticed it.) All of the above happened on the toki pona Discord, which seems to be the largest and healthiest outpost of toki pona community online⁸ and, I assume therefore, the world. Here's my toki pona joke; you'll notice that I begin by preemptively apologizing for it, but by the end it becomes clear I was, at that moment anyway, apparently completely on the Discord's level:⁹ [https://staging.cohostcdn.org/attachment/d5366ff6-ae17-4c70-a900-a02ac307f108/tokipona_conversation.png] ---------------------------------------- Footnotes ¹ Esperanto was meant to be an auxillary language simple enough the entire world could learn it as a second language. But it does not seem to me to be actually all that simple to learn (the verb tenses may be free of exceptions, but there are still like six of them) and it seems hard to convince myself to study it when I could put that effort toward a more widespread language. Toki Pona on the other hand is a language simple enough the entire world actually could learn it, had it reason to, and the buy-in cost in time is a lot lower. Meanwhile Toki Pona just seems to get certain international-accessibility things right, probably due to the advantage of having over a century of conlang practice largely inspired by Esperanto to draw from. The difference that's most interesting to me, but which I'm also least qualified to evaluate, is that the Toki Pona author had some basic familiarity with, and gave Toki Pona input from, east Asian languages. Both Toki Pona and Esperanto draw roots from a variety of languages but in Esperanto's case this winds up being mostly European languages, mostly Italian, whereas Toki Pona has Mandarin and Cantonese in its mix. Both languages were intended to have a minimal, universal phonology but Esperanto's is not very universal at all and has some consonant sounds that are going to be be totally unfamiliar unless you speak Polish or a language related to Polish. Toki Pona's phonology is actually minimal-- it has the letters in the sentence "mi jan pi ko suwi lete" and nothing else and the legal syllabary is basically hiragana without the combination syllables. Now, what I don't know is whether any of this actually helps speakers of Asian languages in practice or if it just makes surface choices that make it seem that way to a westerner like me. In practice if you find a toki pona speaker their native language is almost certainly English, so there doesn't seem to have been a great deal of testing as to how learnable it is to people from varied regions. ² I kept imagining toki pona as being like LLVM IR for human languages or something. ³ Designing an actually learnable, universal(?) international auxillary language. ⁴ By which I mean if you print the unofficial web version it's 17 pages long. But you can fit it in sixteen if you remove the web-specific introductory paragraph, the "joke word" kijetesantakalu, and the web footer with the "trans rights now!" banner in it. ⁵ There's an awkward nuance in the specific case of prepositions: if you drop a preposition into verb position it still winds up "behaving like" a preposition, it's just that the preposition describes an action. It's probably more accurate to say that the preposition phrase becomes a verb rather than the preposition itself. So for example "mi tawa kalama" means "I went toward the sound" [kamala is a noun and the object of the preposition] not "I went loudly" [as it would be if kamala were an adverb modifying tawa as a verb]. Going into detail on this because I don't want to mislead anyone but "you can form a sentence using an unmodified preposition as a verb" is such a fun fact I...

Many languages have very few odour-related words, so conveying what a scent is like requires knowing your audience

Alex Danco's Newsletter, Season 3, Episode 2

An artist, a programmer and a scientist have created a simulation of extraterrestrial communication to test Earthlings’ ability to understand it
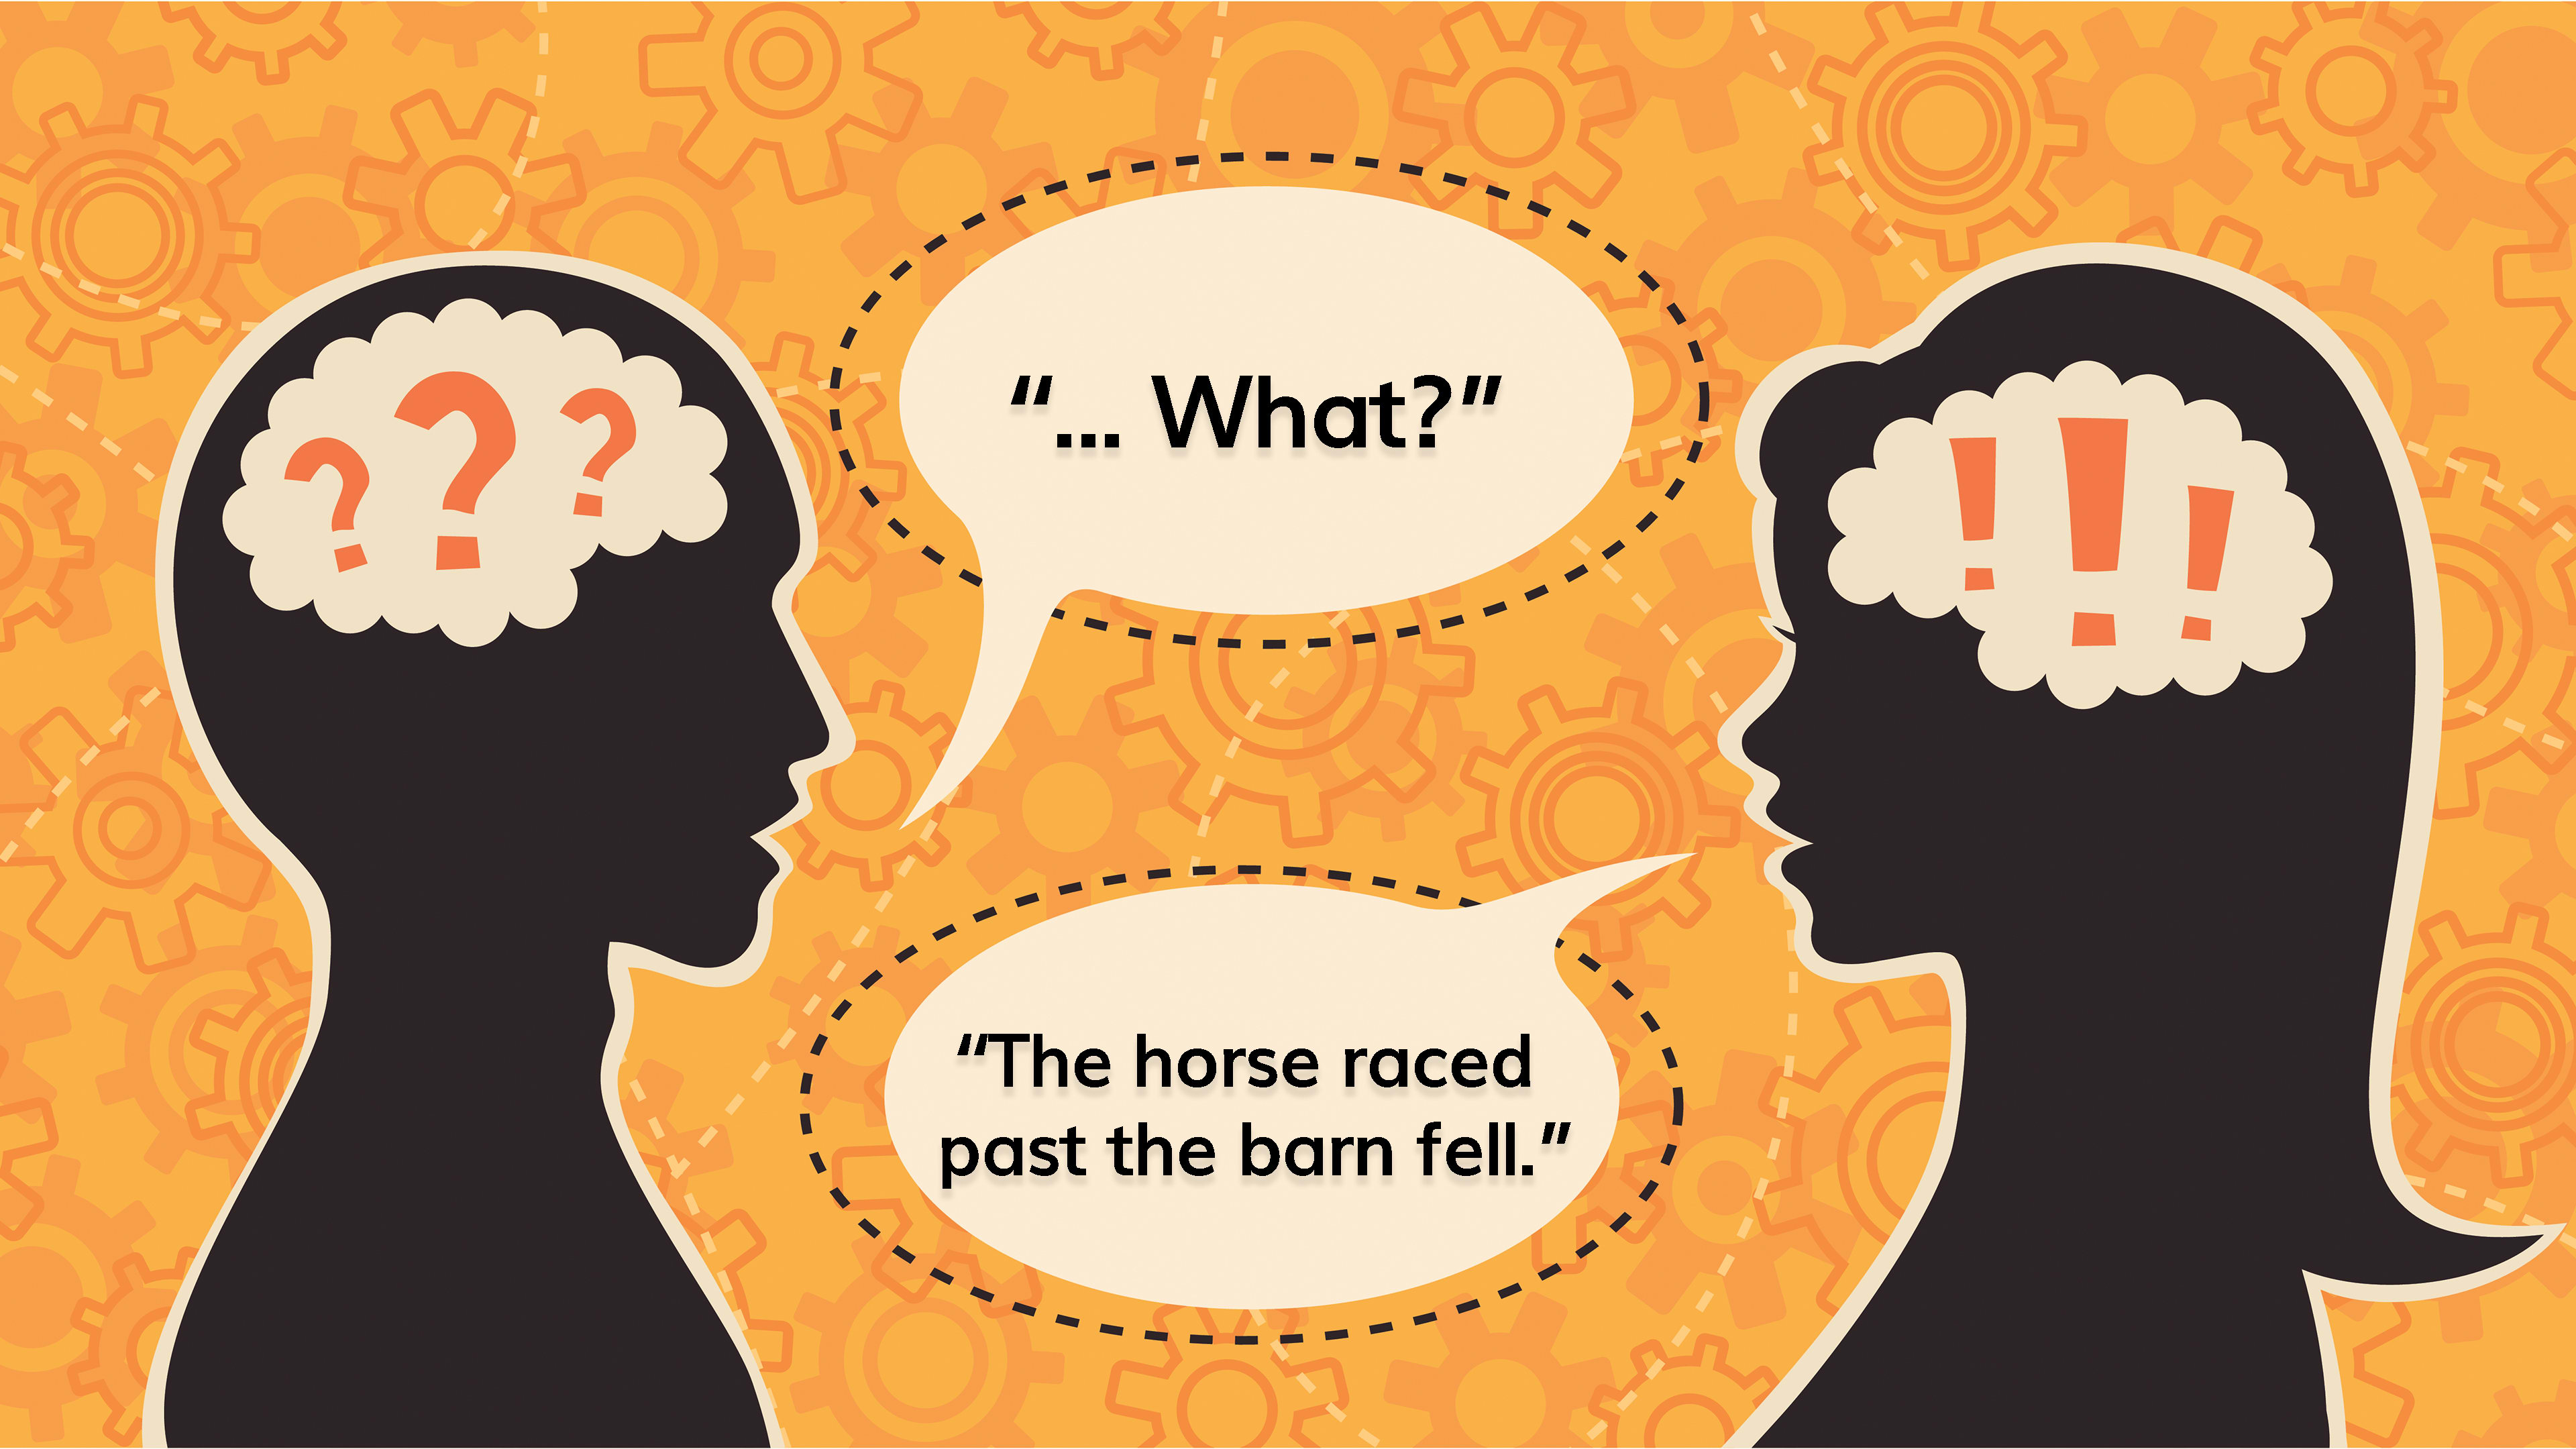
Optical illusions have long captured our imagination, but what about linguistic illusions? A linguistic illusion is a phenomenon in which your judgment or under

Learn about five Chinese tech terms: Huidu, Lunzi, Chendian, Dapan, and Maidian, frequently used in companies like Tencent and ByteDance.

For farmers in Senegal who struggle to read or write, sending voice notes has unlocked a new world of collaboration across the industry.

When first we start learning a new foreign language, any number of its elements rise up to frustrate us, even to dissuade us from going any further: the mountain of vocabulary to be acquired, the grammar in which to orient ourselves, the details of pronunciation to get our mouths around.

To English speakers, the word, “peanut” isn’t especially funny. But “peanut” in Serbian, “kikiriki” is widely considered by Serbs to be the funniest word in their language. This raises the question of why people laugh at some words (“poop”) but not at others (“treadmill”). Does it come down to their meanings? Or are people responding to their sounds? Psycholinguist Chris Westbury set out to discover the answer.

For linguists, the uniqueness of the Basque language is an unsolved mystery. For native speakers, long oppressed, it's a source of pride.

Speaking a second or even a third language can bring obvious advantages, but occasionally the words, grammar and even accents can get mixed up.

French is known as the language of romance, a reputation that, whatever cultural support it enjoys, would be difficult to defend on purely linguistic grounds.
:extract_focal()/https%3A%2F%2Fs3.amazonaws.com%2Fpocket-syndicated-images%2Farticles%2F125%2F1566573732_5d28a5907d711.jpg)
We all know people who talk with their hands. Turns out there’s quite a bit of research around the relationship between language and gestures.

The writing system is 6,000 years old, but its influence is still felt today

Here’s (at least) one interesting way station each of these common words made on its journey to the present day.

We think about what a penguin is like in dozens of different ways—one reason why we often talk past each other

When trying to make language either more concrete or more abstract, one helpful approach is to focus on either the how or the why.

A dialect from the state’s earliest Spanish-speaking settlers has endured for over 400 years in the state’s remote mountain villages. But its time may be running out.

Sometimes, we feel things that we can’t put into words. We can certainly describe things through paragraphs, but finding the exact word to describe our emotions can be limited. It turns out that aside from the common words we used to talk about how we feel, there are other phrases and nouns in English that can describe more complicated human emotions.

The rise, fall, and rediscovery of cuneiform

Mental-health experts say we often use psychology terms incorrectly—and that's a problem

Technological advances in natural language processing, computational linguistics, and machine learning, combined with the digitization of everything from cover letters to conversations, have revolutionized our ability to analyze language, yielding unprecedented insights. Think of it as a new science of language. Many of the findings suggest that small changes in the words we use can increase our ability to persuade and influence others.

What do we lose when we forget about locations like "Troll's Cave" and "Window Claw"?
A major advance in translation technology means that Ukrainians can inform and debunk in real time. The world hasn’t seen a weapon quite like it before.

The 23rd letter of the English alphabet is called a “double u” because it was originally written that way in Old English.

Despite never having been to Ireland, the North Carolina man spoke with a "brogue" until his death, say researchers.

She had perhaps the largest personal dictionary collection in the world. It is certainly the most titillating.

From “lie flat” to “let it rot,” common terms have taken on new meaning in recent years.
When trying to learn a foreign language, most of us have the same complaint:
17K votes, 728 comments. 5.5M subscribers in the coolguides community. Picture based reference guides for anything and everything. If it seems like…

Hundreds of mainland Chinese families have been reunited with missing relatives thanks to the help of a Chinese woman who has taught herself more than 10 of the country’s myriad of dialects.

Often portrayed as the result of a revolutionary pro-literacy movement, many “simplified” characters have existed for hundreds of years.

Languages from Hindi to Korean tone down swear words by inserting gentler consonants into speech. Here’s how “Let’s go Brandon” got started
Advanced technologies like A.I. are enabling scientists to learn that the world is full of intelligent creatures with sophisticated languages, like honeybees. What might they tell us?

The first obvious casualty of large language models is homework: the real training for everyone, though, and the best way to leverage AI, will be in verifying and editing information.

An accessible introduction to the study of language in the brain, covering language processing, language acquisition, literacy, and language disorders.Neurol...

The movie's screenwriter talks about the creation of the story's extraterrestrial language and the importance of communication.

This collection of 5 courses is intended to help NLP practitioners or hopefuls acquire some of their lacking linguistics knowledge.

What makes this utterance the “universal word”?

The languages we speak can have a surprising impact on the way we think about the world and even how we move through it.

A professional explains why brand names have gotten weirder.

Scientist Gary Marcus argues that “deep learning” is not the only path to true artificial intelligence.

The science of these viral mash-ups reveals why they are so effective at spreading ideas and beliefs.

Learning a language is challenging but extremely rewarding. Try one of these excellent apps to help you get started.

According to experts, it's unlike any word, in any language.

No one person can take credit for the invention of American Sign Language. Its history reaches back to the early 19th century, when forms of sign developed among Deaf communities in New England.
Scientists are using machine learning to eavesdrop on naked mole rats, fruit bats, crows and whales — and to communicate back.

The Sumerians, Maya and other ancient cultures created texts that have lasted hundreds and even thousands of years. Here's what they can teach us about crafting an immortal message.

Sometimes you can say more with humor than with a polished speech or marketing spot.


The Kusunda language has no known origin and a number of quirks, like no words for "yes" or "no". It also has only one fluent speaker left, something linguists are racing to change.

A pocket guide to Neapolitan nonverbal communication.
/https://tf-cmsv2-smithsonianmag-media.s3.amazonaws.com/filer_public/25/6d/256d43a2-c068-4e59-9dea-0f6de8619dcc/elamite.jpg)
Linear Elamite, a writing system used in what is now Iran, may reveal the secrets of a little-known kingdom bordering Sumer
:extract_focal()/https%3A%2F%2Fpocket-syndicated-images.s3.amazonaws.com%2Farticles%2F8082%2F1658959537_62e1b63275014.png)
Neuroscience has found that gestures are not merely important as tools of expression but as guides of cognition and perception.
:extract_focal()/https%3A%2F%2Fpocket-syndicated-images.s3.amazonaws.com%2Farticles%2F8086%2F1658968616_ScreenShot2022-07-27at5.36.50PM.png)
It’s all because of the similarities between words.

Our sensory systems for hearing and touch overlap to stir a wealth of emotions.
:extract_focal()/https%3A%2F%2Fpocket-syndicated-images.s3.amazonaws.com%2Farticles%2F8053%2F1657930128_GettyImages-1316782012.jpg)
There’s ancient evidence for the custom of shaking hands, but did it mean the same thing then as it does today?
:extract_focal()/https%3A%2F%2Fpocket-syndicated-images.s3.amazonaws.com%2Farticles%2F8041%2F1657852079_GettyImages-1195958069.jpg)
Psychologists, neuroscientists and philosophers are trying to understand humor.

Although the default answer to almost every question, request or suggestion is a disheartening ‘non’, a ‘oui’ is often hiding in the context of what is being said.

The Sanaa Palimpsest has a number of unique characteristics, not least as an enduring artefact of Quranic scribal methods and of Islamic heritage within Yemen. Yet deciphering the text poses theological quandaries surrounding Quranic tradition.


At the crossroads of south and central Asia lies one of the world’s most multilingual places, with songs and poetry to match
From a neurological and evolutionary perspective, music is fascinating. There seems to be a deeply rooted biological appreciation for tonality, rhythm, and melody. Not only can people find certain sequences of sounds to be pleasurable, they can powerfully evoke emotions. Music can be happy, sad, peaceful, foreboding, energetic or comical. Why is this? Music is

The singular form of 'they' has been endorsed by writers like Jane Austen and William Shakespeare.

Researchers at MIT are investigating the brain of a woman, known by her initials EG, with a missing temporal lobe.
The centuries-old texts were erased, and then written over, by monks at Saint Catherine’s Monastery in Egypt
There are words which have special meaning within each culture and carry power where they are used.
How we applied qualitative learning, human labeling and machine learning to iteratively develop Airbnb’s Community Support Taxonomy.

Christine Schreyer is a linguistic anthropologist who researches the people who invent new tongues and seek to sustain ancient ones.
Lifehacker reader Gabriel Wyner was tasked with learning four languages in the past few years for his career as an opera singer, and in the process la

In this map of laughter around the world you will be able to see how haha is written in different countries depending on their languages.

Nonhuman creatures have senses that we’re just beginning to fathom. What would they tell us if we could only understand them?

“No matter how it was collected, where it was collected, when it was collected, our language belongs to us," said Ray Taken Alive, a Lakota teacher.

No, English isn’t uniquely vibrant or mighty or adaptable. But it really is weirder than pretty much every other language
:extract_focal()/https%3A%2F%2Fmelmagazine.com%2Fwp-content%2Fuploads%2F2020%2F02%2Ffarside.jpg)
There couldn’t be a ‘Is This a Pigeon?’ without a ‘Beware of Doug’.

The tools we use to help us think—from language to smartphones—may be part of thought itself.
24K votes, 10K comments. 49M subscribers in the AskReddit community. r/AskReddit is the place to ask and answer thought-provoking questions.

Have you ever had a brain fart and couldn't remember some common word or term that you needed to use? You can often get the point across by using whatever words might be close. That's how a peacock becomes a "disco chicken," or a cow can be called a "moo beast." In an AskReddit thread, people tell funny stories of folks communicating the best they can when the exact word escapes them. Couldn't remember groomsmen, went with dudesmaids instead.I forgot the word for ‘exterminator’ so I used...

Before humans stored memories as zeroes and ones, we turned to digital devices of another kind — preserving knowledge on the surface of fingers and palms. Kensy Cooperrider leads us through a millennium of “hand mnemonics” and the variety of techniques practised by Buddhist monks, Latin linguists, and Renaissance musicians for remembering what might otherwise elude the mind.

In a city where diplomats and embassies abound, where interpreters can command six-figure salaries, where language proficiency is résumé rocket fuel, Vaughn Smith was a savant with a secret.

Neuroscientists are exploring whether shapes like squares and rectangles — and our ability to recognize them — are part of what makes our species special.
:extract_focal()/https%3A%2F%2Fimages.theconversation.com%2Ffiles%2F447596%2Foriginal%2Ffile-20220221-26-jyl7nz.png%3Fixlib%3Drb-1.1.0%26rect%3D19%252C0%252C1578%252C900%26q%3D20%26auto%3Dformat%26w%3D320%26fit%3Dclip%26dpr%3D2%26usm%3D12%26cs%3Dstrip)
Is there a connection between sound and meaning?
The Inca are most often remembered not for what they had but for what they didn’t have: the wheel, iron, a written language. This third lack has given rise to a paradox, the Inca paradox. Could it …
Maybe it has happened to you: a stranger catches your eye while you peruse the plant identification section of the library, or wander a mossy hillock speckled with Amanita bisporigera, or shuffle a…

5 endangered languages you can learn via Duolingo, Memrise, and online platforms like Hawaiian, Yiddish, Cornish, Greenlandic, and Navajo.

Linguistic games and research are revealing a hidden connection between what words look and sound like, and what they mean.

In most languages, sounds can be re-arranged into any number of combinations. Not so in Al-Sayyid Bedouin Sign Language.Brian Goodman via Shutterstock Languages, like human bodies, come in a variety of shapes—but only to a point. Just as people don’t sprout multiple heads, languages tend to veer away from certain forms that might spring from […]

A special class of vivid, textural words defies linguistic theory: could ‘ideophones’ unlock the secrets of humans’ first utterances?

In fascinating study involving synesthesia, people make good guesses at meanings of foreign words

Machine learning can translate between two known languages, but could it ever decipher those that remain a mystery to us?

PDF | Despite 800 million illiterate people worldwide little research has aimed at understanding how they use and appropriate mobile phones. We... | Find, read and cite all the research you need on ResearchGate

Every so often a news article will make the rounds of the internet – or, for that matter, a paper will be published in an academic journal – presenting a new ‘decipherment’ …

Mark Forsyth tasted internet fame this week when a passage from a book he wrote went viral. He explains more language secrets that native speakers know without knowing.


URLs like 4008-517-517.com mean a lot more than they appear.
A visual language is just like any other form of communication. Elements from color to style to type of photos or illustrations establish what a brand or company is. A visual language includes both the written and spoken elements of a website or brand, as well as every design technique, photo,…

“It was a matter of really reading between the lines of the script.”

Rax King’s ode to cringeworthy culture – Lindsay Zoladz
:extract_focal()/https%3A%2F%2Fwww.stylist.co.uk%2Fimages%2Fapp%2Fuploads%2F2017%2F11%2F17144738%2Fin-spades-crop-1581951479-1268x845.jpeg%3Fw%3D1200%26h%3D1%26fit%3Dmax%26auto%3Dformat%252Ccompress)
The origins, meaning, and authors behind 50 popular phrases and sayings.

NuqneH! Saluton! A linguistic anthropologist (and creator of the Kryptonian language, among others) studies the people who invent new tongues.

We have been bombarded with negativity recently; but the English language is a treasure trove of joyous vocabulary, says Susie Dent, a lexicographer and etymologist


:extract_focal()/https%3A%2F%2Fpocket-syndicated-images.s3.amazonaws.com%2Farticles%2F7296%2F1636604397_GettyImages-925084496.jpg)
You don’t get where you want to be without practice. Here’s how and what to practice.
:extract_focal()/https%3A%2F%2Fpocket-syndicated-images.s3.amazonaws.com%2Farticles%2F4903%2F1593442720_16442_cd3b6e78242b4c8faa986194ba2bfc58.png)
Once we acquire language, we can live without it.

The quest to decode hieroglyphic writing.

The distinctive Americanism is making its way across the world and becoming an unlikely favourite catch-all term.

In 2018, the team at Facebook had a puzzle on their hands. Cambodian users accounted for nearly 50% of all global traffic for Messenger's voice function, but no one at the company knew why, according to documents released by whistleblower Frances Haugen. From a report: One employee suggested running...
Although I’ve successfully learned the language of mathematics, it has always frustrated me that I couldn’t master those more unpredictable languages like French or Russian that I’d tried to learn …

Although it was the language of sacred texts and ritual, modern Hebrew wasn't spoken in conversation till the late nineteenth century.
An ambitious project is attempting to interpret sperm whale clicks with artificial intelligence, then talk back to them.
What can hyperpolyglots teach the rest of us?

Using hand gestures might feel like an intuitive way to communicate across language barriers, but their meaning can change, and there are few universal signs that everyone agrees on.
:extract_focal()/https%3A%2F%2Fpocket-syndicated-images.s3.amazonaws.com%2Farticles%2F3690%2F1704766769_signlanguage1.jpg)
An ASL interpreter shares some travel-friendly tips and techniques that she’s learned from the Deaf community, the real masters of cross-cultural communication.

NICHOLAS SWIFT Can we really hear the ancients speak?

There I was, a clumsy, decaf-drinking 25-year-old British man in a swanky Buenos Aires radio station, being ridiculed by Viggo Mortensen. But even as he laid into me — his jokes later leading to my…

According to Amanda Montell’s new book, “Cultish,” the jargon and technical language of fanaticism is surprisingly common.

It likely explains why the French have the reputation of being so demonstrative about love – because if you can't really say it, you have to show it.

Knowing some Latin has its advantages

Jack may have been climbing that beanstalk for more than 5,000 years
European ideas of African illiteracy are persistent, prejudiced and, as the story of Libyc script shows, entirely wrong
The online etymology dictionary (etymonline) is the internet's go-to source for quick and reliable accounts of the origin and history of English words, phrases, and idioms. It is professional enough to satisfy academic standards, but accessible enough to be used by anyone.
Introduces the elephant ethogram: A Library of African Elephant Behavior
An anonymous reader quotes a report from Scientific American: Elephants possess an incredibly rich repertoire of communication techniques, including hundreds of calls and gestures that convey specific meanings and can change depending on the context. Different elephant populations also exhibit cultu...

For decades, Taiwan’s minority Hakka people were banned from teaching their native language. Now an unlikely coalition of aging academics and millennial radio DJs are doing all they can to keep it alive.

A deep dive into xenolinguistics, pragmatics, the cooperative principle, and Noam Chomsky!

natural language processing, nlp, machine learning, computer science

Trading Pit History - hand signals of open outcry pit trading

People tend to think of digital media as entertainment, so they devote less mental effort than when they’re reading a printed book.

The verb decide has deadly interesting origins. Though it came through Middle English deciden , Old French decider , and Latin decidere , you can tell that there's the prefix de- , kind...

The way your name or a word rolls off the tongue can have some surprising effects on the judgements we make.
While captive in a Navy program, a beluga whale named Noc began to mimic human speech. What was behind his attempt to talk to us?

The evolution of the slur's use — and the taboo around it — tells a story about what our culture values.

Many nationalities recognise that there is a tone of voice that is instantly alluring, but do some speakers have an unfair advantage?
Artificial intelligence may help us decode animalese. But how much will we really be able to understand?

Good finales offer catharsis. The best deny us closure altogether.

In what may be the largest interspecies communication effort in history, scientists plan to use machine learning to try to decode what Sperm whales say to one another. National Geographic reports: [Sperm whales "speak" in clicks, which they make in rhythmic series called codas. Shane Gero, a Canadi...

Could understanding other cultures’ concepts of joy and well-being help us reshape our own?

The Penobscot language was spoken by almost no one when Frank Siebert set about trying to preserve it. The people of Indian Island are still reckoning with his legacy.

Pre-processing Arabic text for machine-learning using the camel-tools Python package

Forget about fluency and how languages are taught at school: as an adult learner you can take a whole new approach

The undecipherable rongorongo script of Easter Island

Your Free Idioms Dictionary Idioms are phrases whose meanings cannot easily be known from the meanings of each word in the phrase. They usually have a fixed form that resists being altered without changing the meaning of the phrase. While idioms are quite transparent to native speakers of a languag

The Klingon language remains relevant to today’s culture and continues to evolve in surprising ways. (Finally, you must be thinking, some Star Trek content.)
:extract_focal()/https%3A%2F%2Fs3.amazonaws.com%2Fpocket-collectionapi-prod-images%2F4673151e-fe31-4fa0-ac9c-1fa8fead13a1.jpeg)
Handy words from other languages with no English equivalent.
Essentials Guide to Japanese: The Mental Model by Japanese Complete. Master Japanese, get started for free.

The Armenian alphabet is a true masterpiece of its era and knows many secrets. However, there is one in particular that still blows my mind. As some people know the Armenian alphabet was (re)invented in 405 AD by the Armenian linguist and theologian Mesrop Mashtots with the help of the patriarch Sahak Partev and the […]

Talking out loud to oneself is a technology for thinking that allows us to clarify and sharpen our approach to a problem

How we evolved to read is a story of one creative species.
Algorithms for text analytics must model how language works to incorporate meaning in language—and so do the people deploying these algorithms. Bender & Lascarides 2019 is an accessible overview of what the field of linguistics can teach NLP about how meaning is encoded in human languages.
:extract_focal()/https%3A%2F%2Fpocket-syndicated-images.s3.amazonaws.com%2Farticles%2F4558%2F1591195145_ezgif.com-webp-to-jpg122.jpg)
Here are a few lucky words that have been preserved in common English expressions.
Frantastique, the daily French workout. Personalized online Frantastiquelessons: all levels, all users. Free test.
(Also posted on Medium)

Three years ago today, the 33 members of the Bluffton University baseball team boarded a bus at their campus in Bluffton, Ohio. It was early evening, a ...

The origins of language are not what inherited disorders seemed to suggest.
:extract_focal()/https%3A%2F%2Fpocket-syndicated-images.s3.amazonaws.com%2Farticles%2F1895%2F1621968717_GettyImages-1000501530.jpg)
In a fascinating look at language, a professor lays out how political parties can sway supporters with tiny tweaks in word choice.

Machines work with words by embedding their relationships with other words in a string of numbers.

:extract_focal()/https%3A%2F%2Fs3.amazonaws.com%2Fpocket-syndicated-images%2Farticles%2F441%2F1566927840_5d373c81790dc.jpg)
Everyone knows a Nguyen, but how did that come to be?
:extract_focal()/https%3A%2F%2Fassets.atlasobscura.com%2Fmedia%2FW1siZiIsInVwbG9hZHMvYXNzZXRzL2M4MDdkMGJhYmYyOTZmM2VmM180YTMxODI5di5qcGciXSxbInAiLCJjb252ZXJ0IiwiLWF1dG8tb3JpZW50ICJdLFsicCIsInRodW1iIiwiOTk1eDY2MysxNSs1MyJdLFsicCIsImNvbnZlcnQiLCItcXVhbGl0eSA4MSAtYXV0by1vcmllbnQiXSxbInAiLCJ0aHVtYiIsIjEyODB4PiJdXQ%2F4a31829v.jpg)
A linguistic exploration.

Eight tips I wish I had known when I started. Learning Chinese is hard, but if you take the right approach, you'll be speaking, reading and writing soon!

On rongorongo, which no one can decipher.

He did not, visionary though he was, conceive of one extraordinary use to which wax cylinders might be put—the recovery or reconstruction of extinct and endangered indigenous languages and cultures in California.

Livecoding event with Christopher Wolfram on the process he went through and the code generated in building the alien language for the movie Arrival.

Scholars have struggled to identify fragments of the epic of Gilgamesh — one of the world’s oldest literary texts. Now A.I. has brought an “extreme acceleration” to the field.

When Spanish meets English, new dialects emerge – giving us real-time insight into language evolution, linguists say.
-->
streamlit (python)
categories:
tags: python streamlit
date: 03 Apr 2025
slug:streamlit
Bringing Order to a Python Streamlit App Through an Organised Project Folder Structure


Learn about the most commonly used Streamlit commands and build a customized web application.
Customizable Streamlit AgGrid data table connected to a Google Sheets Database

Streamlit was designed to help data scientists but it’s not just about data, adding media to your apps helps to communicate your ideas
Streamlit may not have been designed for full-blown websites, but it is fairly straightforward to create multiple pages in a single app
Number 2 is by far my favorite

Level-Up Your Streamlit Skills with A Real-World Use Case and Complete Code Example
Create, deploy, and test your Python applications, analyses, and models with ease using Streamlit Key Features Learn how to showcase machine learning models in a Streamlit application effectively and efficiently … - Selection from Getting Started with Streamlit for Data Science [Book]
Streamlit releases v1.0 of its DataOps platform for data science apps to make it easier for data scientists to share code and components.
Hello everyone, This is a step by step tutorial about how to deploy your Streamlit app to Heroku. ...
An aspiring Full Stack Developer’s guide to quickly developing and deploying scalable web applications

With Streamlit creating a deploying a web app can be very easy!
Present your data as an interactive dashboard web application using the python library Streamlit
Using Streamlit to Build an ML-based Web Application

Deep dive into Streamlit with Airbnb data
Sometimes you make a data science , machine learning or computer vision projects but suddenly you stu...
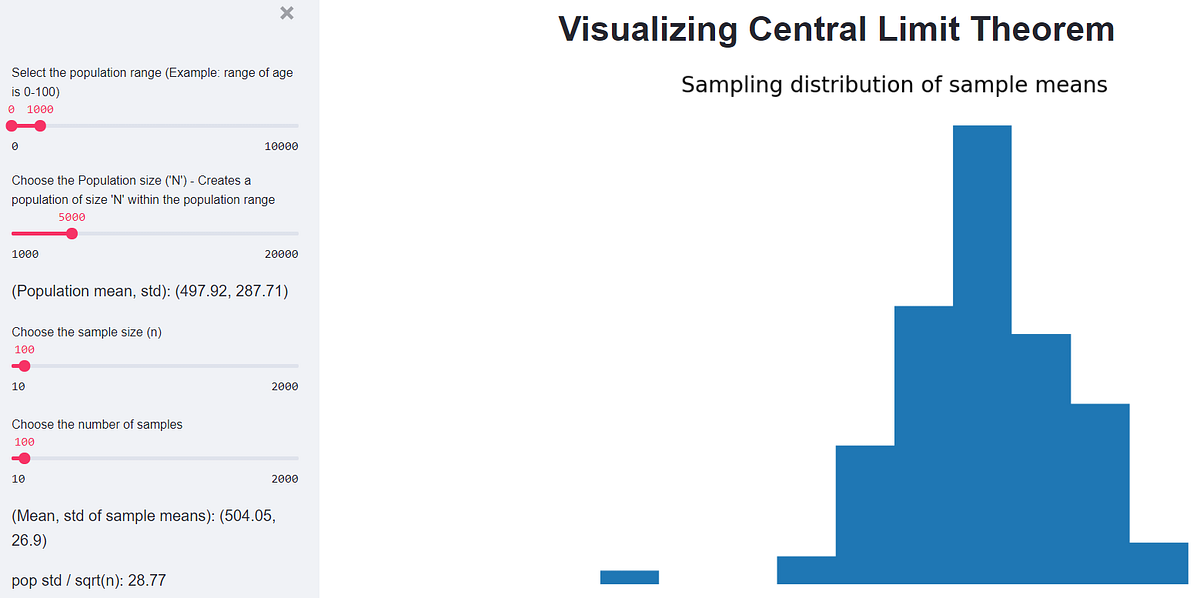
This article demonstrates the deployment of a basic Streamlit app (that simulates the Central Limit Theorem) to Heroku.

This article demonstrates the deployment of a basic Streamlit app (that predicts the Iris’ species) to Streamlit Sharing.

The quickest way to embed your models into web apps.

A Step-by-Step Guide to Host your Models!
We’ll show you how to quickly build a Streamlit app to synthesize celebrity faces using GANs, Tensorflow, and st.cache.
-->
virality (prodmgmt)
categories:
tags: prodmgmt startups virality
date: 03 Apr 2025
slug:virality
Your #1 resource for digital marketing tips, trends, and strategy to help you build a successful online business.

Word of mouth is powerful... but this follow-up question allows you to harness that power to supercharge your marketing. Use it wisely and carefully.
Your #1 resource for digital marketing tips, trends, and strategy to help you build a successful online business.

Make your brand messages viral with the 6 STEPPS from Jonah Berger's Contagious, including 75 real-life marketing examples to learn from.
This is the first post in a three post series on user acquisition. The topic of this blog post may seem simplistic to those of you who have been in the trenches, working hard to grow visits and vis…
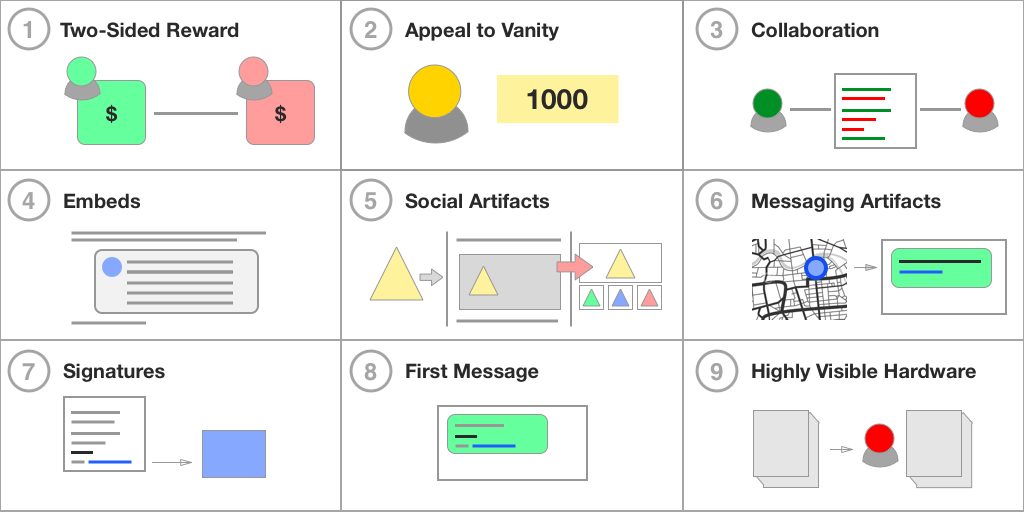
If your startup is building a consumer product, your product has to be viral. For consumer products, the average revenue per user tends to…

and choosing the right one for your product to grow

This is the second post in a three post series on user acquisition. In the first post in this series, we covered the basics of the five sources of traffic to a web-based product. This next post co…

B.J. Mendelson breaks down how Batman is a growth hacker, and what we can learn about the field from him.

We all know about the Paypal, Hotmail, and Airbnb growth hacks. Here are 28 new growth hack examples to help you market your web and mobile

How can I make my content go viral? I sat down with the viral marketing geniuses Marc and Angel to discuss content marketing and other key tips.
Yesterday RapGenius posted the following announcement on their Facebook page: As a contributor to various blogs and an endearing fan of RapGenius, I took

Guest How to get a two-sided marketplace startup like Airbnb, Exec, or eBay up and running -- the painless way.

This is an edited version of a recent online conversation I had with a team of bootstrappers about how to make their product attract early adopters.
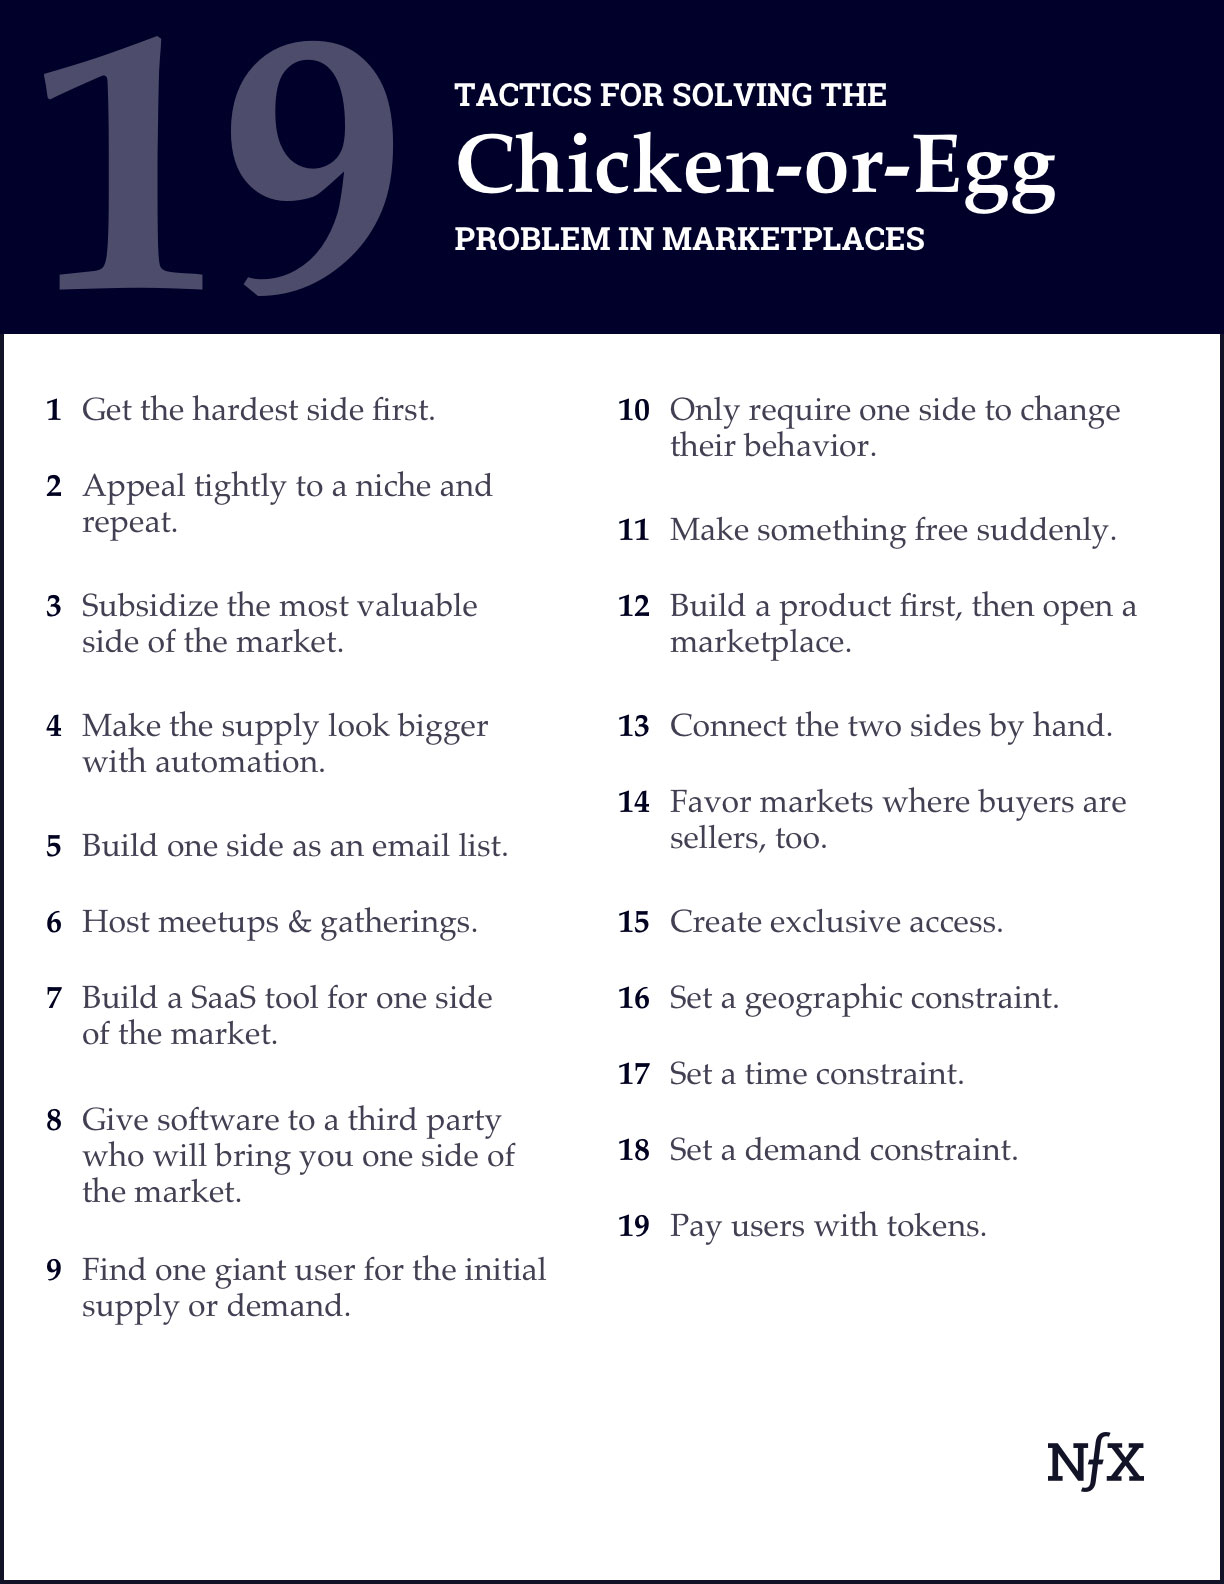
An inside look at 19 tactics top marketplaces have used to solve the chicken-or-egg problem and kickstart growth.
Today, we’re sharing the newest social nfx we've identified—the 15th type of network effect: Tribal Network Effects.

When Megan Thee Stallion took off her bright orange mask and walked onstage to accept her Grammy on March 14, she fought back tears and thanked God, her mother, and her managers for helping her become the first female rapper to win the award for best new artist in two decades.
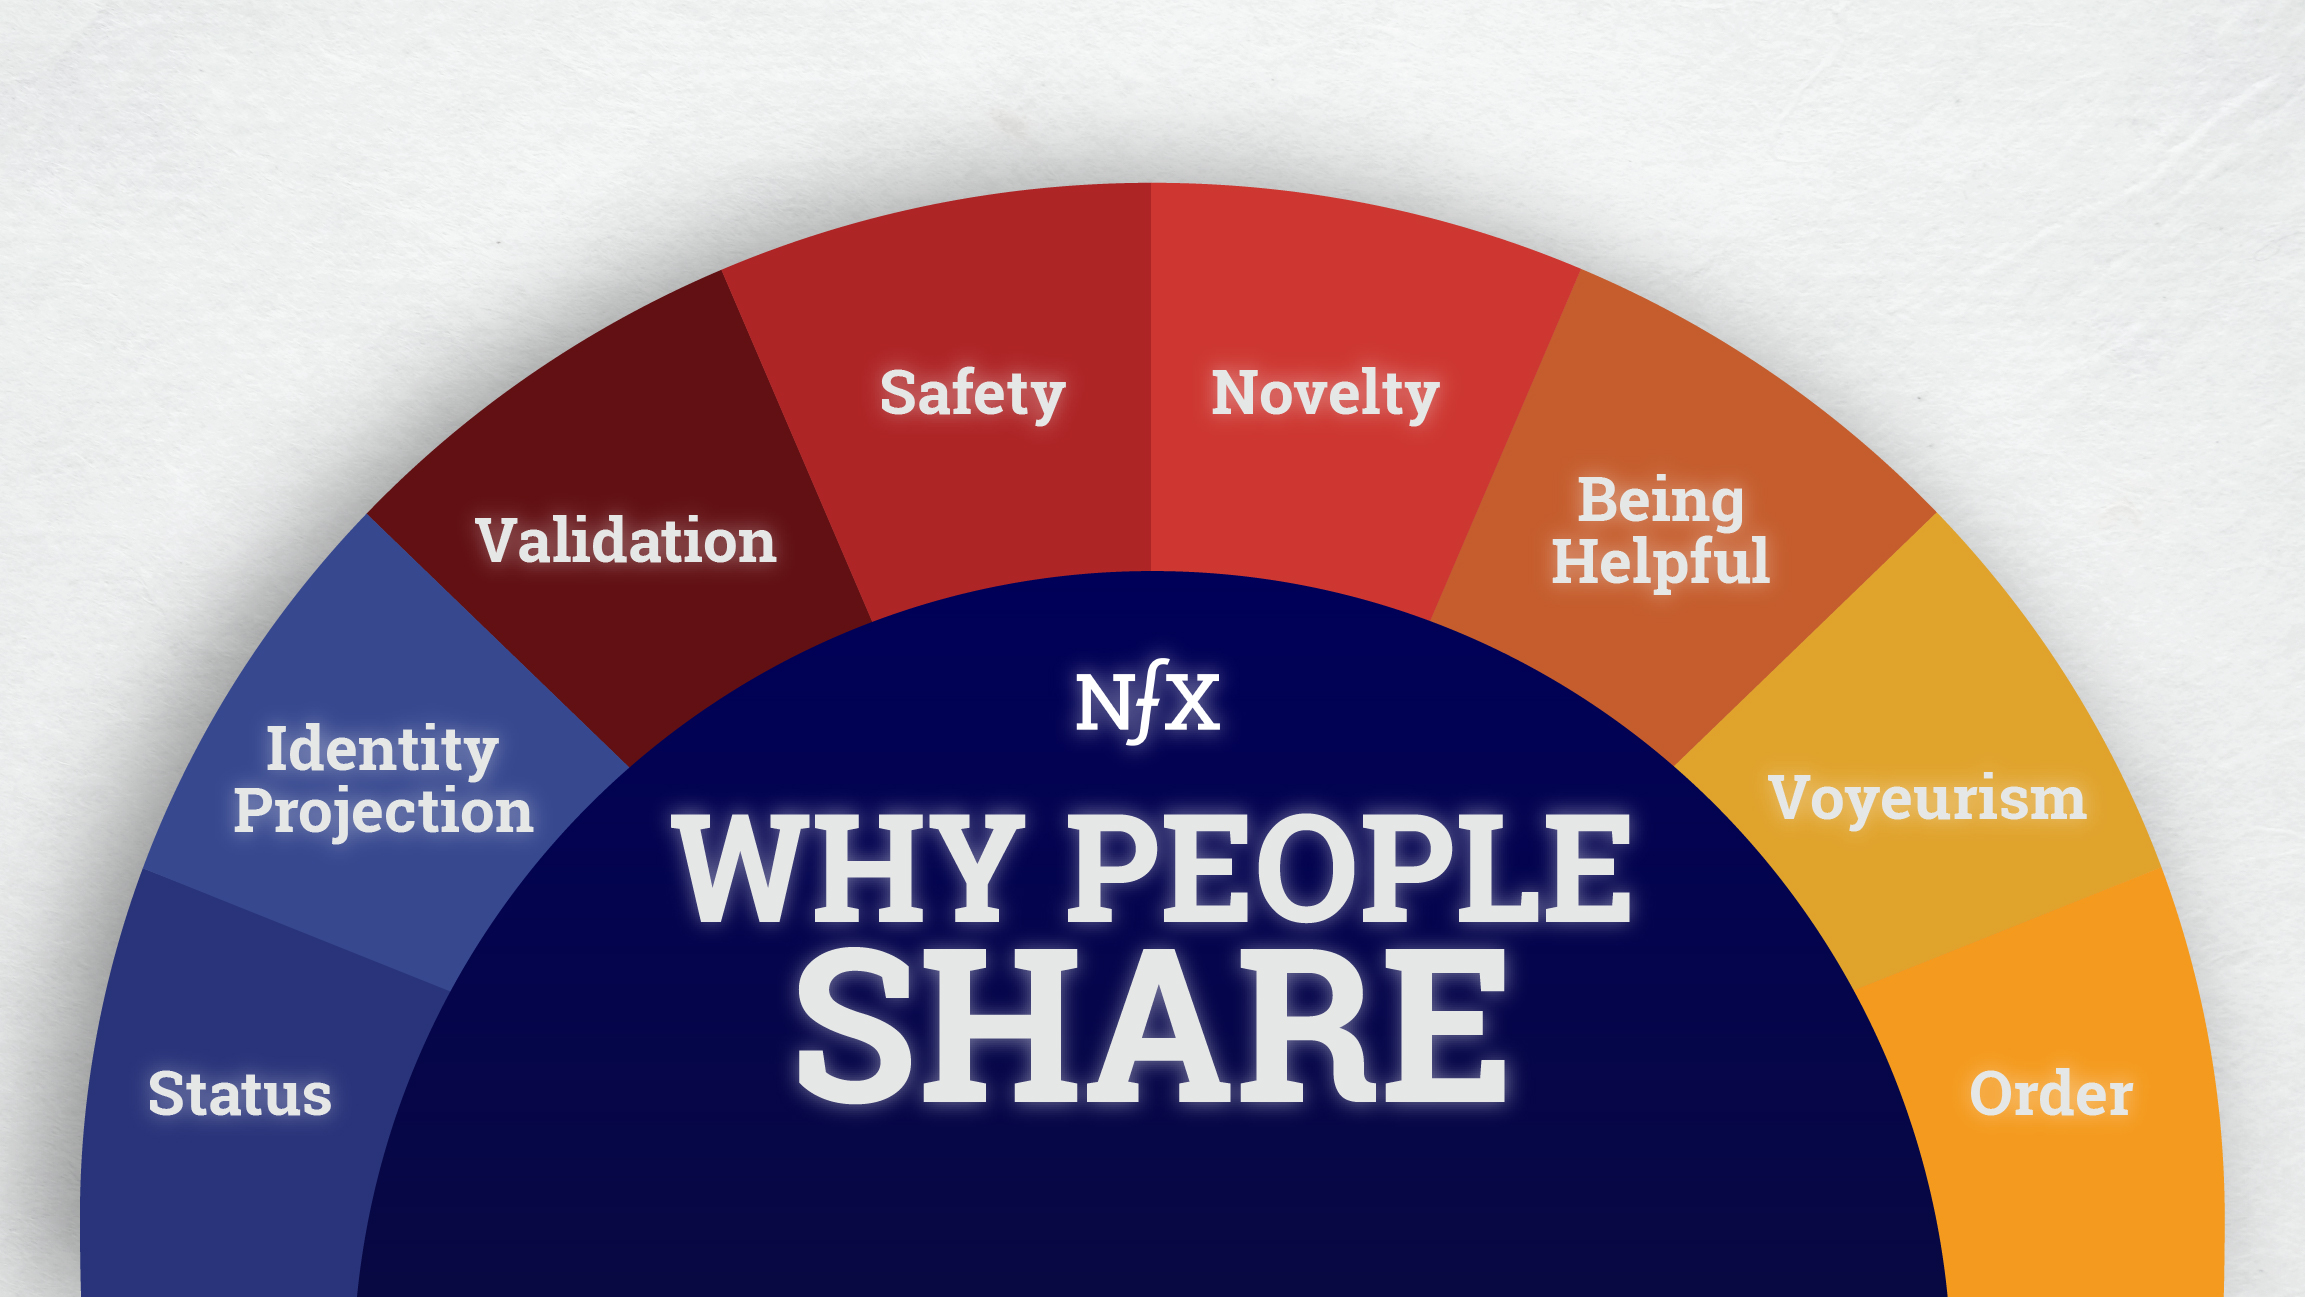
James Currier is making public the "8 Motivation Clusters" that cause people to share—to help Founders engineer virality into their products.

As much as marketers would like to control the narrative around their brands doing so is a fallacy.

This is an edited, updated version of an essay I wrote in 2008 when this now popular idea was embryonic and ragged. I recently rewrote it to convey the core ideas, minus out-of-date details. This revisited essay appears in Tim … Continue reading →

Adam Kucharski wrote The Rules of Contagion before Covid-19. He talks about misinformation, bank failures, and coming up with hypotheses during a crisis.

Kevin Kwok had a great essay the other day on Figma, and how its runaway success is based on hundreds of successful loops baked into its product and business model: Why Figma Wins | Kevin Kwok It g…
Canva are one of Australia's most successfull startups. In this case study we analyse how they use digital channels to attract and acquire new users
Some of the most successful companies and products have been predicated on the concept of network effects, where the network becomes more valuable to users as more people use it… if managed well. But you can’t manage what you can’t measure. So, what metrics should you look at to determine if you even have network...
We’ve defined network effects — from what they are and aren’t to how to measure and manage them in practice — but network effects have still always been hotly debated: Where are they, are they real, are they enduring… and so on. So in this second video of our three-part miniseries on network effects, a16z...
Some of the most successful companies and products — from the phone era to the internet era — have all been predicated on the concept of network effects, where the network becomes more valuable to users as more people use it. But how do you tell network effects apart from scale effects, brand preference, or...
Art has always had a strange relationship with copying.
-->
bragging (behavior)
categories:
tags: behavior
date: 03 Apr 2025
slug:bragging

After feeling belittled, I journey into the heart of bragging and discover 17 modes of showing off.

From veganism to fundraising, psychologists have found acts of altruism often attract mistrust and even anger

How narcissists use "narcissistic supply" to exploit relationships.
-->
adversarial nets (deep learning)
categories:
tags: adversarial deep-learning
date: 03 Apr 2025
slug:raindrop-adversarial
The ability of the Generative Adversarial Networks (GANs) framework to learn generative models mapping from simple latent distributions to arbitrarily complex data distributions has been...


In a preprint paper, researchers at Johns Hopkins detail TrojAI, a framework for hardening AI models against adversarial attacks.

I bet most of us have seen a lot of AI-generated people faces in recent times, be it in papers or blogs. We have reached a stage where it is becoming increasingly difficult to distinguish between actual human faces and faces that are generated by Artificial Intelligence. In this post, I will help the reader to understand how they can create and build such applications on their own. I will try to keep this post as intuitive as possible for starters while not dumbing it down too much. This post is about understanding how GANs work.

A blog about Compressive Sensing, Computational Imaging, Machine Learning. Using priors to avoid the curse of dimensionality arising in Big Data.

What we'd like to find out about GANs that we don't know yet.

Nvidia's GauGAN tool has been used to create more than 500,000 images, the company announced at the SIGGRAPH 2019 conference in Los Angeles.
Emil Mikhailov is the founder of XIX.ai [http://XIX.ai] (YC W17). Roman Trusov is a researcher at XIX.ai. Recent studies by Google Brain have shown that any machine learning classifier can be tricked to give incorrect predictions, and with a little bit of skill, you can get them to give pretty much any result you want. This fact steadily becomes worrisome as more and more systems are powered by artificial intelligence — and many of them are crucial for our safe and comfortable life. Banks, sur
-->
docker (devops tools)
categories:
tags: containers devops docker
date: 03 Apr 2025
slug:raindrop-docker

Learn how to use Ollama and Open WebUI inside Docker with Docker compose to run any open LLM and create your own mini ChatGPT.

Here's an overview of the Docker Compose file components and various commands you can use to manage them.

In recent years, Docker has revolutionized the way software is developed, shipped, and deployed. It...

In the realm of containerization, Docker has long been hailed as the go-to platform for developers....
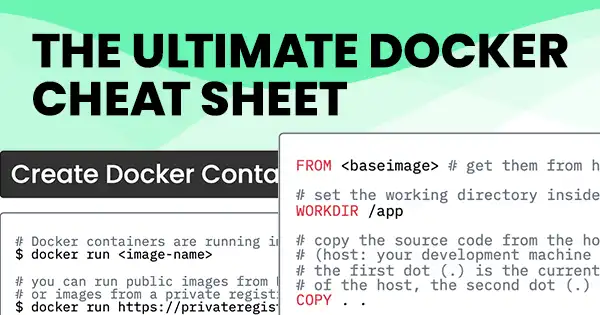
Get your Docker Cheat Sheet as PDF or PNG. In this article, you learn how to write Dockerfiles, build images, and run them as container.

Now available in a beta, Rails 7.1 will generate all Dockerfiles needed for deployment, tuned for production use.

Scaling becomes a necessary part for your system when your system grows in popularity. There are two...

What is docker? and how to use it with ruby on rails applications? and benefits of using...

Serie of sketchnotes about Docker. Explaining in a visual way Docker principles.
Running Rails from Docker for easy start to development - rails/docked

The most common Docker command is also a versatile command. Learn a few usages of the docker ps command.
Learn the difference between Docker images and containerscontainers and images are different + practical code examples
Read our blog to find the latest Docker updates, news, technical breakdowns, and lifestyle content.

If you don’t already know, Docker is an open-source platform for building distributed software using “containerization,” which packages applications together with their environments to make them more portable and easier to deploy.


Docker is a platform designed to help developers build, share, and run container applications. We handle the tedious setup, so you can focus on the code.

With an Infographic and Cheatsheet

Modern application infrastructure is being transformed by containers. The question is: How do you get started?
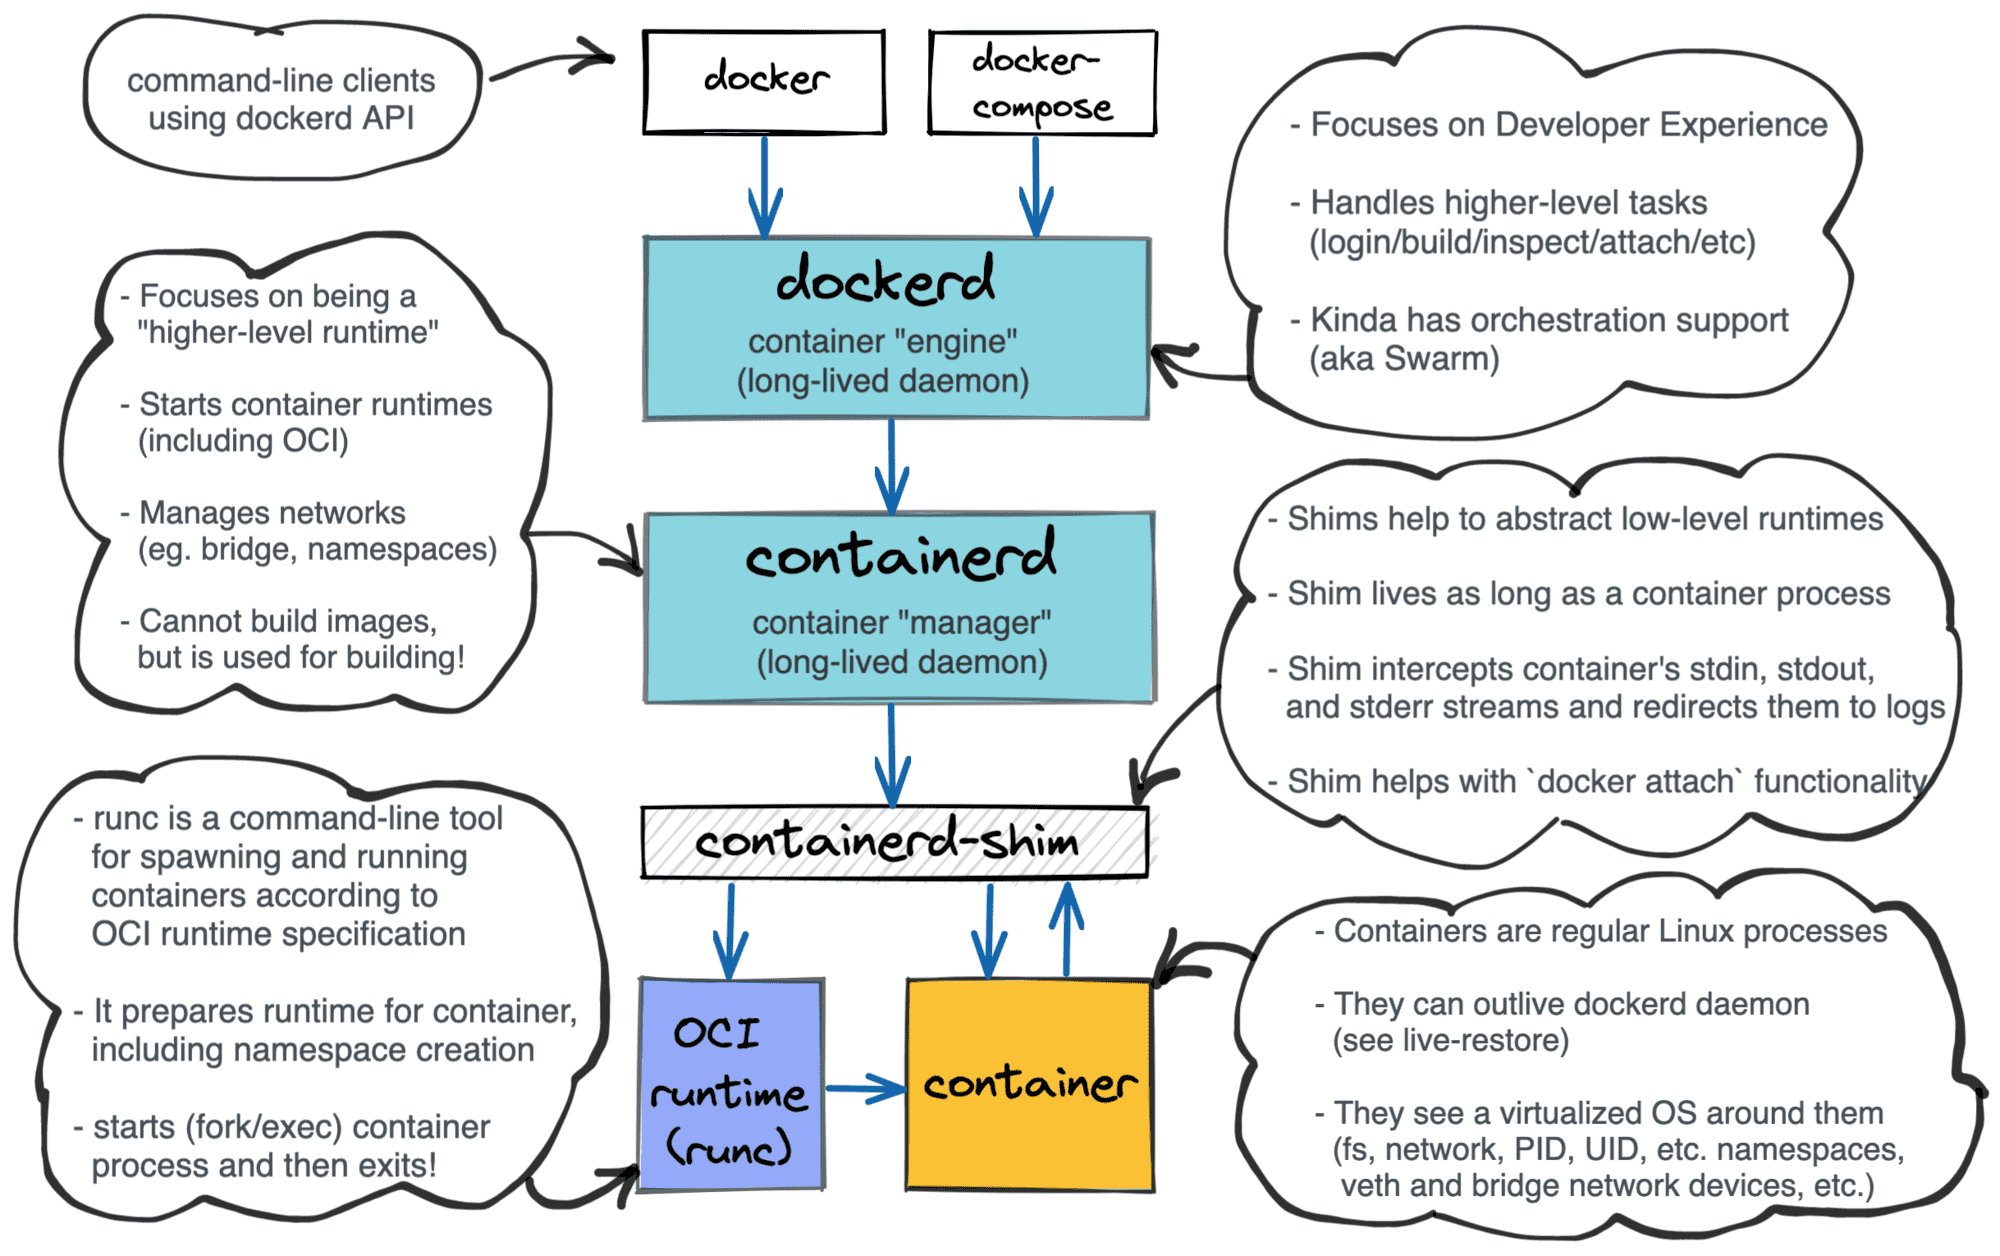
What is a Container? Container vs. VM? Docker vs. Kubernetes. How to organize the learning efficiently?

“No, we don’t use Kubernetes”. That always gets raised eyebrows... so we decided to write about our reasoning behind this cloud architecture decision.

Confused between Dockerfile and docker-compose because they look and sound similar? But they are not. Read this to clear your doubts.

Read more on the Doximity Technology Blog about how our engineers and data scientists are building the largest online network for clinicians.

This article explains why Docker is now deprecated in Kubernetes.

Podman is an excellent alternative to Docker containers when you need increased security, unique identifier (UID) separation using namespaces, and integration with systemd. In this article, I use

Learn from Docker experts to simplify and advance your app development and management with Docker. Stay up to date on Docker events and new version
Overview The Docker driver allows you to install Kubernetes into an existing Docker install. On Linux, this does not require virtualization to be enabled. Requirements Install Docker 18.09 or higher (20.10 or higher is recommended) amd64 or arm64 system. If using WSL complete these steps first Usage Start a cluster using the docker driver: minikube start --driver=docker To make docker the default driver: minikube config set driver docker Requirements Docker 20.10 or higher, see https://rootlesscontaine.rs/getting-started/docker/ Cgroup v2 delegation, see https://rootlesscontaine.rs/getting-started/common/cgroup2/ Kernel 5.11 or later (5.13 or later is recommended when SELinux is enabled), see https://rootlesscontaine.rs/how-it-works/overlayfs/ Usage Start a cluster using the rootless docker driver:
With an Infographic and Cheatsheet

When you install docker it creates three networks automatically - Bridge, Host, and None. Of which, Bridge is the default network a…
Docker — If you have ever been intimidated by its fancy name and wondered what it is — this post is for you.
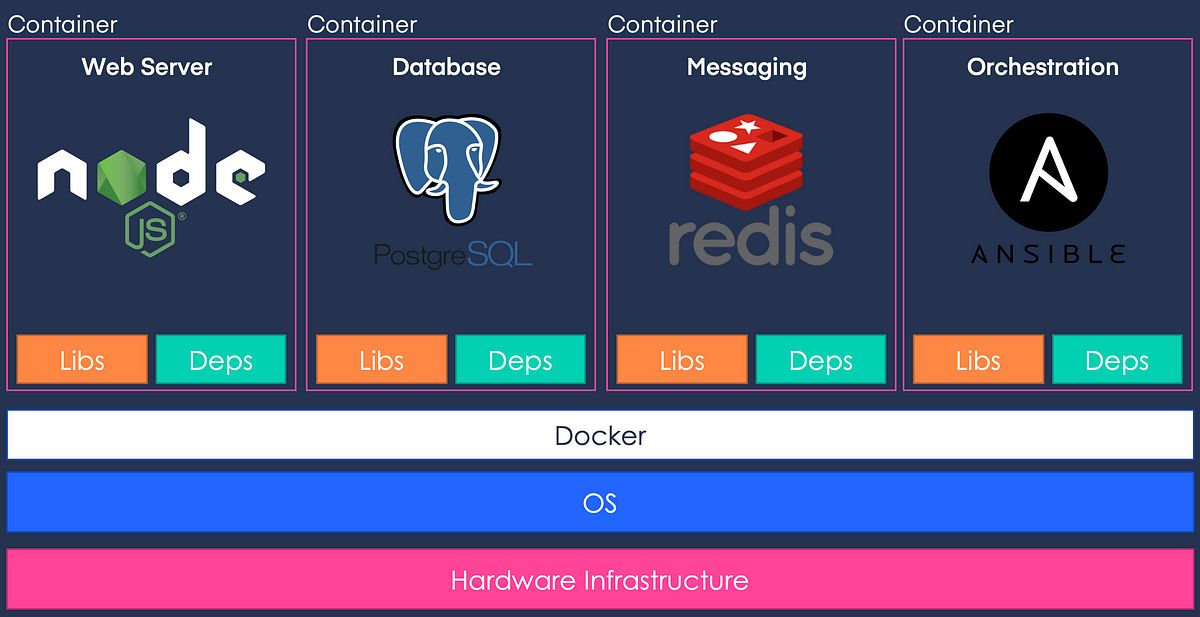
There are several courses available on this topic. Some of them are very short and do not serve any other purpose than a ‘Getting started…

If you're trying to learn Docker you will first have to master its various terminal commands. This guide aims to help you get started with basic docker commands.

Ardan Labs is trusted by small startups and Fortune 500 companies to train their engineers and develop business software solutions and applications.

The first post on a series to get you ready to develop and deploy production-grade workloads in AWS.

In this post, basically, I don't put options. If you think this command is lacking something import...

Part 1: The Conceptual Landscape
-->
documentation (best practices)
categories:
tags: best-practices documentation
date: 03 Apr 2025
slug:raindrop-documentation

These manuals go large.

In 1951, Bell Telephone System introduced a guide titled "The Telephone and How We Use It," designed to aid elementary school students and others in understanding the operation of classic rotary dial phones. The guide detailed everything from basic phone use, handling emergencies, to polite phone ma
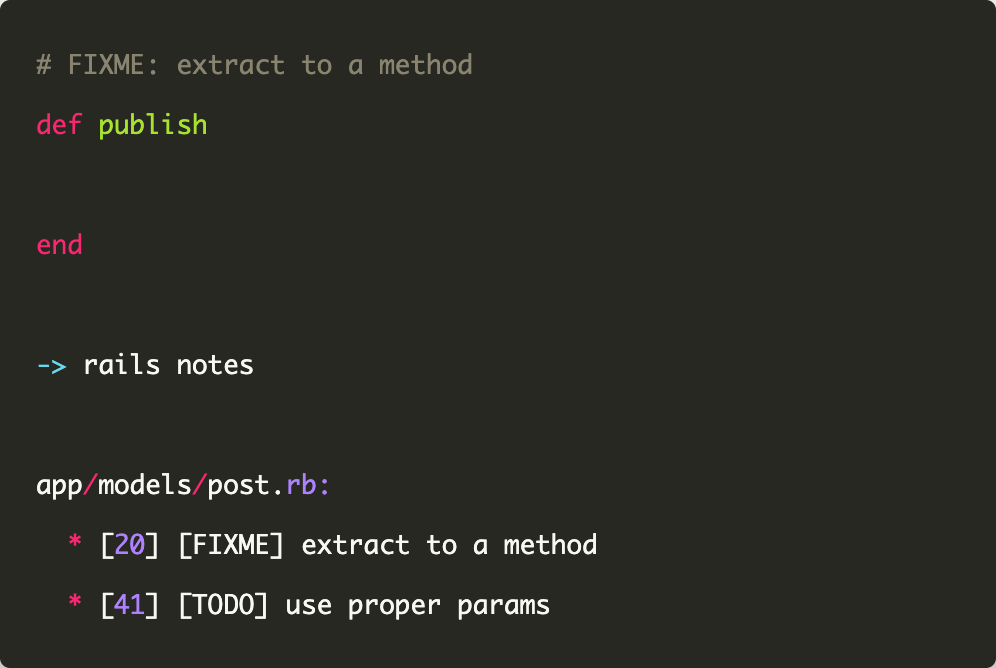
This post shows how you can use the notes command in Rails to search through your codebase for comments starting with a specific keyword. By default, it searches the codebase for FIXME, OPTIMIZE, and TODO comments, but you can also configure it to use custom keywords.

For a cost-effective way to reduce expenses, boost retention and drive new revenues, bring your outdated user manuals into the digital era.

Patience and empathy are the basis of good documentation, much as they are the basis for being a decent person. Here's a how-to for creating better open source project docs, which can help your users and grow your community.

Find the software documentation system for Divio. Includes comprehensive tutorials, how-to guides, technical reference and explanation. Learn more here.

Three documents I write (one-pager, design doc, after-action review) and how I structure them.
-->
dogwhistles (behavior)
categories:
tags: behavior
date: 03 Apr 2025
slug:raindrop-dogwhistles
How are so many politicians today able to get away with overtly racist utterances? By using rhetorical ‘figleaves’
-->
symbols / symbolism
categories:
tags: language symbols
date: 03 Apr 2025
slug:raindrop-symbols

A mathematician has uncovered the stories behind the symbols used in math
In 1990, the federal government invited a group of geologists, linguists, astrophysicists, architects, artists, and writers to the New Mexico desert, to visit the Waste Isolation Pilot Plant. They would be there on assignment. The Waste Isolation Pilot Plant (WIPP) is the nation’s only permanent underground repository for nuclear waste. Radioactive byproducts from nuclear weapons manufacturing and nuclear power plants. WIPP was

For a younger generation, the once-powerful protest symbol packs about as much of a punch as a smiley face.

One of the best-known icons of modern society is a classic example of a symbol—it’s easy to spot, but hard to explain. Who came up with it?

News on Japan, Business News, Opinion, Sports, Entertainment and More article expired

The world is full of icons that warn us to be afraid — to stay away from this or not do that. And many of these are easy to understand because they represent something recognizable, like a fire, or a person slipping on a wet floor. But some concepts are hard to communicate visually, especially
For a couple of centuries, the British were in an unlikely frenzy for the exotic fruit.

Why China considers a covered eye to be dangerous. And why people still do it. From the winking owl to the Hong Kong protest eye patch.
How we evolved to read is a story of one creative species.

An L-system or Lindenmayer system is a parallel rewriting system and a type of formal grammar. An L-system consists of an alphabet of symbols that can be used to make strings, a collection of production rules that expand each symbol into some larger string of symbols, an initial "axiom" string from which to begin construction, and a mechanism for translating the generated strings into geometric structures. L-systems were introduced and developed in 1968 by Aristid Lindenmayer, a Hungarian theoretical biologist and botanist at the University of Utrecht.[1] Lindenmayer used L-systems to describe the behaviour of plant cells and to model the growth processes of plant development. L-systems have also been used to model the morphology of a variety of organisms[2] and can be used to generate self-similar fractals.

How, exactly, does one go about making a global dictionary of symbols? It is a Herculean task, one few scholars would take on today, not only because of its scope but because the philological approach that gathers and compares artifacts from every culture underwent a correction:
:extract_focal()/http%3A%2F%2Fstatic.nautil.us%2F15540_0c6ba56676353996dff5efb2b7789e1e.png)
We’ll need both deep learning and symbol manipulation to build AI.

Nautilus is a different kind of science magazine. Our stories take you into the depths of science and spotlight its ripples in our lives and cultures.

The removal of cultural emblems is not the erasure of history but part of it.
Many of us now use the word hobo to refer to any homeless individual, but back in the America of the late 19th and early 20th century, to be a hobo meant something more.

Yard signs featuring this mysterious blue dot are quickly gaining popularity among Nebraska Democrats. Here's what it means.
-->
game theory
categories:
tags: game-theory
date: 03 Apr 2025
slug:raindrop-game-theory
tags: game-theory, pricing, collusion, arxiv

Our paper, Beyond Human Intervention: Algorithmic Collusion through Multi-Agent Learning Strategies, with Suzie Grondin and Philipp Ratz is now available online Collusion in market pricing is a concept associated with human actions to raise market prices through artificially limited supply. Recently, the idea of algorithmic collusion was put forward, where the human action in the … Continue reading Beyond Human Intervention: Algorithmic Collusion through Multi-Agent Learning Strategies →
tags: game-theory, books

Explore the best books on game theory to sharpen your strategic thinking. From foundational texts to advanced strategies, these books offer valuable insights for professionals, students, and enthusiasts
tags: game-theory
tags: game-theory
In this paper, we study the highly competitive arena of baby naming. Through making several Extremely Reasonable Assumptions (namely, that parents are myopic, perfectly knowledgeable agents who...
tags: game-theory, poker

Poker players can now employ AI to find the optimal playing strategy, but they often don’t use it. Here’s why
tags: game-theory

an interactive guide to the game theory of why & how we trust each other
tags: game-theory
Game theory is the branch of mathematics in which games are studied: that is, models describing human behaviour. This is a glossary of some terms of the subject.
tags: economics, game-theory, pricing
Plus! Diff Jobs; Making a Market; Financial Innovation; IRL; Open-Ended Liabilities; Meme Stock Relapse
tags: game-theory
tags: game-theory
tags: game-theory
Prediction markets are speculative markets created for the purpose of making predictions. Assets are created whose final cash value is tied to a particular event or parameter. The current market prices can then be interpreted as predictions of the probability of the event or the expected value of the parameter. Prediction markets are thus structured as betting exchanges, without any risk for the bookmaker. Robin Hanson was the first to run a corporate prediction market - at Project Xanadu -, and has made several contributions to the field such as: conditional predictions, accuracy issues and market and media manipulation. People who buy low and sell high are rewarded for improving the market prediction, while those who buy high and sell low are punished for degrading the market prediction. Evidence so far suggests that prediction markets are at least as accurate as other institutions predicting the same events with a similar pool of participants. Predictions markets have been used by organizations such as Google, General Electric, and Microsoft; several online and commercial prediction markets are also in operation. Historically, prediction markets have often been used to predict election outcomes. See Also * Prediction * Economic consequences of AI and whole brain emulation * Group rationality * Making beliefs pay rent * QURI External Posts * Prediction Market FAQ by @Scott Alexander * A 1990 Corporate Prediction Market by Robin Hanson * Leamer's 1986 Idea Futures Proposal by Robin Hanson * Should Prediction Markets be Charities? by Peter McCluskey * The Future of Oil Prices 2: Option Probabilities by Hal Finney * Prediction Markets As Collective Intelligence by Robin Hanson * Fixing Election Markets by Robin Hanson * Prediction Markets at gwern.net * Idea Futures (a.k.a. Prediction Markets) by Robin Hanson External Links * Comparing face-to-face meetings, nominal groups, Delphi and prediction markets on an estimation task * Video of Robin
tags: game-theory, games
The largest collection of card game rules on the Internet, with information about hundreds of card and tile games from all parts of the world.
tags: game-theory, games

From Atlantic City to high fashion to Karl Marx, the most recognizable board game has had serious cultural impact.
tags: adtech-adwords, advertising-commercials, auctions, ecommerce, game-theory, prodmgmt
A deep dive into why the DOJ thinks RGSP makes ad auctions unfair, and why Google believes it creates a better user experience.
tags: arxiv, auctions, game-theory
tags: game-theory

Game theory provides a lot of insightful concepts we can wrap in the theoretical framework that can be applied to different fields under various circumstances. Here are five concepts from game theory that have a wide range of applications, and my examples of using them in different areas of my life.
tags: algorithms-math, auctions, finance, game-theory
How bid density impacts ads, recommender systems, and salary negotiations.
tags: game-theory, games
An interactive guide to the game theory of cooperation - ncase/trust
tags: algorithms-math, game-theory
A researcher has solved a nearly 60-year-old game theory dilemma called the wall pursuit game, with implications for better reasoning about autonomous systems such as driver-less vehicles.
tags: game-theory

And why the combo of strength+gentleness is unbeatable in the long run.
tags: economics, game-theory

"The Market for 'Lemons': Quality Uncertainty and the Market Mechanism" is a widely cited seminal paper in the field of economics which explores the concept of asymmetric information in markets. The paper was written in 1970 by George Akerlof and published in the Quarterly Journal of Economics. The paper's findings have since been applied to many other types of markets. However, Akerlof's research focused solely on the market for used cars.
tags: game-theory, games

Game-playing artificial intelligence (AI) systems have advanced to a new frontier. Stratego, the classic board game that’s more complex than chess and Go, and craftier than poker, has now been...
tags: game-theory, public-policy

Earlier this summer, a group of anti-Trump and moderate Republicans and Democrats launched a new political party called the Forward Party. On the surface, this movement echoes recent polls indicati…
tags: art, auctions, game-theory
Auction houses and galleries are getting creative, partnering to drive demand and give their clients access to the best works.
tags: game-theory, pricing, prodmgmt
tags: game-theory, pricing, prodmgmt
tags: auctions, game-theory
tags: game-theory

Mary Peltola won by appealing to Alaskan interests and the electorate’s independent streak. But Alaska’s new voting system played a big role, too.
tags: behaviors, bias, game-theory
tags: game-theory, pricing, prodmgmt
Antitrust law will have to evolve to cope.
tags: game-theory

What do metagames have to do with the acquisition of expertise?
tags: game-theory, games, reinforcement-learning, arxiv
We introduce DeepNash, an autonomous agent capable of learning to play the imperfect information game Stratego from scratch, up to a human expert level. Stratego is one of the few iconic board...
tags: ecommerce, game-theory, prodmgmt, trust
This paper appeared in VLDB'19 and is authored by Maurice Herlihy, Barbara Liskov, and Liuba Shrira. How can autonomous, mutually-distrust...
tags: auctions, books, game-theory
A broad overview of market mechanisms, with an emphasis on the interplay between theory and real-life applications; examples range from eBay auctions to scho...
tags: forecasting-predictions, game-theory
1 post published by TheZvi on July 26, 2018
tags: forecasting-predictions, game-theory
Epistemic Status: Sadly Not Yet Subsidized Robin Hanson linked to my previous post on prediction markets with the following note: I did briefly mention subsidization, as an option for satisfying th…
tags: game-theory
tags: economics, game-theory, public-policy
We are a community of activists, artists, entrepreneurs, and scholars committed to using mechanism design to inspire radical social change.
tags: game-theory, military-warfare, public-policy

This article is part of the contribution made by the US Army War College to the series “Compete and Win: Envisioning a Competitive Strategy for the Twenty-First Century.” The series […]
tags: arxiv, game-theory
tags: economics, forecasting-predictions, game-theory, sports

Contests that non-contestants consume for entertainment are a fixture of economic, cultural and political life. We exploit injury-induced changes to teams’ line
tags: auctions, game-theory, pricing, prodmgmt
The estate-sale industry is fragile and persistent in a way that doesn’t square with the story of the world as we have come to expect it.
tags: game-theory, machine-learning, pca, svd

Modern AI systems approach tasks like recognising objects in images and predicting the 3D structure of proteins as a diligent student would prepare for an exam. By training on many example...
tags: game-theory, anonymity

What your generosity signals about you.
tags: game-theory
:extract_focal()/https%3A%2F%2Fpocket-syndicated-images.s3.amazonaws.com%2Farticles%2F5747%2F1600869188_NashEquilibrium_2880x1620.jpg)
John Nash’s notion of equilibrium is ubiquitous in economic theory, but a new study shows that it is often impossible to reach efficiently.
tags: game-theory, pricing

They standardized value, which helped collectors to get a sense of the market.
tags: game-theory, gaming
The hidden side of everything
tags: game-theory
List of research around modern boardgames.
tags: game-theory

Game Theory is the study of micro-situations where each situation demands a decision that
tags: auctions, game-theory
As Christie’s, Sotheby’s and others vie to lure sellers of big-name artworks, analysts wonder if the houses are running oversize risks.
tags: game-theory

Quadratic voting is a rated voting method procedure where voters express the degree of their preferences. By doing so, quadratic voting seeks to address issues of the Condorcet paradox and tyranny of the majority. Quadratic voting works by allowing users to "pay" for additional votes on a given outcome to express their support for given issues more strongly, resulting in voting outcomes that are aligned with the highest willingness to pay outcome, rather than just the outcome preferred by the majority regardless of the intensity of individual preferences. The payment for votes may be through either artificial or real currencies. Quadratic voting is a variant of cumulative voting, which differs in that the weight of a vote is normalized using the sum of squares, rather than the sum of absolute values.
tags: game-theory

Betting markets show Bloomberg as a leading candidate. Really?
tags: game-theory
tags: finance, game-theory
The Black–Scholes /ˌblæk ˈʃoʊlz/[1] or Black–Scholes–Merton model is a mathematical model for the dynamics of a financial market containing derivative investment instruments. From the parabolic partial differential equation in the model, known as the Black–Scholes equation, one can deduce the Black–Scholes formula, which gives a theoretical estimate of the price of European-style options and shows that the option has a unique price given the risk of the security and its expected return (instead replacing the security's expected return with the risk-neutral rate). The equation and model are named after economists Fischer Black and Myron Scholes. Robert C. Merton, who first wrote an academic paper on the subject, is sometimes also credited.
tags: game-theory
Advocates of prediction markets often focus their attention on markets that can be run for profit.
tags: game-theory

In this classic game theory experiment, you must decide: rat out another for personal benefit, or cooperate? The answer may be more complicated than you think.
tags: game-theory
/https://tf-cmsv2-smithsonianmag-media.s3.amazonaws.com/filer/65/f9/65f9f4c4-c7b6-455a-8e2e-10d3e1c6fb62/social_longform_games.jpg)
Thousands of years before Monopoly, people were playing games like Senet, Patolli and Chaturanga
tags: game-theory, pricing, prodmgmt
If you shop on Amazon, an algorithm rather than a human probably set the price of the service or item you bought. Pricing algorithms have become ubiquitous in online retail as automated systems have grown increasingly affordable and easy to implement. But while companies like airlines and hotels have long used machines to set their…
tags: chess, game-theory, gaming

Chess openings visualized from over 800 million Lichess games, 2 million tournament games and 1 million chess engine games.
tags: game-theory
:extract_focal()/https%3A%2F%2Fs3.amazonaws.com%2Fpocket-syndicated-images%2Farticles%2F1680%2F1569002958_image.jpg)
An ancient game known as “hnefatafl” held immense symbolic and religious significance.
tags: auctions, game-theory
A Vickrey–Clarke–Groves (VCG) auction is a type of sealed-bid auction of multiple items. Bidders submit bids that report their valuations for the items, without knowing the bids of the other bidders. The auction system assigns the items in a socially optimal manner: it charges each individual the harm they cause to other bidders. It gives bidders an incentive to bid their true valuations, by ensuring that the optimal strategy for each bidder is to bid their true valuations of the items; it can be undermined by bidder collusion and in particular in some circumstances by a single bidder making multiple bids under different names. It is a generalization of a Vickrey auction for multiple items.
tags: economics, game-theory

Some lawmakers in Colorado tried so-called quadratic voting—and it worked.
tags: game-theory

It’s the game for anyone who loves shaking Scrabble tiles in the bag. (And you know you do.)

tags: game-theory
Find the latest Design news from Fast company. See related business and technology articles, photos, slideshows and videos.
tags: game-theory
This book, written in an interactive manner and easy-to-comprehend style, explicates the concepts of game theory. It enables the readers to think strategically in interactions that they may encounter as managers. The book innovatively cites real-world scenarios to highlight the fundamental concepts of game theory. It includes applications from regions around the world, with special emphasis on India.Primarily intended for the students of MBA, the book is also of immense use for managers involved in decision-making. In addition, it will be of value to all readers from all walks of life engaged in strategic interactions, including professionals. The book is supplemented with Instructor’s Manual and Solution’s Manual.Highlights of the book• Many case studies and examples are given in the text to maintain the reader’s interest in the subject. The case studies dwell on diverse issues such as diplomacy, politics, movies, sports, health care, environment, besides business and economics.• Mathematical usage is kept at a level that is easy for most MBA students. Even for those students who are not very comfortable with mathematics, the book is designed in such a way that intuitive and logical understanding is possible without rigorous models. • Each chapter (excluding the first chapter on introduction) ends with summary, solved examples, key terms and exercises.
-->
storytelling
categories:
tags: influence-persuasion storytelling
date: 06 Apr 2025
slug:storytelling
tags: storytelling, purpose

People who are rated as good storytellers exhibit a purpose-oriented mindset and big-picture thinking more often than others
tags: movies-television, speaking, storytelling

Soon enough, artificial intelligence may be able to recreate the sounds — but there will be something missing.
tags: movies-television, storytelling, goodreads

And other oxymoronic observations about the oeuvre of Ron Oliver, the Hallmark Channel’s most prolific, flamboyant and unapologetically sappy director
tags: books, storytelling, creepy

Lovecraft’s and King’s fictional whip-poor-wills draw on widespread Indigenous, European, and American beliefs about the species.
tags: animals, history, creepy, storytelling

The Whip-Poor-Will’s shrill, death-proclaiming song populates the works of Stephen King and H.P. Lovecraft. But the bird itself has fallen on hard times. Could it become a ghost of Halloweens past?
tags: movies-television, comedy-fun-humor, storytelling

Live from New York, it’s an idiosyncratic list of ‘SNL’ moments we’re still thinking about—from the Belushi/Aykroyd/Radner years to the Eddie Murphy era to Sandler, Fey, Hader, and beyond.
tags: memory-recall, storytelling

Artists may jumble time for dramatic effect. But your unconscious is always putting the narrative in order.
tags: storytelling

I came across this recent video from Vicky Zhao last week and loved her brief summary of how she grew in her ability to clearly articulate ideas on the spot by getting to the point, using story str…
tags: storytelling

How to apply powerful storytelling to design a compelling and memorable digital experience on a landing page. A case study of the [Smart Interface Design Patterns landing page](https://smart-interface-design-patterns.com/).
tags: storytelling

Storytelling is a powerful tool for any UX designer. It helps create a product and understand the people who use it. In this article, Marli Mesibov takes a real-life example of an app she helped to build in 2017 and explains five steps you can use to help you build a story into your user experience.
tags: storytelling

The basic building blocks of storytelling
tags: storytelling

30 years of storytelling experience, in a box? Yes, that’s what you get with my latest guides – check out Storyteller Tactics here. My older material is here on the website, including…
tags: storytelling

Create quick UX design storyboards using the mix-and-match library and template. Pick and change the character's pose, expression, gestures, and more to fit your scenario. Adjust the background and create close-up scenes to describe your solution all from one magic card 🧚♀️. Follow the in...
tags: storytelling

Crafting a good experience is like telling a good story. Improve your UX with these 6 storytelling principles.
tags: storytelling

How to Align User Research Presentations for Decision Making
tags: behaviors, scams, storytelling
:extract_focal()/https%3A%2F%2Fmelmagazine.com%2Fwp-content%2Fuploads%2F2019%2F02%2Fscam.jpg)
2018’s ‘Summer of Scam’ was just the latest in a strong American tradition.
tags: storytelling
:extract_focal()/https%3A%2F%2Fpocket-syndicated-images.s3.amazonaws.com%2Farticles%2F8382%2F1675823556_ScreenShot2023-02-07at6.26.12PM.png)
Think of them more as “enhancers” than “spoilers.” Knowing what will happen in a movie, TV show or book can provide a tantalizingly pleasing feeling, help you understand the plot and give you a sense of control during chaotic times.
tags: reading, storytelling

Note: Back in 2013, when Alice Munro won the Nobel Prize in Literature, we published a post featuring 20 short stories written by Munro.
tags: storytelling, writing
:extract_focal()/https%3A%2F%2Fpocket-syndicated-images.s3.amazonaws.com%2Farticles%2F7955%2F1715370583_Graham-Greene1.png)
Ten great opening paragraphs from one iconic author.
tags: github, storytelling, video
Accepted as [NeurIPS 2024] Spotlight Presentation Paper - HVision-NKU/StoryDiffusion
tags: spycraft, storytelling

It all goes back to one man in the 1950s: a military-intelligence expert in psychological warfare.
tags: influence-persuasion, storytelling

"Storytelling is one of the most powerful marketing and leadership tools there is," says communications expert Kelly D. Parker. She explains how stories make proposals of all kinds more memorable — and shows how you can craft a compelling narrative to connect, persuade and drive meaningful action.
tags: influence-persuasion, presentations-presenting, storytelling

Every startup leader should practice flexing their storytelling muscles. To help warm these muscles up, we’ve rounded up some of our best advice about storytelling in business that’s been featured in the Review.
tags: folklore, storytelling

Both folktales and formal philosophy unsettle us into thinking anew about our cherished values and views of the world
tags: books, folklore, storytelling

Westerners tend to think of Japan as a land of high-speed trains, expertly prepared sushi and ramen, auteur films, brilliant animation, elegant woodblock prints, glorious old hotels, sought-after jazz-records, cat islands, and ghost towns.
tags: storytelling

⛺🪵🔥 Free Storytelling Masterclass (+ PDFs) (https://lnkd.in/eiFscUtf), a comprehensive guide with 9 modules on storytelling, PDF worksheets, 1-pager… | 52 comments on LinkedIn
tags: datasets, storytelling

Read For Free, Anywhere, Anytime. An online library of over 1000 classic short stories. H. G. Wells, Edgar Allan Poe, H. P. Lovecraft, Anton Chekhov, Beatrix Potter.
tags: leadership, storytelling

Storytelling is an important leadership skill, and executives who want to succeed should master five types of narrative: Vision stories, which inspire a shared one; values stories that model the way; action stories that spark progress and change; teaching stories that transmit knowledge and skills to others; and trust stories that help people understand, connect with, and believe in you.
tags: history, physics, storytelling

From ancient fables to the latest science theory, invisibility represents some of humankind’s deepest fears and desires
tags: copywriting, storytelling, writing
…and how they got that way
tags: history, storytelling

The stories of oral societies, passed from generation to generation, are more than they seem. They are scientific records
tags: behaviors, imagination, storytelling
:extract_focal()/https%3A%2F%2Fcdn.theatlantic.com%2Fassets%2Fmedia%2Fimg%2Fmt%2F2016%2F11%2FWoman_with_a_Mirror_Frieseke%2Flead_720_405.jpg%3Fmod%3D1533691860)
What a close study of “inner speech” reveals about why humans talk to themselves.
tags: storytelling

Do you go to great lengths to avoid spoilers for your favorite TV show? Research suggests that doing so may not always be justified. Here's why.
tags: deep-learning, generative, storytelling, video
Find it here, via Ryan Watkins. Further improvement is required, but the pace of current breakthroughs is remarkable.
tags: books, scifi, storytelling

The pronouncements of French theorist Jean Baudrillard could sound a bit silly in the early 1990s, when the internet was still in its infancy, a slow, clunky technology whose promises far exceeded what it could deliver.
tags: deep-learning, generative, movies-television, storytelling

Alphabet's DeepMind has built an AI tool that can help generate rough film and stage scripts Engadget's Kris Holt reports: Dramatron is a so-called "co-writing" tool that can generate character descriptions, plot points, location descriptions and dialogue. The idea is that human writers will be abl...
tags: storytelling

Vox is a general interest news site for the 21st century. Its mission: to help everyone understand our complicated world, so that we can all help shape it. In text, video and audio, our reporters explain politics, policy, world affairs, technology, culture, science, the climate crisis, money, health and everything else that matters. Our goal is to ensure that everyone, regardless of income or status, can access accurate information that empowers them.
tags: prodmgmt, storytelling
tags: storytelling, writing

21K votes, 289 comments. 5.5M subscribers in the coolguides community. Picture based reference guides for anything and everything. If it seems like…
tags: emotions, movies-television, storytelling

Casablanca is widely remembered as one of the greatest films of all time, coming in at #2 on the AFI’s top 100 list and similarly regarded by many other critics. You can quibble with its exac…
tags: movies-television, storytelling, writing

The most tearjerking, hilarious, satisfying, and shocking death scenes in 2,500 years of culture.
tags: movies-television, storytelling
An index page listing Tropes content. A trope is a storytelling device or convention, a shortcut for describing situations the storyteller can reasonably …
tags: storytelling, writing

Before fame, Kurt Vonnegut wrote a master's thesis on the shapes of stories for the anthropology department at the University of Chicago.
tags: movies-television, storytelling

In FX’s surprise hit, the 31-year-old actor plays a tormented culinary genius who returns home to run his family’s Chicago sandwich shop. We caught up with White in his native Brooklyn to learn what it took to get in the kitchen.
tags: movies-television, storytelling
tags: storytelling, writing

Writer @GretchenMdm9524 gives a brief history of 1929's 10 Commandments for Detective Fiction and offers some modern updates.
tags: storytelling, writing
The basic building blocks of storytelling
tags: influence-persuasion, storytelling

Everything you need to know about Howard Suber Of UCLA Film School Explains How To Tell A Story
tags: chatbots, deep-learning, nlp, storytelling

We used GPT-3 and DALL·E to generate a children's storybook about Ash and Pikachu vs. Team Rocket. Read the story and marvel at the AI-generated visuals!
tags: attention, behaviors, storytelling

The person who can capture and hold attention is the person who can effectively influence human behavior. Here's how to do it.
tags: storytelling, writing
Telling a story is the most powerful way to activate our brains . If you want to become a better storyteller, UCLA Film School Howard Suber says you
tags: prodmgmt, storytelling

Storytelling is a powerful technique for building data-informed products.
tags: prodmgmt, storytelling
Getting people to notice your product on the web is hard. Getting them to understand what you do is even harder. One of the biggest challenges startups face is cutting through the noise and…
tags: brandmgmt, storytelling
As entrepreneurs, Diane Engelman, PhD, and JB Allyn, MBA, have been perfecting a methodology over the past 12 years that is burgeoning in…
tags: movies-television, storytelling, writing

Andrew Kevin Walker, writer of the movie "Seven", gives five tips on how to improve your writing.
tags: storytelling, writing

Next month, the doyen of hardboiled crime writers is publishing a new book, 10 Rules of Writing. The following is a brief summary of his advice
tags: marketing, storytelling

Design Musings #1
tags: goodreads, movies-television, storytelling

"We figured the best way to make the audience understand—and care—would be to connect his house to a relationship, and unfinished business," says director Pete Docter
tags: storytelling
157K subscribers in the startup community. Reddit's space to learn the tools and skills necessary to build a successful startup. A community meant to…
tags: behaviors, storytelling
:extract_focal()/https%3A%2F%2Fcdn.theatlantic.com%2Fassets%2Fmedia%2Fimg%2Fmt%2F2017%2F12%2FGettyImages_521899712%2Flead_720_405.jpg%3Fmod%3D1533691915)
Among Filipino hunter-gatherers, storytelling is valued more than any other skill, and the best storytellers have the most children.
tags: reading, storytelling

These reoccuring story elements have proven effects on our imagination, our emotions and other parts of our psyche
tags: influence-persuasion, speaking, storytelling

To engage leaders, colleagues, and clients, use this simple technique
tags: comedy-fun-humor, language-linguistics, memes, storytelling
There couldn’t be a ‘Is This a Pigeon?’ without a ‘Beware of Doug’.
tags: folklore, goodreads, storytelling
:extract_focal()/https%3A%2F%2Fpocket-syndicated-images.s3.amazonaws.com%2Farticles%2F7866%2F1653360024_628c44c504ce3.png)
Smithsonian’s James Deutsch says that behind the character in the Marvel Studios series lies the oft-told story of “guile” outsmarting authority.
tags: storytelling
"On December 20 there flitted past us, absolutely without public notice, one of the most important profane anniversaries in American history, to wit, the seventy-fifth anniversary of the introduction of the bathtub into These States. Not a plumber fired a salute or hung out a flag.
tags: storytelling, ui-ux

Effective storytelling involves both engaging the audience and structuring stories in a concise, yet effective manner. You can improve your user stories by taking advantage of the concept of story triangle and of the story-mountain template.
tags: goodreads, storytelling, writing
:extract_focal()/https%3A%2F%2Fs26162.pcdn.co%2Fwp-content%2Fuploads%2F2020%2F06%2Fthe-lottery.jpg)
From Washington Irving to Kristen Roupenian.
tags: comedy-fun-humor, goodreads, movies-television, storytelling

Loren Bouchard’s accidental career as a comedy mogul has now brought his TV family to the big screen.
tags: ideas, storytelling

'We were telling the story of a phone that would change everything. So that’s what we had to build.'
tags: goodreads, storytelling, writing

On the value of unconscious association, or why the best advice is no advice.
tags: language-linguistics, storytelling, writing
Maybe it has happened to you: a stranger catches your eye while you peruse the plant identification section of the library, or wander a mossy hillock speckled with Amanita bisporigera, or shuffle a…
tags: movies-television, storytelling

However powerful the villain, the scruffy detective always outwits them
tags: storytelling

Few genres are more preposterous than the locked room mystery. The premises are absurd and plot solutions ridiculous—but still I keep on reading.
tags: movies-television, storytelling

The show balanced improvisation and careful planning thanks to its overarching structure.
tags: prodmgmt, storytelling

If you want to move to a Jeff Bezos–style executive meeting without PowerPoint, with a six-page narrative memo, you mustn't forget the narrative. Here's why
tags: animation, storytelling, video
From sequence to shot to frame, explore our studio pipeline.
tags: behaviors, storytelling, ui-ux

Playing with reality
tags: books, goodreads, history, storytelling
The Divine Comedy is an Italian narrative poem by Dante Alighieri, begun c. 1308 and completed around 1321, shortly before the author's death. It is widely considered the pre-eminent work in Italian literature and one of the greatest works of Western literature. The poem's imaginative vision of the afterlife is representative of the medieval worldview as it existed in the Western Church by the 14th century. It helped establish the Tuscan language, in which it is written, as the standardized Italian language. It is divided into three parts: Inferno, Purgatorio, and Paradiso.
tags: movies-television, storytelling
My son Max loved the Star Wars movies. I would take him to various showings of them. And for his tenth birthday, he had a Star Wars–themed birthday party. And boy, did those kids love it! So I thou…
tags: goodreads, storytelling

The beloved Christmas short story may have been dashed off on deadline but its core message has endured
tags: influence-persuasion, speaking, storytelling

Bill Carmody is a twenty-five year global keynote speaker. He’s had the incredible privilege to present in Brazil with Sir Richard Branson and in India with executives from Fortune 100 companies. Recently he had the distinct privilege to teach several of the UK Brexit government officials how to become more powerful public speakers. Bill Carmody is a twenty-five year global keynote speaker. He’s had the incredible privilege to present in Brazil with Sir Richard Branson and in India with executives from Fortune 100 companies. Recently he had the distinct privilege to teach several of the UK Brexit government officials how to become more powerful public speakers. This talk was given at a TEDx event using the TED conference format but independently organized by a local community. Learn more at https://www.ted.com/tedx
tags: goodreads, movies-television, storytelling

For our reporter, “Nightmare Alley” recalls a childhood spent working the circuit with his parents. Carnies like the World’s Smallest Woman welcomed him when cruel classmates didn’t.
tags: comedy-fun-humor, movies-television, storytelling, writing

David Owen’s 2000 Profile of George Meyer: Humor has to reframe reality, Meyer says. “It’s like seeing in two dimensions and then opening the other eye or looking through a View-Master and suddenly seeing in three.”
tags: goodreads, movies-television, storytelling

Margaret Talbot’s 2007 Profile of the show’s creator, with a behind-the-scenes look at the filming of “The Wire” ’s fifth season.
tags: goodreads, movies-television, storytelling

From 1999: “There has certainly never been anything like it on TV, and on network TV there never could be anything like it.”
tags: movies-television, sports, storytelling
:extract_focal()/https%3A%2F%2Fwww.rollingstone.com%2Fwp-content%2Fuploads%2F2018%2F06%2Fslapshot-movie-a1734e65-75f7-404d-8de9-b3640903b1bc.jpg%3Fresize%3D900%2C600%26w%3D450)
Celebrating the greatest hockey movie of all time—and one the best “malaise days” Seventies films ever.
tags: storytelling, writing

Learn how to write well. Topics include figuring out what to write about, how to write an introduction, the writing process, writing style, and copyediting.
tags: goodreads, storytelling

The heart of the world’s oldest long poem is found in its gaps and mysteries.
tags: books, storytelling

Her gentle, heartwarming stories seek to soothe our troubled souls. They also aim to blow up the entire genre.
tags: movies-television, storytelling

Ahead of the Sopranos prequel The Many Saints of Newark hitting cinemas, here are 30 organised crime flicks you must see before you sleep with the fishes
tags: storytelling, writing

Chekhov's gun is a narrative principle that states that every element in a story must be necessary and irrelevant elements should be removed. For example, if a writer features a gun in a story, there must be a reason for it, such as it being fired some time later in the plot. All elements must eventually come into play at some point in the story. Some authors, such as Hemingway, do not agree with this principle.
tags: deep-learning, storytelling

A primer on automated story generation and how it it strikes at some fundamental research questions in artificial intelligence.
tags: storytelling, writing
:extract_focal()/https%3A%2F%2Fs3.amazonaws.com%2Fpocket-syndicated-images%2Farticles%2F99%2F1566572787_5d2336edf385b.jpg)
From the ones you know to a few new tricks. Pleonasm, anyone?
tags: discovery, prodmgmt, storytelling
Almost exactly a year ago, I started a little boutique software company called Report Card Writer. As the name suggests, my flagship software product does pretty much one thing: it helps teachers write report card comments faster. Its core technical functionality is part survey form, part template-filler-inner, with a few extra bolt-on features that make it easy to create and populate the form and template, respectively.
tags: behaviors, movies-television, storytelling

It feels good to control what will terrify you.
tags: goodreads, storytelling

Fiction, from 1948: “The people had done it so many times that they only half listened to the directions; most of them were quiet, wetting their lips, not looking around.”
tags: storytelling, writing

Writers keep notebooks because ideas come in the most unexpected of places. Notebooks contain a junkyard of treasures waiting to be discovered. They provide ports of entry to the imagination. And as Joan Didion once wrote, a place to keep “on nodding terms with the people we used to be”. Thomas Hardy kept four … Continue reading "Raymond Chandler’s Guide to Street, Hoodlum, and Prison Lingo"
tags: movies-television, storytelling

Learn the major plot points and story structure of Toy Story directed by John Lasseter.
tags: storytelling, writing

Having trouble developing the plot of a story? You aren't alone—this is no small task. But that doesn't mean it's impossible. This guide is here to help.
tags: broadcasting, movies-television, storytelling

Behind Chris McCarthy’s plan to transform the ViacomCBS network from a linear cable channel to a multi-platform content machine.
tags: storytelling
:extract_focal()/https%3A%2F%2Fcdn.theatlantic.com%2Fassets%2Fmedia%2Fimg%2Fmt%2F2018%2F05%2FRTX5T3OD%2Flead_720_405.jpg%3Fmod%3D1541092649)
A machine mapped the most frequently used emotional trajectories in fiction, and compared them with the ones readers like best.
tags: python, storytelling
Facebook AI Research Sequence-to-Sequence Toolkit written in Python. - facebookresearch/fairseq
tags: language-linguistics, storytelling
Jack may have been climbing that beanstalk for more than 5,000 years
tags: movies-television, storytelling
Sixty years ago, the company modernized animation when it used Xerox technology on the classic film
tags: reading, storytelling, writing

Wattpad is turning these user-generated stories into books, TV shows, and movies.
tags: goodreads, movies-television, storytelling

Twenty years after it aired, David Chase and Co. look back on one of the wildest, boldest, funniest episodes of ‘The Sopranos’ ever made
tags: comedy-fun-humor, storytelling, writing

The first major interview with one of the most revered comedy writers of all time.
tags: language-linguistics, movies-television, storytelling
Good finales offer catharsis. The best deny us closure altogether.
tags: storytelling

Chris Fralic reminded me of this piece I wrote for Ode. Great stories succeed because they are able to capture the imagination of large or important audiences. A great story is true. Not necessaril…
tags: goodreads, movies-television, storytelling

On the original show, which is now streaming for the first time on Disney+, bits of fabric and glue and yarn become complexly real.
tags: motivation, movies-television, podcast, speaking, storytelling

Please enjoy this transcript of my interview with entertainment icon Jerry Seinfeld (@jerryseinfeld). Jerry’s comedy career took off after his first appearance on The Tonight Show with Johnny Carson in 1981. Eight years later, he teamed up with fellow comedian Larry David to create what was to become the most successful comedy series in the … Continue reading "The Tim Ferriss Show Transcripts: Jerry Seinfeld — A Comedy Legend’s Systems, Routines, and Methods for Success (#485)"
tags: speaking, storytelling

Tips from a comedian and a journalist on the art of going from small talk to big ideas. Try these out at the next summer wedding reception.
tags: movies-television, storytelling

The director Chloé Zhao narrates a scene from her movie featuring Frances McDormand and David Strathairn.
tags: storytelling

Take notes everywhere, embrace Wikipedia wormholes and other handy tips
tags: storytelling, writing

It’s not only writer’s intuition. Use personality psychology to create just the right blend of surprise and believability
tags: movies-television, storytelling

From ‘The Room’ to ‘Eraserhead’ to ‘Rocky Horror,’ these are the best movies to ever inspire deep obsession
tags: books, goodreads, spycraft, storytelling, writing
He wanted to learn about the Miami drug world and had been told I could help.
tags: storytelling
Before fame, Kurt Vonnegut wrote a master's thesis on the shapes of stories for the anthropology department at the University of Chicago.
tags: storytelling

When it comes to public speaking, the one thing your audience needs most is a good hook. Hooking attention takes creativity.
tags: storytelling
Fine-tuning GPT-2 to generate stories based on genres
tags: deep-learning, ideas, storytelling
DuckDuckGo. Privacy, Simplified.
tags: emotions, storytelling

Emotion classification, the means by which one may distinguish or contrast one emotion from another, is a contested issue in emotion research and in affective science. Researchers have approached the classification of emotions from one of two fundamental viewpoints:that emotions are discrete and fundamentally different constructs that emotions can be characterized on a dimensional basis in groupings
tags: storytelling
DuckDuckGo. Privacy, Simplified.
tags: storytelling
Learning how to write a short story is the perfect place to begin your writing journey. But it's an art—they're vastly different from full-length novels.
tags: storytelling

Fear and Loathing in Las Vegas, before he became short-hand for a filmmaker cursed with cosmically bad luck, before he became the sole American member of seminal British comedy group Monty Python, Terry Gilliam made a name for himself creating odd animated bits for the UK series Do Not Adjust Your Set.
tags: storytelling

'Great literature is one of two stories,' we often quote Leo Tolstoy as saying: 'a man goes on a journey or a stranger comes to town.' That's all well and good for the author of War and Peace, but what about the thousands of screenwriters struggling to come up with the next hit movie, the next hit television series, the next hit platform-specific web and/or mobile series?
tags: storytelling
tags: animation, storytelling
From Bugs Bunny to Spike Spiegel to Miles Morales, retracing 128 years of an art form that continues to draw us all in.
tags: storytelling

We have grown very used to the idea of time travel, as explored and exploited in so many movies and TV series and so much fiction. Although it feels like it’s been around forever, it isn’t an ancient archetypal story but a newborn myth, created by H.G. Wells in his 1895 novel The Time Machine. To put it another way, time travel is two years older than Dracula, and eight years younger than Sherlock Holmes.
tags: storytelling

According to science fiction writer William Gibson, a book's opening should be an inviting enigma to the reader—and a motivational benchmark for the writer.
tags: behaviors, storytelling

The best lessons from films and fiction on what makes a hero
tags: storytelling
tags: storytelling

A machine mapped the most frequently used emotional trajectories in fiction, and compared them with the ones readers like best.
tags: goodreads, movies-television, storytelling
Claudia Dreifus: You are sometimes called “the Balzac of Baltimore.” What’s your take on the title? David Simon: When people say that, I go, “Did you just call me a ball sac?” I usually goof on that. I haven’t read all of Balzac. I keep slicing up society, taking a different slice each time, thinking, eventually I’ll have a cake. That’s Balzac. That’s what he did. What I never do is raise my hand and say, “This could be a hit. Make this because this could be a hit.” The minute I do that, I’m done as me.
tags: storytelling
Fabula is an analogue framework for fiction writers and screenwriters
tags: storytelling

When it came to giving advice to writers, Kurt Vonnegut was never dull.
tags: storytelling, video

TVs this year will ship with a new feature called "filmmaker mode," but unlike the last dozen things the display industry has tried to foist on consumers, this one actually matters. It doesn't magically turn your living room into a movie theater, but it's an important step in that direction.
tags: storytelling

Learning to appreciate the future of literature.
tags: storytelling

Bowie placed the shotgun on the ground and picked up the .22 rifle. “I always wanted one of these little guns when I was a kid,” he said. “That time they got me in Florida,” Chicamaw said, “and sen…
tags: programming, storytelling

Quick tip: The new software package, Storyboarder, makes it 'easy to visualize a story as fast you can draw stick figures.' You can create a story idea without actually making a full-blown movie and see how it looks. Storyboarder is free. It's open source.
tags: goodreads, storytelling
tags: brandmgmt, marketing, prodmgmt, storytelling
tags: goodreads, storytelling

Improvising legend. Filmmaking maverick. Comedy savant. Screenwriting secret weapon. Elaine May is one of the most important people in American pop cultural history. Why isn’t she more celebrated? That’s exactly how she wants it.
tags: brandmgmt, naming, startups, storytelling
A change starts with a story.
tags: movies-television, storytelling

Michael Clayton is a great film. I was reminded of this fact a while back on Twitter. Not that I needed to be reminded — I tweet about the…
tags: prodmgmt, storytelling

LIKE THIS ARTICLE SO FAR? THEN YOU’LL REALLY WANT TO SIGN UP FOR MY NEWSLETTER. IT’S DELIVERED ONCE A WEEK AND PACKED WITH IDEAS ON…
tags: storytelling

In the wake of the Pepsi debacle, brands should turn up the authenticity in their marketing budgets with more long-form films and documentaries.
-->
shaming
categories:
tags: behaviors shame
date: 06 Apr 2025
slug:behaviors-shaming
tags: behaviors, shaming

When passions run high so does the urge to shame wrongdoers. But if the goal is to change, shamers should think twice
tags: behaviors, emotions, shaming
What does the state of online shaming reveal about our democracy?
tags: behaviors, emotions, shaming
Do you feel perpetually bad, broken or unlovable? These tools will help you relate to yourself in a fairer, gentler way
tags: shaming, feedback

The "common scold," recognized in England for centuries is still with us. Although such a person is not described in the psychiatric literature, I describe his/her principal elements here.
tags: behaviors, emotions, shaming
People who feel shame readily are at risk for depression and anxiety disorders
tags: emotions, empathy, shaming

Today’s hustle culture claims “unearned” pleasure is shameful. But there are ways to resist this cultural response.
tags: behaviors, shaming
I’ve enjoyed playing a game called Avalon recently. I won’t go too far into the rules, but it’s a hidden role game in the vein of Secret Hitler or Werewolf, where one team is “good”, trying to uncover who among them is “evil”, before the evil team wins.
tags: behaviors, shaming

Here's how it normally plays out: It all begins when a company pops up online and makes some sort of ludicrous statement related to their security posture, often as part of a discussion on a public social media platform such as Twitter. Shortly thereafter, the masses descend on said organisation
tags: marketing, shaming, anonymity

Consumers are more likely to buy embarrassing products when their embarrassment is mitigated by more-anonymous packaging. Specifically, consumers found products packaged in boxes with cool colors, small lettering, and a picture of the product to be more anonymous (and appealing) than products packaged in pumps or tubes with warm colors, medium or large lettering, and no picture. The findings show that the more anonymous a product looks, the less embarrassing a consumer finds it, and the more likely they are to purchase it.
tags: behaviors, emotions, shaming
Rather than being a cringey personal failing, awkwardness is a collective rupture – and a chance to rewrite the social script
-->
optical & photonics
categories:
tags: optical photonics
date: 06 Apr 2025
slug:optical
tags: optics-photonics, interconnects, semiconductors, datacenters

Nvidia's endorsement of co-packaged optics means the time is right
tags: optics-photonics

Lumai's breakthrough in AI acceleration with free-space optics promises energy cuts and faster processing.
tags: deep-learning, optics-photonics

Musings on systems, information, learning, and optimization.
tags: interconnects, optics-photonics, semiconductors
According to rumors, Nvidia is not expected to deliver optical interconnects for its GPU memory-lashing NVLink protocol until the “Rubin Ultra” GPU
tags: optics-photonics, semiconductors

A new technical paper titled “Image Sensors and Photodetectors Based on Low-Carbon Footprint Solution-Processed Semiconductors” was published by researchers at Cardiff University. Abstract “This mini-review explores the evolution of image sensors, essential electronic components increasingly integrated into daily life. Traditional manufacturing methods for image sensors and photodetectors, employing high carbon footprint techniques like thermal evaporation... » read more
tags: optics-photonics

Intel has achieved a breakthrough in silicon photonics,unveiling world's first fully integrated optical compute interconnect for AI markets.
tags: physics, optics-photonics

We explain how lasers work and all the fascinating ways they're being used.
tags: optics-photonics, semiconductors

tags: optics-photonics, semiconductors

Some of the leaders of the networking industry showed up to the Optical Fiber Conference, including Broadcom, MediaTek, Semtech, and MaxLinear.
tags: optics-photonics, semiconductors

From curvilinear designs to thermal vulnerabilities, what engineers need to know about the advantages and disadvantages of photonics.
tags: optics-photonics

Leveraging novel photonic circuit designs, researchers hope to lower electricity consumption in data centers.
tags: deep-learning, optics-photonics, semiconductors

Stanford team achieves first-ever optical backpropagation milestone
tags: optics-photonics, semiconductors, startups

Vaysh Kewada, CEO and Co-Founder of Salience Labs, advances AI by circumventing finite processing power with a revolutionary new chip design.
tags: optics-photonics, semiconductors

You can make many things with silicon photonics, but a laser is not one of them
tags: cameras, optics-photonics, physics
“Metalenses” created with photolithography could change the nature of imaging and optical processing.
tags: optics-photonics

Easy to use cloud based optical exploration, simulation and design
tags: interconnects, optics-photonics

Attached: 2 images One of my nice friends at Hurricane Electric gave me a dead 100G-LR4 optic to tear apart for your entertainment, so for the sake of your entertainment, lets dig into it! 🧵
tags: optics-photonics, semiconductors
Ayar Labs solves bandwidth and power bottlenecks by moving data using light. We built the world's first optical I/O chiplets.
tags: optics-photonics, semiconductors

Intel® Silicon Photonics combines the manufacturing scale and capability of silicon with the power of light onto a single chip.
tags: optics-photonics, semiconductors

Intel Lab researchers push photonics one step further by demonstrating a tightly controlled, highly integrated eight-wavelength laser.
tags: optics-photonics
NANOG is the professional association for Internet engineering, architecture and operations.
tags: optics-photonics, semiconductors

Intel has demonstrated an eight-wavelength laser array on a silicon wafer paving the way for the next generation of integrated silicon photonics products.
tags: interconnects, optics-photonics, semiconductors

Star Trek's glowing circuit boards may not be so crazy
tags: optics-photonics

More end products are integrating lasers with sensors and optics, opening new opportunities for photonics manufacturers.
tags: circuits-electronics, optics-photonics
NANOG is the professional association for Internet engineering, architecture and operations.
tags: antennas, circuits-electronics, optics-photonics, semiconductors

The breakthrough is taking full advantage of the orbital angular momentum properties of a coherent light source, thus enabling multiplexing.
tags: circuits-electronics, optics-photonics
Learn some basic, foundational info about fiber optic communication systems in this primer.
tags: optics-photonics

Our current networking technology was unfathomable just ten years ago. Now thanks to using fiber optics, data transmits faster than before.
tags: optics-photonics, semiconductors

Silicon photonics is a promising technology, but it may take a while.
tags: optics-photonics, semiconductors

Boston-based startup Lightelligence's optical machine learning accelerator has entered prototyping stage, the startup announced.
tags: optics-photonics, semiconductors

Optalysys, a startup based in the United Kingdom, has introduced an entry-level optical coprocessor, the first such system of its kind on the market. The
tags: optics-photonics
tags: circuits-electronics, optics-photonics

The FCC voted last Thursday to relax the rules for retiring copper wiring. This change was specifically aimed at Verizon and AT&T and is going to make it a lot easier for them to tear down old …
tags: optics-photonics

Over the past six decades, advances in computers and microprocessors have completely reshaped our world.
-->
linux
categories:
tags: linux
date: 06 Apr 2025
slug:linux-resources
-->
git
categories:
tags: git
date: 07 Apr 2025
slug:raindrop-git
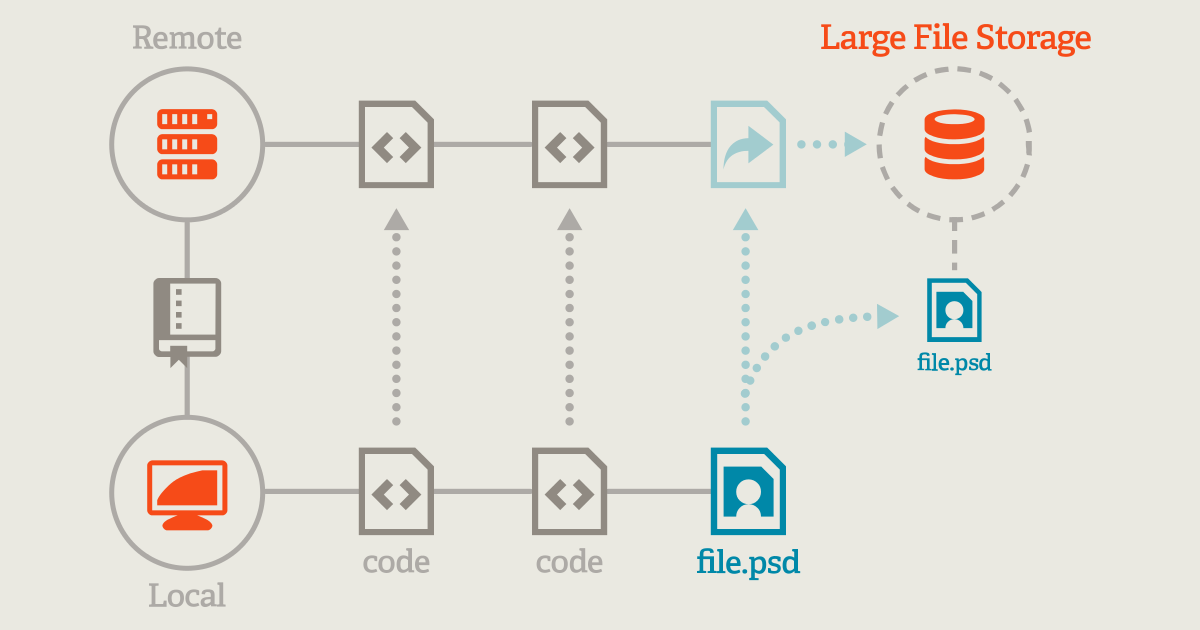
Git Large File Storage (LFS) replaces large files such as audio samples, videos, datasets, and graphics with text pointers inside Git, while storing the file contents on a remote server like GitHub.com or GitHub Enterprise.
Code Listings for the book: Optimization Algorithms. Manning Publications, 2024. - Optimization-Algorithms-Book/Code-Listings

Introduction Git is a distributed version control system that helps you track changes in your code, collaborate with others, and maintain a history of your project. Git Bash is a terminal application for Windows that provides a Unix-like command-line experience for using Git. This guide will walk you through setting up Git, using Git Bash, […]
Umami is a simple, fast, privacy-focused alternative to Google Analytics. - umami-software/umami

Use GitLab Secret Detection to scan a repository's commit history, including branches. View results within the GitLab UI with just a few lines of code added to a pipeline file.
Photo by Luke Chesser on Unsplash

Your ultimate Paper Club Starter Kit, from your friends at the Latent Space Paper Club, where we have now read 100 papers. Also: Announcing Latent Space Paper Club LIVE! at Neurips 2024! Join us!
This is a repo with links to everything you'd ever want to learn about data engineering - DataExpert-io/data-engineer-handbook

Learn strategies to secure secrets and what to do if secrets are accidentally leaked in a GitLab repository.
A powerful Git feature for temporarily saving code in progress

Where can you find projects dealing with advanced ML topics? GitHub is a perfect source with its many repositories. I’ve selected ten to talk about in this article.

Accidentally add a file that was not supposed to be added? If you have not made the commit yet, you can undo the git add and remove the file from staging.
Yes, you can totally push an empty commit in Git if you really want to. Here's how to do that.
llama3 implementation one matrix multiplication at a time - naklecha/llama3-from-scratch
Accepted as [NeurIPS 2024] Spotlight Presentation Paper - HVision-NKU/StoryDiffusion

Creating a GitHub Repository Collection Using GitHub Lists ✨ GitHub Lists is a relatively...
Implementing a ChatGPT-like LLM in PyTorch from scratch, step by step - rasbt/LLMs-from-scratch

If you use Github on a daily basis and still don't know about the Github CLI, I recommend you to keep...
GitHub is where people build software. More than 100 million people use GitHub to discover, fork, and contribute to over 420 million projects.

Improve your version control skills to resolve issues and maintain a clean Git repository.
Best Practices on Recommendation Systems.

Git rebasing is a crucial skill for developers working in collaborative environments. It involves...
Notebooks for the python tutorials of my youtube channel. See specific youtube video for link to specifc notebook. - lukepolson/youtube_channel

Using a monorepo causes a lot of performance challenges for git. Here's how we solve them at Canva.
Awk & Sed lessons for noobs. Using The UNIX School for reference - bjpcjp/awk-sed-lessons
If you no longer want to include a file in Git version control and want to add it to the .gitignore...
The simplest, fastest repository for training/finetuning medium-sized GPTs. - karpathy/nanoGPT

Introduction: The software development process has been transformed by the DevOps...

It's easy for an open-source project to buy fake GitHub stars. We share two approaches for detecting them.

Free resources for developers, board games and chess... what do they have in common? You can find...

I am sharing my personal experience through this article. When working with Git, it's important to...

Managing code and collaborating with others can be a daunting task, but Git makes it easy. This...

After a little over 5 years, I'm going to be leaving GitLab for my next adventure. It's no surprise to those of you who have been following me that I have absolutely loved my time there. I'm so proud of what we built—and I'm still proud and awed by

GitOps is a methodology for deploying and managing software applications using Git. It is also...

WHAT IS GIT? A lot of times, people are confused on the right commands to use to resolve git...

From the highly eclectic blog of Mark Dominus
A curated list of practical financial machine learning tools and applications. - firmai/financial-machine-learning

GitHub Copilot works alongside you directly in your editor, suggesting whole lines or entire functions for you.

How to rename master to main in Github Table of Contents Context setting Step...

As more companies strive to deliver software faster it becomes clear what legacy processes are...
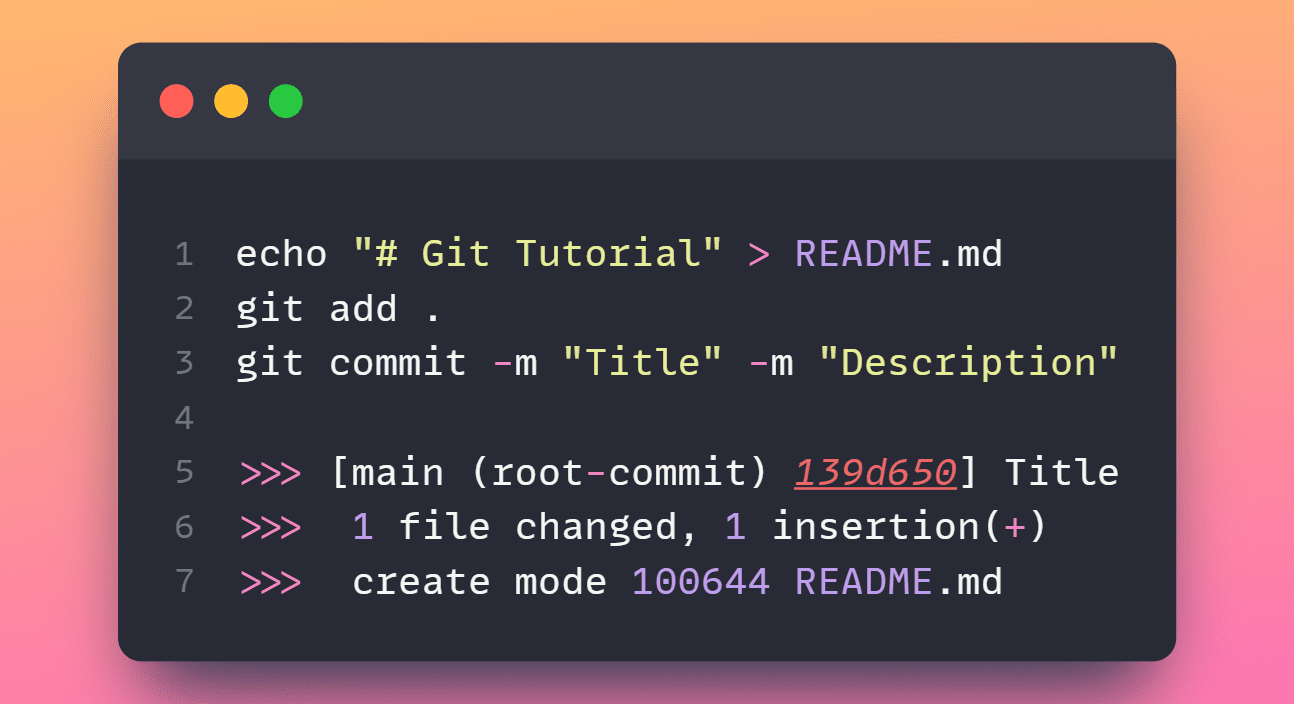
Learn essential Git commands for versioning and collaborating on data science projects.
Overview of Github Actions Overview of Github Actions - Part 1 Overview of Github Actions...
Overview of Github Actions Overview of Github Actions - Part 1 Overview of Github Actions...
GitHub is where people build software. More than 100 million people use GitHub to discover, fork, and contribute to over 420 million projects.

Render mathematical expressions in Markdown
Create diagrams to convey information through charts and graphs

And how to avoid them getting in there? — A surprisingly simple technique to handle it.

GitLab Handbook Company About GitLab Values Mission Vision Strategy Communication Culture TeamOps CEO Readme Office of the CEO Key Reviews Group Conversations E-Group Weekly Environmental, Social, and Governance Handbook About the Handbook Handbook Changelog Handbook Roadmap Handbook Escalation Handbook Usage Contribution Guide Editing the handbook Handbook Style Guide Handbook maintenance People Group Anti-Harassment Policy Global Volunteer Month Hiring Inclusion & Diversity Labor and Employment Notices Leadership Learning & Development Onboarding Offboarding Spending Company Money Talent Assessment Team Member Relations Philosophy Total Rewards Tools and Tips Engineering Customer Support Department Development Department Incubation Engineering Department Infrastructure Department Quality Department Security Practices Open Source Security Product Security Security Operations Threat Management Security Assurance Marketing Team Member Social Media Policy Blog Brand and Product Marketing Enterprise Data Integrated Marketing Sales Development Marketing Operations and Analytics Growth Developer Relations Corporate Communications Sales Alliances Commercial Customer Success Customer Success Management Reseller Channels Field Operations Reporting Solutions Architecture Finance Accounts Payable Accounts Receivable Business Technology Expenses Financial Planning & Analysis Payroll Procurement Tax Board meetings Internal Audit Equity Compensation Product Release posts About the GitLab Product Being a Product Manager at GitLab Product Principles Product Processes Product sections, stages, groups, and categories Product Development Flow Product Development Timeline Data for Product Managers Product Pricing Model Corporate Development / Acquisitions UX Department Legal and Corporate Affairs Commercial Corporate Corporate Development Employment Environment, Social, and Governance (ESG) Operations Privacy Product Risk Management and Dispute Resolution Trade Compliance
>>>, The default Python prompt of the interactive shell. Often seen for code examples which can be executed interactively in the interpreter.,,..., Can refer to:- The default Python prompt of the i...
An opinionated list of awesome Python frameworks, libraries, software and resources. - vinta/awesome-python
Sourced from O'Reilly ebook of the same name.
My working notes of "The Well-Grounded Rubyist" (Black & Leo), implemented in Jupyter Lab (Ruby kernel 2.7.0) - bjpcjp/well-grounded-rubyist-book-notes
NLP demo code, largely based on https://github.com/hundredblocks/concrete_NLP_tutorial - bjpcjp/NLP_workshop
Protect and discover secrets using Gitleaks 🔑.
The Secret Passions of Git Checkout · GitHub
Quick reference guide on fork and pull request workflow - susam/gitpr
Get started with Gitlab in practicable time.

Because they perform similar operations, it is easy to mix these commands up. Here are a few guidelines and rules for when each command should and should not be used.

A Hacker’s Guide to Git is now available as an e-book. You can purchase it on Leanpub. Introduction Git is currently the most widely used version control system in the world, mostly thanks to GitHub. By that measure, I’d argue that it’s a...
Learn about the major reasons behind Git repositories becoming too large and techniques to manage these repositories, from submodules to Git LFS.

I have launched a newsletter Git Better to help learn new tricks and advanced topics of Gi...

An Introduction to Version Control with Git
A starter kit for jekyll + bootstrap 4.
A beginner's guide to creating a personal website and blog using Jekyll and hosting it for free using GitHub Pages.

Shaumik examines ways to manage huge repositories with Git, including shallow cloning, cloning a single branch, using submodules and third-party extensions.
Git Hooks are scripts that run automatically every time a particular event occurs in a Git repository. Learn what they do and how to use them effectively.

Boom! A Git implosion means man hours down the drain! Avoid such scenarios by making use of Git patterns that suit your team and project. What Git workflow should you be using? Joe James serves up this in-depth guide to Git patterns for every kind of project.

Easily build, package, release, update, and deploy your project in any language—on GitHub or any external system—without having to run code yourself.

Download, install and maintain your own GitLab instance with various installation packages and downloads for Linux, Kubernetes, Docker, Google Cloud and more.
Github page does not allow customized plugins, and jekyll-tagging is not one of the supported GEMs of Github pages. It needs some effort to add tag support your Jekyll blog hosted by Github page. This blog shows you how to do this step by step.

This article is a collection of the 18 most frequently asked questions and their answers when it...
All Algorithms implemented in Python.
Compendium of free ML reading resources.
Just a place to store cheatsheets.
GitHub’s official command line tool.
I was writing a tiny website to display statistics of how much sponsored content a Youtube creator has over time when I noticed that I often write a small tool as a website that queries some data from a database and then displays it in a graph, a table, or similar. But if you want to use a

BI without the BS
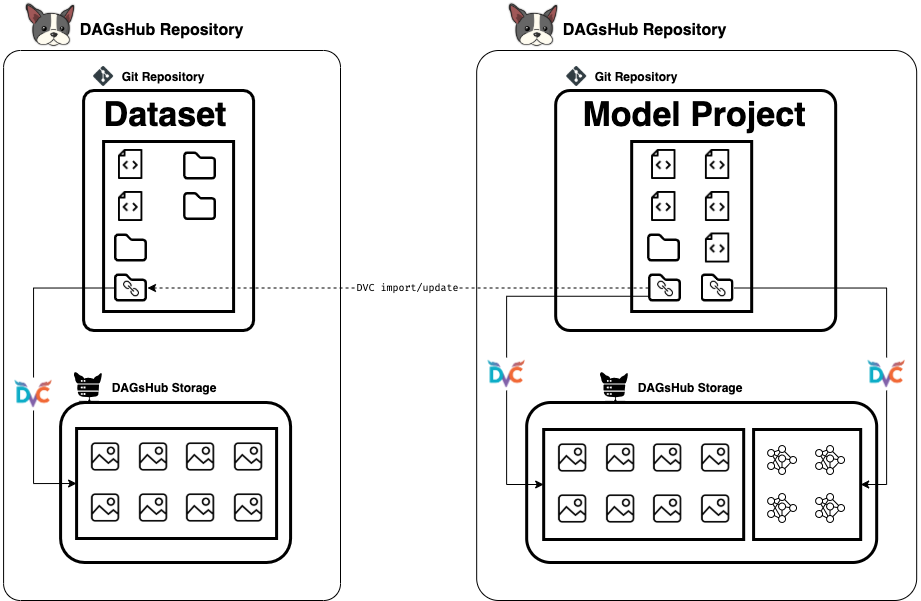
Create, maintain, and contribute to a long-living dataset that will update itself automatically across projects.

Introduction In this post, we'll be looking at the git stash command and its usage. We com...

How to use GitLab step by step, even if you have never heard of Git before
At this point, most developers use Git as a tool for collaboration. We have our rote-learned commands to pull, commit, and push. And of course, there's that one coworker who knows a bit more about Git than everyone else, who helps get us back on track whenever our local repos end up in a strange state. But what if I told you that Git can be a valuable tool without ever setting up a remote repository? I'm not just talking about having a working version of your code base to roll back to if you mess something up, although there's that too. Used correctly, Git can help to structure your work, identifying gaps in your test coverage and minimizing dead code.

While it's not something that everyone likes to do, I've always found it essential to write notes. Th...

Put your work in the spotlight!

With GitHub in the crosshairs of Chinese censors, Beijing is backing Gitee as its official hub, an open-source institution tailored for a closed internet.

A tutorial on how to build a GitHub App that predicts and applies issue labels using Tensorflow and public datasets.

Power-up Your Workflow with Cloud instance!
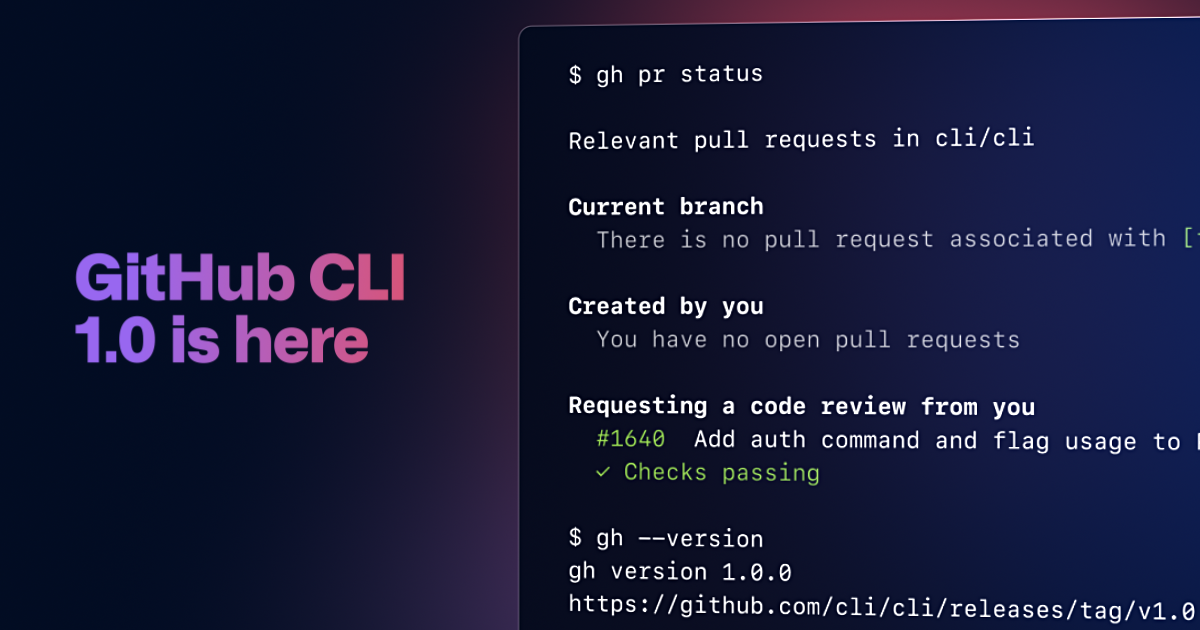
GitHub CLI brings GitHub to your terminal. It reduces context switching, helps you focus, and enables you to more easily script and create your own workflows. Earlier this year, we…
Flask is a straightforward and lightweight web application framework for Python applications. This guide walks you through how to write an application using Flask with a deployment on Heroku.
How to create simple CI/CD pipelines for automated deployments

Learn how to compare commits, delete stale branches, and write aliases to save you some time. It's time to dust off your command line and Git busy!

One of the most useful features of any version control system is the ability to "undo" your mistakes. In Git, "undo" can mean many slightly different things.
"The mother of all demo apps" — Exemplary fullstack Medium.com clone powered by React, Angular, Node, Django, and many more - gothinkster/realworld
After using Git for more than 2 years and teaching it to people, there are few tip that I would like to share.

In this context, *hooks are events you can subscribe to* in order to trigger some action. It is possible that you have been using them for a while without knowing.

For those hosting their own git repositories there are a number of solutions for creating convenient web-accessible front ends, but [mitxela] wasn’t quite satisfied with any of them. After tr…
The best way to get to know git is by using it.

Git stashes can be used to temporarily store code you don't want to commit. This video shows you how to create and apply Git Stashes.

Did you ever have a problem with Git that you knew a command could fix but you just couldn't remember what one it could be? With this tutorial, you can quickly and easily find it, and get a better understanding how each of them works.

In this tutorial we share with you a collection of tips that will help you manage your git repositories.

How hackers start their afternoon. HackerNoon is a free platform with 25k+ contributing writers. 100M+ humans have visited HackerNoon to learn about technology

The GitHub repository includes up-to-date learning resources, research papers, guides, popular tools, tutorials, projects, and datasets.

Are you adding all the correct files? Check the files that are part of a commit in git with this trick.
In order to use Git LFS, you'll need to download and install a new program that's separate from Git.
-->
r language links
categories:
tags: _r_
date: 08 Apr 2025
slug:r-booknotes
-->
object detection (machine vision)
categories:
tags: machine-vision object-detection
date: 08 Apr 2025
slug:object-detection

Yesterday (24/05/2024) marked the launch of the new state-of-the-art architecture named YOLOv10 [1], representing the cutting-edge in real-time object…
Learn the basics of this advanced computer vision task of object detection in an easy to understand multi-part beginner’s guide
eBay's new generative AI tool, rolling out on iOS first, can write a product listing from a single photo -- or so the company claims.

Learn how to build a surveillance system using WebRTC for low-latency and YOLO for object detection. This tutorial will guide you through the process of using computer vision and machine learning techniques to detect and track objects in real-time video streams. With this knowledge, you can create a surveillance system for security or other applications. However, there are challenges to consider when using cameras for object detection, including data privacy and security concerns, as well as technical limitations such as low image quality and lighting conditions. This article will teach you how to overcome some of these challenges and build a reliable surveillance system.

The YOLO algorithm offers high detection speed and performance through its one-forward propagation capability. In this tutorial, we will focus on YOLOv5.

Everything you need to know to use YOLOv7 in custom training scripts
Overview of how object detection works, and where to get started

this post is explaining how permutation importance works and how we can code it using ELI5

eview and comparison of the next generation object detection

A step-by-step tutorial using a minimal amount of code

A guide on object detection algorithms and libraries that covers use cases, technical details, and offers a look into modern applications.

Evaluating object detection models is not straightforward because each image can have many objects and each object can belong to different classes. This means that we need to measure if the model…

Building an app for blood cell count detection.

If you have ever had to tinker with anchor boxes, you were probably frustrated, confused and saying to yourself, “There must be another…

A recent article came out comparing public cloud providers’ face detection APIs. I was very surprised to see all of the detectors fail to…

**Object Detection** is a computer vision task in which the goal is to detect and locate objects of interest in an image or video. The task involves identifying the position and boundaries of objects in an image, and classifying the objects into different categories. It forms a crucial part of vision recognition, alongside [image classification](/task/image-classification) and [retrieval](/task/image-retrieval). The state-of-the-art methods can be categorized into two main types: one-stage methods and two stage-methods: - One-stage methods prioritize inference speed, and example models include YOLO, SSD and RetinaNet. - Two-stage methods prioritize detection accuracy, and example models include Faster R-CNN, Mask R-CNN and Cascade R-CNN. The most popular benchmark is the MSCOCO dataset. Models are typically evaluated according to a Mean Average Precision metric. ( Image credit: [Detectron](https://github.com/facebookresearch/detectron) )

How to set up and train a Yolo v5 Object Detection model?

Visual vocabulary advances novel object captioning by breaking free of paired sentence-image training data in vision and language pretraining. Discover how this method helps set new state of the art on the nocaps benchmark and bests CIDEr scores of humans.

State of the art modeling with image data augmentation and management

In this article we’ll serve the Tensorflow Object Detection API with Flask, Dockerize the Application and deploy it on Kubernetes.

An Introduction to Object Detection with YoloV3 for beginners
Object Detection using Yolo V3 and OpenCV .
The highest accuracy object detectors to date are based on a two-stage approach popularized by R-CNN, where a classifier is applied to a sparse set of candidate object locations. In contrast, one-stage detectors that are applied over a regular, dense sampling of possible object locations have the potential to be faster and simpler, but have trailed the accuracy of two-stage detectors thus far. In this paper, we investigate why this is the case. We discover that the extreme foreground-background class imbalance encountered during training of dense detectors is the central cause. We propose to address this class imbalance by reshaping the standard cross entropy loss such that it down-weights the loss assigned to well-classified examples. Our novel Focal Loss focuses training on a sparse set of hard examples and prevents the vast number of easy negatives from overwhelming the detector during training. To evaluate the effectiveness of our loss, we design and train a simple dense detector we call RetinaNet. Our results show that when trained with the focal loss, RetinaNet is able to match the speed of previous one-stage detectors while surpassing the accuracy of all existing state-of-the-art two-stage detectors. Code is at: https://github.com/facebookresearch/Detectron.
Easy Explanation!!! I tried
Object detection has been applied widely in video surveillance, self-driving cars, and object/people tracking. In this piece, we’ll look at the basics of object detection and review some of the most commonly-used algorithms and a few brand new approaches, as well.

In this tutorial I demonstrate how to apply object detection with deep learning and OpenCV + Python to real-time video streams and video files.

In this post, I'll explain the architecture of Faster R-CNN, starting with a high level overview, and then go over the details for each of the components. You'll be introduced to base networks, anchors as well as the region proposal network.
-->
langchain
categories:
tags: langchain llms
date: 08 Apr 2025
slug:langchain


This blog explores a detailed comparison between the OpenAI API and LangChain, highlighting key differences in performance and developer experience and the low level code for why these differences exist.

There are still some limitations when summarizing very large documents. Here are some ways to mitigate these effects.
Checked other resources I added a very descriptive title to this issue. I searched the LangChain documentation with the integrated search. I used the GitHub search to find a similar question and di...

If you're a developer or simply someone passionate about technology, you've likely encountered AI...
Learn how to unleash this Python library to enhance our AI usage.

LangChain is a Python library that helps you build GPT-powered applications in minutes. Get started with LangChain by building a simple question-answering app.

Guide to developing an informative QA bot with displayed sources used

Explained with an example use case.

LangChain has become a tremendously popular toolkit for building a wide range of LLM-powered applications, including chat, Q&A and document search. In this blogpost I re-implement some of the novel LangChain functionality as a learning exercise, looking at the low-level prompts it uses to create these higher level capabilities.

AI companies are using LangChain to supercharge their LLM apps. Here is a comprehensive guide of resources to build your LangChain + LLM journey. 🔗 What is… | 45 comments on LinkedIn
The handbook to the LangChain library for building applications around generative AI and large language models (LLMs).

A LangChain tutorial to build anything with large language models in Python

Introducing the new fully autonomous task manager that can create, track and prioritize your company's projects using artificial intelligence.

In this guest post, Filip Haltmayer, a Software Engineer at Zilliz, explains how LangChain and Milvus can enhance the usefulness of Large Language Models (LLMs) by allowing for the storage and retrieval of relevant documents. By integrating Milvus, a vector database, with LangChain, LLMs can process more tokens and improve their conversational abilities.

#langchain #chatgpt #gpt4 #artificialintelligence #automation #python #notion #productivity #datascience #pdf #machinelearning In this tutorial, learn how to easily extract information from a PDF document using LangChain and ChatGPT. I'll walk you through installing dependencies, loading and processing a PDF file, creating embeddings, and querying the PDF with natural language questions. 00:00 - Introduction 00:21 - Downloading a sample PDF 00:49 - Importing required modules 01:21 - Setting up the PDF path and loading the PDF 01:38 - Printing the first page of the PDF 01:53 - Creating embeddings and setting up the Vector database 02:24 - Creating a chat database chain 02:49 - Querying the PDF with a question 03:27 - Understanding the query results 04:00 - Conclusion Remember to like and subscribe for more tutorials on learning, research and AI! - Source code: https://github.com/EnkrateiaLucca/talk_pdf - Link to the medium article: https://medium.com/p/e723337f26a6 - Subscribe!: https://www.youtube.com/channel/UCu8WF59Scx9f3H1N_FgZUwQ - Join Medium: https://lucas-soares.medium.com/membership - Tiktok: https://www.tiktok.com/@enkrateialucca?lang=en - Twitter: https://twitter.com/LucasEnkrateia - LinkedIn: https://www.linkedin.com/in/lucas-soares-969044167/ Music from [www.epidemicsound.com](http://www.epidemicsound.com/)

Chat with your long PDF docs: load_qa_chain, RetrievalQA, VectorstoreIndexCreator, ConversationalRetrievalChain
-->
whistleblowing
categories:
tags: behavior whistleblowing
date: 08 Apr 2025
slug:whistleblowing

Why Don’t More People Support Whistleblowers? ...Legislatures Should Provide the Protections They Deserve [Author’s Note: I blew the whistle and was met with an experience so destructive that I did not have the words to describe what happened to me. I set out to learn if what happened to me is a known phenomenon and,

An analysis of more than 1.2 million records of internal reports made by employees of public U.S. companies reveals that whistleblowers are crucial to keeping firms healthy. The more employees use internal whistleblowing hotlines, the fewer lawsuits companies face, and the less money firms pay out in settlements. A one standard deviation increase in the use of an internal reporting system is associated with 6.9% fewer pending lawsuits and 20.4% less in aggregate settlement amounts over a three-year period.
-->
golang
categories:
tags: golang
date: 08 Apr 2025
slug:golang-resources
Patterns and Techniques for Writing High-Performance Applications with Go
Go makes it easy to create and use packages. In this tutorial, we’ll create a simple package that...

In this guide, we share 22 Go libraries that have proven reliable across multiple production systems we've built. We cover essential tools for HTTP routing, database access, messaging, observability, and testing - all based on our experience leading Go teams. For each library, we explain its key strengths and provide practical usage tips. We also highlight common mistakes to avoid when using these tools.
Go for DevOps: Learn how to use the Go language to automate servers, the cloud, Kubernetes, GitHub, Packer, and Terraform [Doak, John, Justice, David] on Amazon.com. *FREE* shipping on qualifying offers. Go for DevOps: Learn how to use the Go language to automate servers, the cloud, Kubernetes, GitHub, Packer, and Terraform

Structuring Go Projects is the number one question for Gophers, new and old. What are the best practices? What should you not do?
Switching to a new language is always a big step, especially when only one of your team members has prior experience with that language. Early this year, we switched Stream’s primary programming language from Python to Go. This post will explain some of the reasons why we decided to leave Python behind and make the switch to
A report of my positive and negative experiences with Go after using it for 6 months at work.
general purpose extensions to golang's database/sql - jmoiron/sqlx

Thanks to its static binaries and cross-compiling, building and distributing command-line apps in Go...

Learn how to build a simple load balancer server in Go. Table of Contents: What is a Load...

Get your new site up and running quickly with Hugo.

Using the power of randomness to answer scientific questions.
Library for multi-armed bandit selection strategies, including efficient deterministic implementations of Thompson sampling and epsilon-greedy. - stitchfix/mab
Take a book on learning how to write Go code and add in the mindset of test-driven development the fun way. When you read a book or watch a course, it's a great accomplishment. You're learning how ...
In Lesson 5 of the Golang course, we will continue with banking transactions. We will build a new module named transactions that we

This is a step by step tutorial on how to deploy a Golang app on Heroku. Requirements. H...

How understanding the processor architecture can help us in optimizing performance?

Learn why and how in this handy tutorial on object-oriented programming in Go.
What is the complete path between visiting thepiratebay and sublimating an mp3 file from thin air? In this post, we'll implement enough of the BitTorrent protocol to download Debian. Look at the [Source code](https://github.com/veggiedefender/torrent-client/) or skip to the [last bit](/posts/torrent#putting-it-all-together).

What's coming in Go 1.14 GoSheffield, 2019 - Daniel Martí

Announcing go.dev, which answers: who else is using Go, what do they use it for, and how can I find useful Go packages?
What the Go team is planning for Go modules in 2019.
Go 1.12 improves support for debugging optimized binaries.
An introduction to the basic operations needed to get started with Go modules.
Thoughts on Go performance optimization.
Learn Go with test-driven development.

What's coming in Go 1.13 GoSheffield, 2019 - Daniel Martí

Things I've learned porting a 50 thousand lines of code from Java to Go

Introduction of a new feature-rich golang Jupyter kernel
-->
speaking
categories:
tags: speaking speech
date: 08 Apr 2025
slug:speech

PDF | Burden of proof has recently come to be a topic of interest in argumentation systems for artificial intelligence (Prakken and Sartor, 2006, 2007,... | Find, read and cite all the research you need on ResearchGate
Soon enough, artificial intelligence may be able to recreate the sounds — but there will be something missing.

Do conversations end when people want them to? Surprisingly, behavioral science provides no answer to this fundamental question about the most ubiq...

Or "Spiderman Is My Boyfriend"

Visit http://TED.com to get our entire library of TED Talks, transcripts, translations, personalized talk recommendations and more. Simon Sinek presents a simple but powerful model for how leaders inspire action, starting with a golden circle and the question "Why?" His examples include Apple, Martin Luther King, and the Wright brothers -- and as a counterpoint Tivo, which (until a recent court victory that tripled its stock price) appeared to be struggling. The TED Talks channel features the best talks and performances from the TED Conference, where the world's leading thinkers and doers give the talk of their lives in 18 minutes (or less). Look for talks on Technology, Entertainment and Design -- plus science, business, global issues, the arts and more. You're welcome to link to or embed these videos, forward them to others and share these ideas with people you know. Follow TED on Twitter: http://twitter.com/TEDTalks Like TED on Facebook: http://facebook.com/TED Subscribe to our channel: http://youtube.com/TED TED's videos may be used for non-commercial purposes under a Creative Commons License, Attribution–Non Commercial–No Derivatives (or the CC BY – NC – ND 4.0 International) and in accordance with our TED Talks Usage Policy (https://www.ted.com/about/our-organization/our-policies-terms/ted-talks-usage-policy). For more information on using TED for commercial purposes (e.g. employee learning, in a film or online course), please submit a Media Request at https://media-requests.ted.com

A nearly 50-year-old Harvard University study found that the word "because" helps people make more persuasive requests. Here's why, says a Wharton professor.
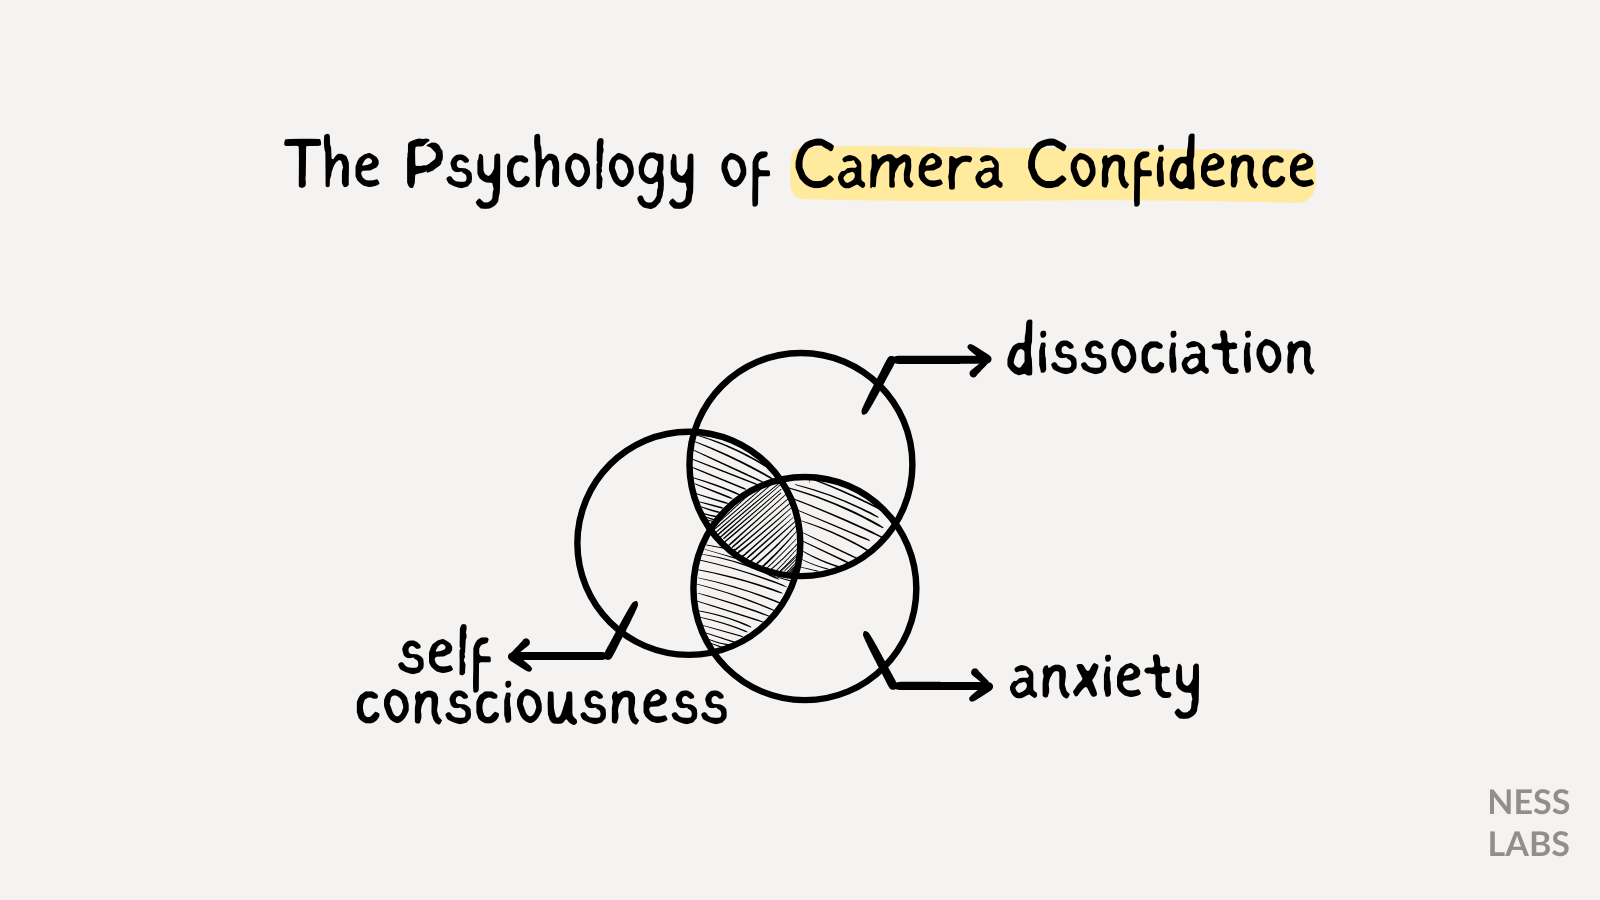
In a world dominated by video, we know we’d benefit from communicating effortlessly through video content. But many of us struggle with camera confidence. This is because our fear of talking to a camera is deeply rooted in our survival instincts.

It could also make you more attractive to potential long-term partners.

Here's how to give a eulogy, and other difficult speeches, according to a Stanford business school lecturer.

The cognitive work involved in lying is relevant to lie detection and could help explain why some people are better liars

Persuasive rhetorical techniques from the speeches of Demosthenes in Classical Athens to Cicero in the Late Roman Republic.

Have a great idea but sure how to sell it? Investor and teacher Mar Hershenson has you covered. Whether it's sharing a new product with a client or vying for a promotion, these three steps will help you tell an irresistible story and get the "yes" you're looking for.

When you have to communicate a difficult organizational decision to employees, it’s hard to know how much information to provide when you can’t be fully transparent yet. Saying nothing can undermine people’s trust in your motives and compassion, whereas saying too much can leave people feeling overwhelmed and vulnerable as they struggle to process the information and implications. Striking the right balance between these two extremes is a tricky exercise for leaders. The author presents five strategies to help you figure out what to say and do when you can’t yet be fully transparent with your employees.
We all know people who talk with their hands. Turns out there’s quite a bit of research around the relationship between language and gestures.
When trying to make language either more concrete or more abstract, one helpful approach is to focus on either the how or the why.
Industrial genius Carl Braun believed that clear thinking and clear communication go hand in hand. Here the guide on writing productively to get things done.
Technological advances in natural language processing, computational linguistics, and machine learning, combined with the digitization of everything from cover letters to conversations, have revolutionized our ability to analyze language, yielding unprecedented insights. Think of it as a new science of language. Many of the findings suggest that small changes in the words we use can increase our ability to persuade and influence others.

Following a simple, three-part framework can make your introductions smoother, easier, and more memorable.

In 2002 I was driving to a hedge fund manager's house to hopefully raise money from him. I was two hours late. This was pre-GPS and I had no cell phone. I was totally lost. I kept playing over and over again "Lose Yourself" by Eminem. I was afraid this was my one shot and I was blowing it. I was even crying in my car. I was going broke and I felt this was my one chance. What a loser.
Clone a voice in 5 seconds to generate arbitrary speech in real-time - CorentinJ/Real-Time-Voice-Cloning

Improv comedy is about more than making people laugh. It can help performers be more creative and self-assured — and combat anxiety, both on and off stage.

Transformational leaders are exceptional communicators. In this piece, the author outlines four communication strategies to help motivate and inspire your team: 1) Use short words to talk about hard things. 2) Choose sticky metaphors to reinforce key concepts. 3) Humanize data to create value. 4). Make mission your mantra to align teams.
Talking to someone who gets defensive can be frustrating. So, what can you do? Here's how to sidestep someone's personal fortifications.

Examples of hidden ways people drain one other’s energy in social interaction—and what to do about it
I took part in a 6 week stand-up comedy course for beginners at The Comedy Store in Central London. At the end of the course, myself and the other co...

This one of a series of essays on speaking. Find more here. You’ve written a great talk, you’ve made your deck (or not!) and you’ve practiced. But have you considered how you’ll move while speaking…
Here’s what the best leaders do.

We are really bad at navigating a key transition point during one of the most basic social interactions

Mastering the art of public speaking has nothing to do with your personality, with overcoming shyness or learning to act confident. It's a technical skill that nearly anyone can acquire — just like cooking.

Not all introverts suffer from public speaking anxiety. But if you do, here are some ideas to eliminate it and become a strong communicator.
Politicians and other public figures deploy particular rhetorical devices to communicate their ideas and to convince people, and it’s time that we all learned how to use them, says speechwriter Sim…
I was enjoying a sazerac with a old friend of mine at a local watering hole. And by watering hole, I mean incredibly hip farm-to-table restaurant full of young techies because we were in Mountain V…
What does it take to become a more convincing communicator? New research suggests that linguistic mirroring — that is, adjusting your communication style to match that of your audience — is an effective tool to increase your ability to influence others. In this piece, the authors describe four key dimensions of linguistic mirroring, as well as several tactical strategies for leaders looking to win over a client, judge, or other important evaluator. Ultimately, they argue that building genuine relationships with key evaluators is the best way to gain insight into their linguistic preferences — but it’s up to all of us to make sure that we use the power of linguistic mirroring for good.
Silero Models: pre-trained speech-to-text, text-to-speech and text-enhancement models made embarrassingly simple - snakers4/silero-models

It’s Drift’s and it’s brilliant. Here’s why.
To engage leaders, colleagues, and clients, use this simple technique
“Nothing in the world is more exciting than a moment of sudden discovery or invention, and many more people are capable of experiencing such moments than is sometimes thought.”
Bill Carmody is a twenty-five year global keynote speaker. He’s had the incredible privilege to present in Brazil with Sir Richard Branson and in India with executives from Fortune 100 companies. Recently he had the distinct privilege to teach several of the UK Brexit government officials how to become more powerful public speakers. Bill Carmody is a twenty-five year global keynote speaker. He’s had the incredible privilege to present in Brazil with Sir Richard Branson and in India with executives from Fortune 100 companies. Recently he had the distinct privilege to teach several of the UK Brexit government officials how to become more powerful public speakers. This talk was given at a TEDx event using the TED conference format but independently organized by a local community. Learn more at https://www.ted.com/tedx
If you want to help people, don’t give them advice. Do this instead.
:extract_focal()/https%3A%2F%2Fpocket-syndicated-images.s3.amazonaws.com%2Farticles%2F6362%2F1620942878_GettyImages-imsev208-053.jpg)
These common expressions can cause listeners to think twice.
The term "bullshitting" (in addition to its colloquial use) is a technical psychological term that means, "communication characterised by an intent to be convincing or impressive without concern for truth." This is not the same as lying, in which one knows what they are saying is false. Bullshitters simply are indifferent to whether or not
The way your name or a word rolls off the tongue can have some surprising effects on the judgements we make.
Many nationalities recognise that there is a tone of voice that is instantly alluring, but do some speakers have an unfair advantage?

Communicating better can help you achieve your goals and deepen your relationships.

Sometimes, it really is what you say that makes a difference.
It’s important to understand that when you, as a leader, communicate with your team, using weaker words weakens your message and blunts your ability to inspire people. It’s not enough to just throw thoughts out there and hope for the best. You need to actively recommend ideas and assert their worthiness in all of your communications. For example, consider these “power words”: “I’m proposing (not “sharing”) an idea that will make our process more efficient.” “I’m suggesting (not “sharing”) a new logo that better conveys our brand message.” “I’m recommending (not “sharing”) a campaign to make our workplace more diverse.” Ultimately, audiences respond more actively to big points than to small words, but thoughtful leaders need to assess both, knowing that the more powerfully they come across — even in small ways — the greater impact they have on the people they hope to inspire.
Please enjoy this transcript of my interview with entertainment icon Jerry Seinfeld (@jerryseinfeld). Jerry’s comedy career took off after his first appearance on The Tonight Show with Johnny Carson in 1981. Eight years later, he teamed up with fellow comedian Larry David to create what was to become the most successful comedy series in the … Continue reading "The Tim Ferriss Show Transcripts: Jerry Seinfeld — A Comedy Legend’s Systems, Routines, and Methods for Success (#485)"
Assertive communication is about compromise.
Tips from a comedian and a journalist on the art of going from small talk to big ideas. Try these out at the next summer wedding reception.
Five tactics to silence the person trying to make you squirm.

Public speaking can feel like an ordeal, but take a lesson from the ancients: it’s a skill you can develop like any other
Talking out loud to oneself is a technology for thinking that allows us to clarify and sharpen our approach to a problem

When I signed up for a life of conducting orchestras, I didn’t realize I’d also need to learn how to handle enormous audiences
:extract_focal()/http%3A%2F%2Fstatic.nautil.us%2F7892_f880d0d6a01ba52fcfe6475defc13e0f.jpg)
Have you ever found yourself counting ums and uhs?

“No speech was ever too short.”

Nonviolent communication (NVC) is a popular method of conflict resolution that privileges unbiased evidence and specificity.
Look like you‘re trusting your gut and others will trust you.
Express and receive communication empathically using the four-part Nonviolent Communication process developed by Marshall B. Rosenberg, Ph.D.
Ramona Smith used an interesting body-language technique to win the Toastmasters annual public-speaking competition last month in Chicago.
-->
dns (devops)
categories:
tags: devops dns webdev
date: 08 Apr 2025
slug:dns

What is a CDN ? How do CDNs work ?

Free and useful services over DNS accessible on command line

Cloudflare is not the only service that helps you boost your website's speed and secure it. Here are some alternatives.

DNS, or the Domain Name System, is an integral part of how the internet functions today. However, the way that DNS works is often quite mysterious for new a…

Domain names are a key part of the Internet infrastructure. They provide a human-readable address for any web server available on the Internet.

You can build a functional CDN on an 8-year-old laptop while you're sitting at a coffee shop. Here's what a CDN you put together in five hours might look like.

Custom domains for websites, web apps, and email
Use our WHOIS lookup tool to search available domain names or current domain owners. Start your search today!

Performance Action Pack consists of tools and techniques to efficiently audit and optimize your Ruby on Rails application.

Domain names provide the internet much more user-friendly way of referencing servers, but have you ever wondered how it works under the covers?
Every website, large or small, started with an idea, rapidly followed by registering a domain. Most registrars offer promotions for your initial domain registration and then quietly hike the price with each renewal.

Sometimes people want to get a certificate for the hostname “localhost”, either for use in local development, or for distribution with a native application that needs to communicate with a web application. Let’s Encrypt can’t provide certificates for “localhost” because nobody uniquely owns it, and it’s not rooted in a top level domain like “.com” or “.net”. It’s possible to set up your own domain name that happens to resolve to 127.
-->
jq (json tools)
categories:
tags: jq json
date: 08 Apr 2025
slug:jq

The jq command provides a consistent way to manipulate JSON data without leaving the command line. Learn how it works by tinkering in a jq playground.

Learn ways to convert from JSON to YAML and from YAML to JSON using the Linux command line.
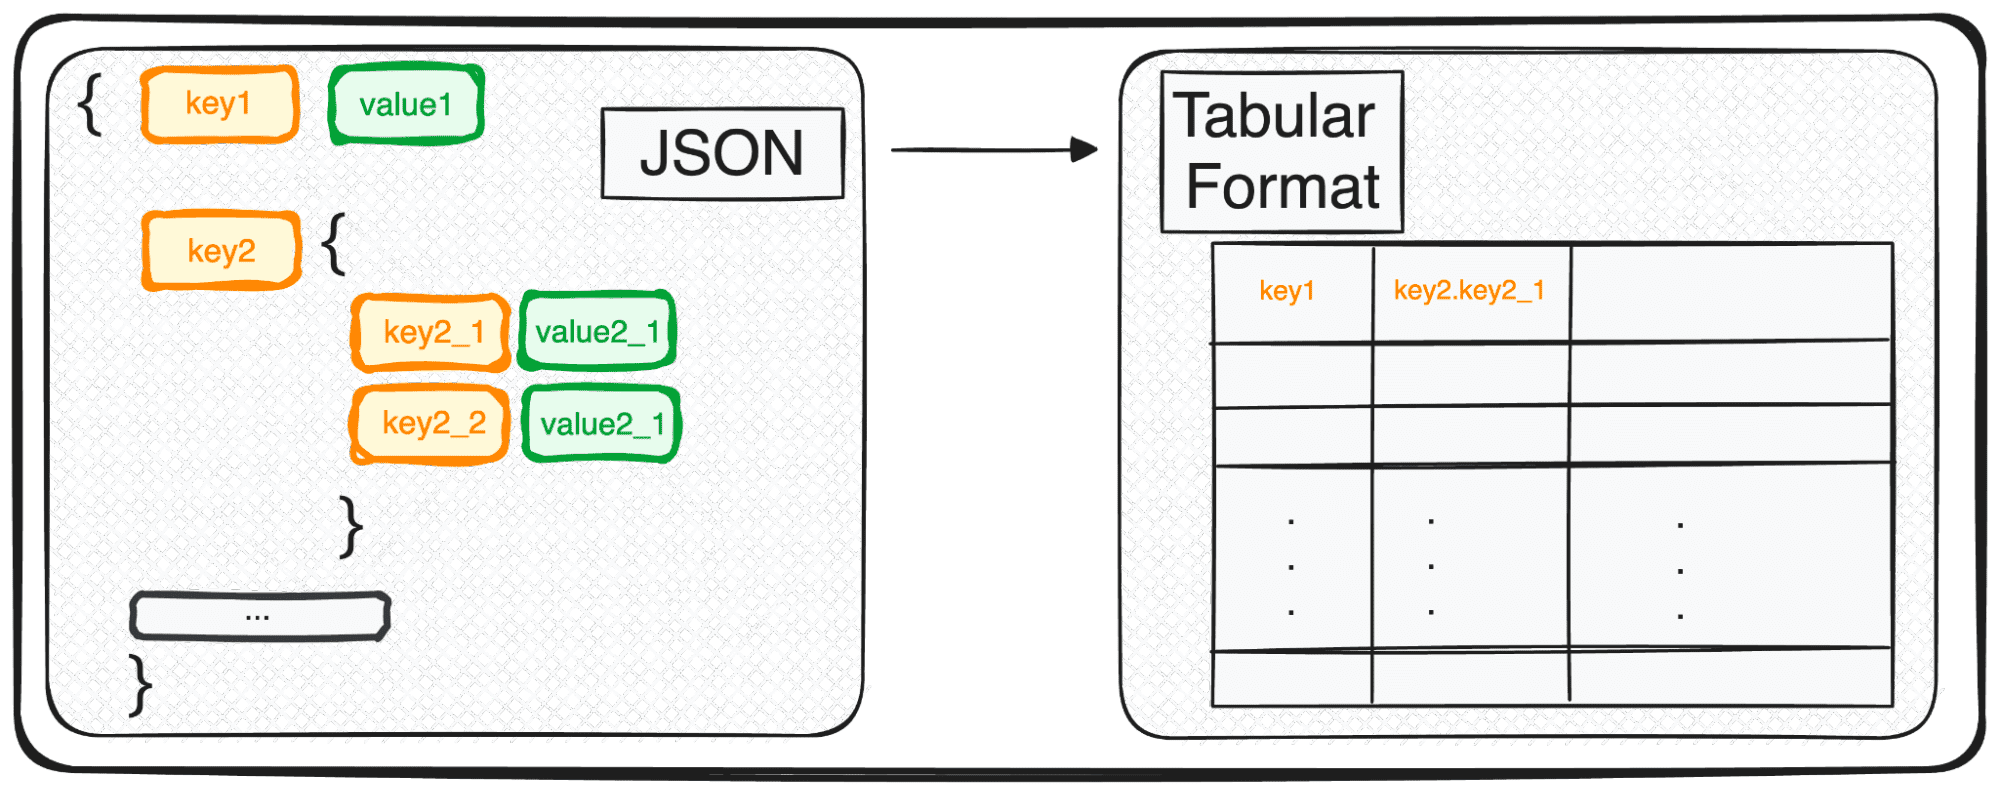
Navigating Complex Data Structures with Python's json_normalize.

You have probably seen or used the YAML format in configuration files. YAML (a recursive acronym for...
yq is a portable command-line YAML, JSON, XML, CSV, TOML and properties processor - mikefarah/yq

This page explains how to convert JSON to CSV format using Linux, macOS, *BSD or Unix command-line utilities.

As part of our recently announced deal with Apple Music [https://genius.com/a/genius-gets-smart-with-apple-music], you can now view Genius lyrics for your favorite music within the Apple Music app. We deliver our lyrics to Apple via a nightly export of newline-delimited JSON objects. With millions of songs in our
jq for binary formats - tool, language and decoders for working with binary and text formats - wader/fq
JSONLint is the free online validator, json formatter, and json beautifier tool for JSON, a lightweight data-interchange format. You can format json, validate json, with a quick and easy copy+paste.

Most of us use love and use the jq command. It works on Linux or Unix-like systems to extract data from JSON documents. Recently I found htmlq, which is like jq and written in Rust lang. Imagine being able to sed or grep for HTML data. We can search, slice, and filter HTML data with htmlq. Let us see how to install and use this handy tool on Linux or Unix and play with HTML data.

This brief guide explains how to parse and pretty print JSON with a command line tool called jq in Linux operating systems.
Format and validate JSON data so that it can easily be read by human beings.
JSONLint is the free online validator, json formatter, and json beautifier tool for JSON, a lightweight data-interchange format. You can format json, validate json, with a quick and easy copy+paste.

Turn your Google Sheets into a REST API. Build websites, widgets, apps, prototypes, and tons more. Leave the backend to us.
A series of how to examples on using jq, a command-line JSON processor
Introduction In the last year or two I have worked on and off on making PyPy's JSON faster, particularly when parsing large JSON files. I...
-->
groupthink (behavior)
categories:
tags: behavior
date: 08 Apr 2025
slug:groupthink

At the heart of the Trump administration’s Signal scandal lies the familiar psychological pitfall of groupthink

The inside story of the investigation—and the catastrophe it laid bare

Why intellectual laziness doesn’t have to lead to groupthink.
-->
secrecy (behavior)
categories:
tags: behavior
date: 08 Apr 2025
slug:secrecy-effect

Advertisers often depict their products being consumed in a social setting, but increasingly they also depict people secretly consuming their products. Will consumers like a product more if they are prompted to consume it in secret? New research explores this question, finding that prompting women to think about consuming products in secret has an impact, not only on product evaluations, but also on behavior and willingness to pay for those products. The authors refer to this effect as the “secrecy effect.”

While the core philosophy of blockchains is trustlessness, trusted execution environments can be integral to proof-of-stake blockchains.
-->
economics
categories:
tags: economics
date: 08 Apr 2025
slug:economics

There are options beyond simply raising your prices or absorbing extra costs.
Individual construction tasks have, on average, not gotten cheaper since at least the 1950s. Bricks haven’t gotten cheaper since the mid-19th century, despite massive improvements in brickmaking technology. Construction has a reputation for being slow to innovate, but innovations seem to spread in construction at roughly similar rates to other industries, like car manufacturing or agriculture. Single family […]

What can you sell at a pawn shop? We explain what pawn shops buy, plus how to get the most money. Find price details for electronics, clothing, and more.

Inside of a pawn shop / Photo Credit: PawnGuru Pawning something you own can be a major challenge. You want to get the highest amount for your item, but you don’t know which pawn shop will pay the most. Reality TV shows like “Hardcore Pawn” and “Pawn Stars” demonstrate how pawn [...]

Pawn shops are America's lenders of last resort. But even for the same item, the amount pawn shops will loan you can vary more than 1,000%.

A forgotten Nixon-era negotiation offers urgent lessons for our new age of economic warfare.

Limiting production is helping to make its sports cars coveted—and the company the most valuable automaker in Europe

How a federal policy change in the 1980s created the modern food desert
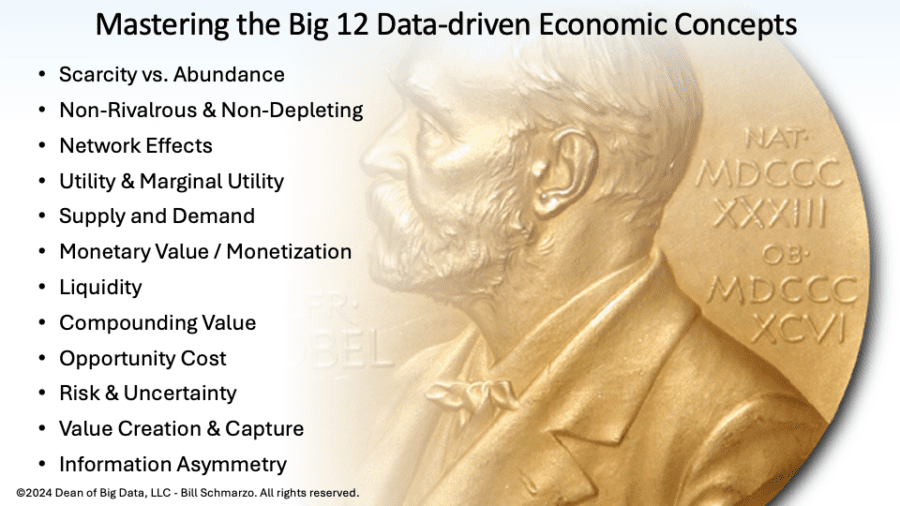
“If you want to change the game, change the frame.” The game has certainly changed with the data era, and maybe the most drastic change driven by data has occurred in economics, the foundation upon which our modern society is built and sustained. Understanding and mastering the transition from “traditional” economics to modern data-driven economics… Read More »Mastering the Big 12 Data-driven Economic Concepts

The Venezuelan economy has suffered from decades of disastrous economic policies – and more recently, from economic sanctions. The country has seen the largest ever decline in living standards outside war, revolution or the collapse of the state.
That is the topic of my latest Bloomberg column, here is one key segment: Game theory can help explain how ranked choice voting changes the behavior of candidates, as well as the elites who support them. Consider a ranked choice election that has five or six candidates. To win the election, you can’t just appeal […]
Plus! Diff Jobs; Making a Market; Financial Innovation; IRL; Open-Ended Liabilities; Meme Stock Relapse

In the first quarter of this year, private investors poured 40% more money into clean energy and electric vehicles than they did in Q1 2023.


if the centralizing forces of data and compute hold, open and closed-source AI cannot both dominate long-term

Why are buildings today simple and austere, while buildings of the past were ornate and elaborately ornamented? The answer is not the cost of labor.

China’s economy has reached a dead end. Getting out will mean more trade friction with the United States.
When Paris F.C. made its tickets free, it began an experiment into the connection between fans and teams, and posed a question about the value of big crowds to televised sports.

A visual explainer of the numbers behind America’s ubiquitous bargain-basement chains.
Or: You Know The Economy is Good When You Can't Find a Babysitter

On why the free exchange of ideas is a complex breeding ground for truth, appealing falsehoods, and self-serving rationalisations.

The economy, explained by your Diet Coke and soda prices, kind of.

US schools fall short on financial literacy. So a generation saddled with money woes has developed language of its own

Ranked-choice voting could be on the November ballot in four states, a sign of the system’s rising popularity. Most conservatives have opposed it. But some say that could be changing.

An Appalachian school district’s daring experiment in economic integration.

Economic dynamism is vaulting the southern portion of the vast region ahead of its northern cousin.

The retailer discounts the importance of in-store safety, the regulatory agency says, and was named a severe violator this fall.
"The Market for 'Lemons': Quality Uncertainty and the Market Mechanism" is a widely cited seminal paper in the field of economics which explores the concept of asymmetric information in markets. The paper was written in 1970 by George Akerlof and published in the Quarterly Journal of Economics. The paper's findings have since been applied to many other types of markets. However, Akerlof's research focused solely on the market for used cars.
I recently read Elinor Ostrom’s Governing the Commons and have been evangelizing it so enthusiastically that I figured I’d do a quick…

Economist Elinor Ostrom believed in the power of economics to “bring out the best in humans.” The way to do it, she thought, was to help them build community.

Teams were once considered poor, unpredictable investments. Today they’re among the most coveted assets in the world. What changed?
This is a book summary of The Art of Profitability by Adrian Slywotzky. Read The Art of Profitability summary to review key ideas and lessons from the book.

He is a music sensation, but Girl Talk neither sings nor plays an instrument. He plays music off reinforced Toughbook laptops protected from his sweat by layers of plastic wrap.

From the trolley parks of the early 20th century to the theme parks of today, these spaces of shared pleasure have been both a reflection of urban life, and an escape from it.

Taking the kids to a baseball game, a movie, or Disneyland is a bigger financial commitment than it used to be for middle-class families.

"For your fans, what’s important to them?” said West Virginia athletic director Shane Lyons of scheduling rivals after realignment.

Ignore the haters: living standards have improved a lot since the 1980s.

Stealing soap is almost as good as stealing cash.
The ubiquitous dollar store is the American dream writ small.

Can the West still provide the arsenal of democracy?
Americans are rightly angry about inflation. A strong labor market is not enough reason to celebrate. But, we are coming out of, not going into the hurricane.

Financial gurus want young home shoppers to stop complaining and cut back on small luxuries. But there are broader affordability issues at play.
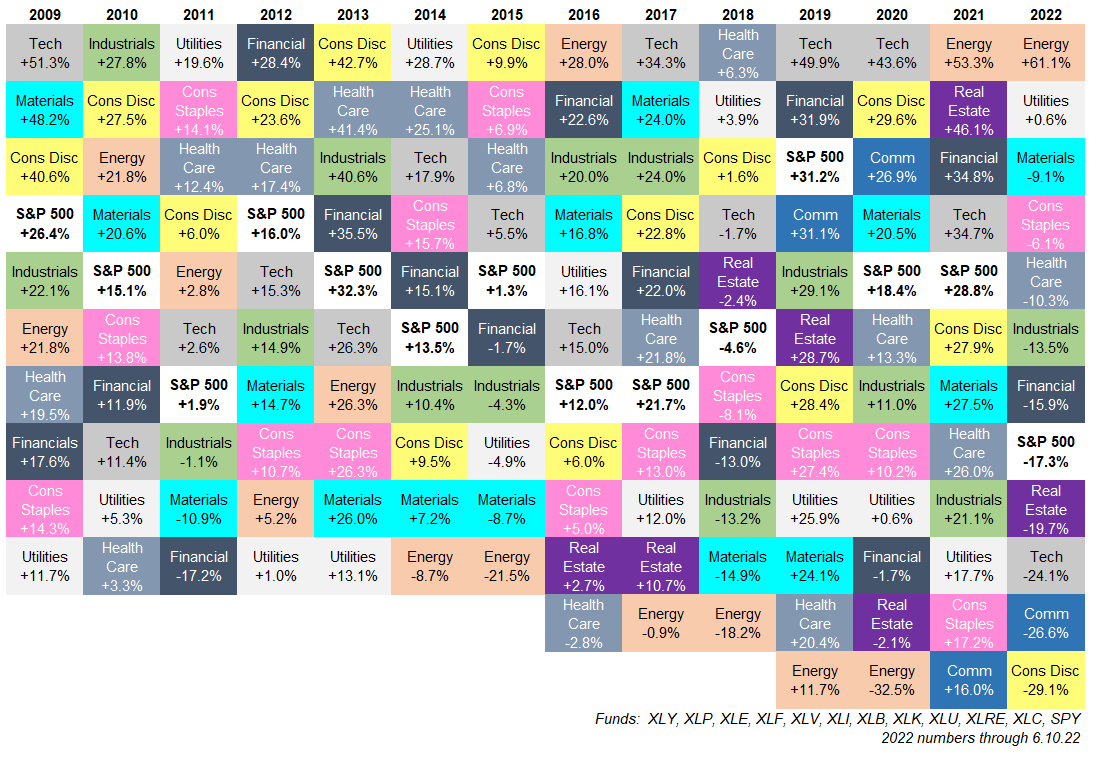
Why it's so difficult to pick the best sectors to invest in.

Plus! Smart Margin; Peak College?; Two-Sided Markets; Bonds; Diff Jobs
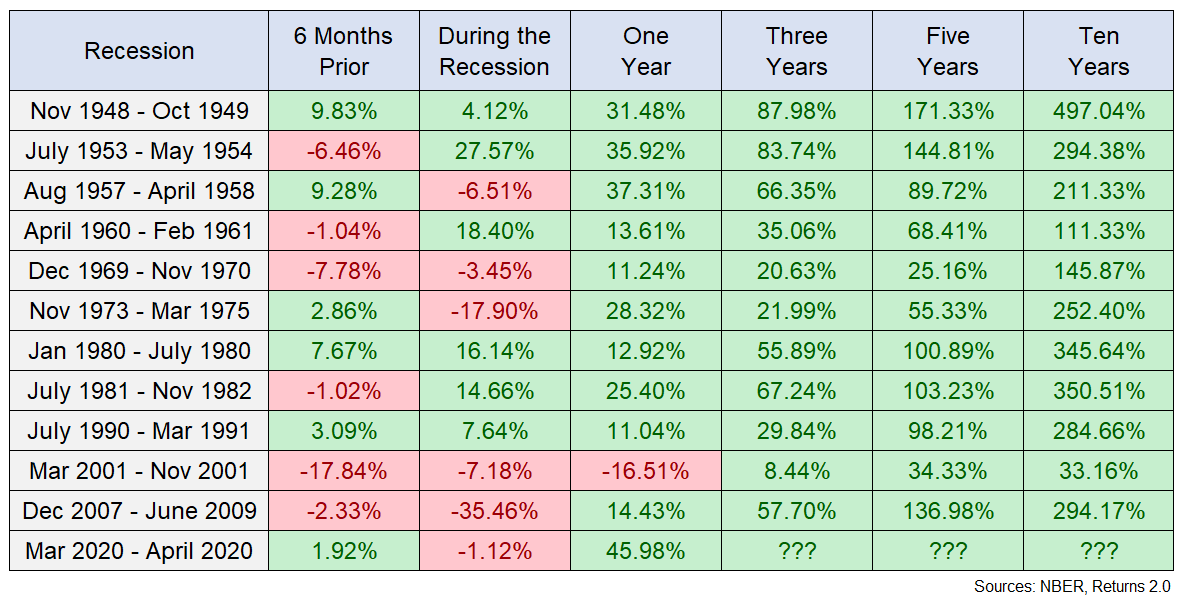
It's not always easy to predict the timing of a recession and what that means for the stock market.
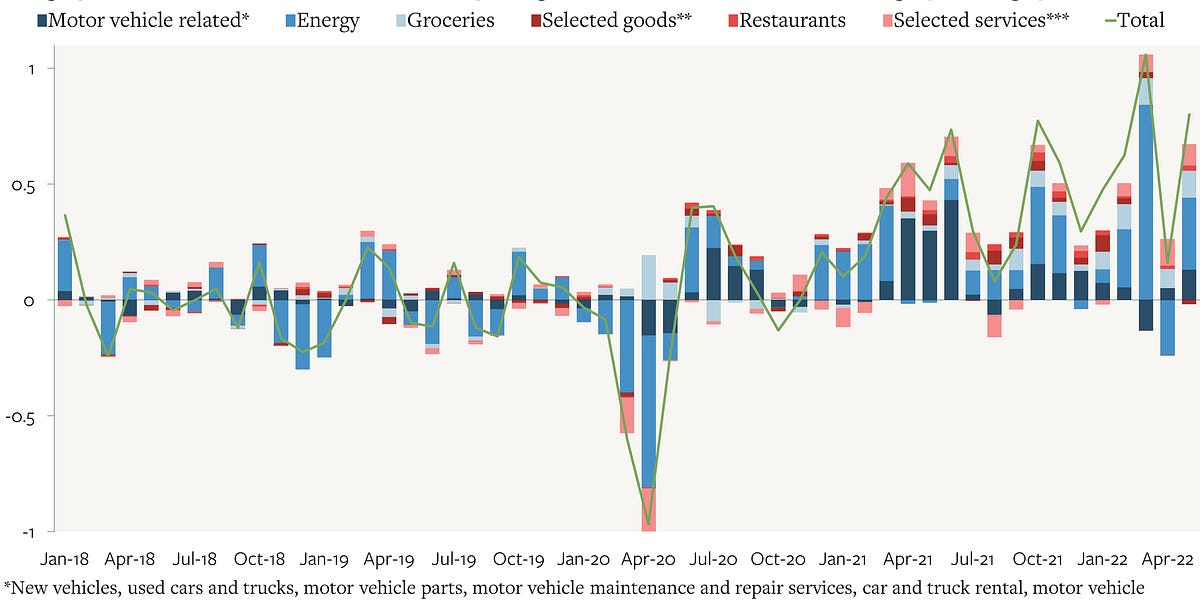
Some charts on what's good and what's bad.

Ever wondered what trait most affects your income? Turns out it’s your rank in a hierarchy.
We are a community of activists, artists, entrepreneurs, and scholars committed to using mechanism design to inspire radical social change.
How the impeccably credentialed, improbably charming economic historian supplanted the dirtbag left.

The commodities are so cyclical.

Contests that non-contestants consume for entertainment are a fixture of economic, cultural and political life. We exploit injury-induced changes to teams’ line

Originally published: December 2021 When price inflation occurs, it can be a very challenging time for everyone. In that type of environment, prices of goods and services often go up faster than wages, and the public and policymakers wish to constrain them. Historically, when price inflation becomes rampant, policymakers tend to put in place price […]

Prospect theory proposes that when making decisions people use a reference point to frame prospective alternative outcomes as either potential gains or losses; when considering prospective gains, they are risk-averse and prefer certainty, but when considering prospective losses, they are risk-prone and prefer to risk the possibility of larger but uncertain losses. However, when setting

Forget ‘peak oil’. Nafeez Ahmed reveals how the oil and gas industries are cannibalising themselves as the costs of fossil fuel extraction mount

Let’s Build a Chip – We lay out the costs of building a chip – with spreadsheets!

Far from being profoundly destructive, we humans have deep capacities for sharing resources with generosity and foresight
By every measure I can think of, ranked-choice voting is a superior way to hold a modern election. When a group of people want to decide something at the national or even the organizational level, …
Some lawmakers in Colorado tried so-called quadratic voting—and it worked.
A PBS documentary concerning the disparity between those who have advanced technology and those who still live primitively.

Markets tend to favor unequal distributions of market share and profits, with a few leaders emerging in any industry.Winner-take-all markets are hard to disrupt and suppress the entry of new players by locking in market share for leading players.


To stop society's unsustainable demand for ever-more resources, we need to decentralize and localize our economy. Combining the new ledger technology with UBI may be the way to make that happen.
-->
semantic segmentation (machine vision)
categories:
tags: machine-vision
date: 08 Apr 2025
slug:semantic-segmentation
A team of researchers at MIT CSAIL, in collaboration with Cornell University and Microsoft, have developed STEGO, an algorithm able to identify images down to the individual pixel.

Revealing whats behind the state-of-the art algorithm HRNet

**Semantic Segmentation** is a computer vision task in which the goal is to categorize each pixel in an image into a class or object. The goal is to produce a dense pixel-wise segmentation map of an image, where each pixel is assigned to a specific class or object. Some example benchmarks for this task are Cityscapes, PASCAL VOC and ADE20K. Models are usually evaluated with the Mean Intersection-Over-Union (Mean IoU) and Pixel Accuracy metrics. ( Image credit: [CSAILVision](https://github.com/CSAILVision/semantic-segmentation-pytorch) )
-->
chatgpt prompting
categories:
tags: chatgpt
date: 08 Apr 2025
slug:chatgpt-prompting

Building a fully functional, code-editing agent in less than 400 lines.
Doug Turnbull recently wrote about how [all search is structured now](https://softwaredoug.com/blog/2025/04/02/all-search-structured-now): Many times, even a small open source LLM will be able to turn a search query into reasonable …
Google's Gemma 3 model (the 27B variant is particularly capable, I've been trying it out [via Ollama](https://ollama.com/library/gemma3)) supports function calling exclusively through prompt engineering. The official documentation describes two recommended …

Solid techniques to get really good results from any LLM

OpenAI's president Greg Brockman recently shared this cool template for prompting their reasoning models o1/o3. Turns out, this is great for ANY reasoning… | 32 comments on LinkedIn
Johann Rehberger snagged a copy of the [ChatGPT Operator](https://simonwillison.net/2025/Jan/23/introducing-operator/) system prompt. As usual, the system prompt doubles as better written documentation than any of the official sources. It asks users …

[caption align=
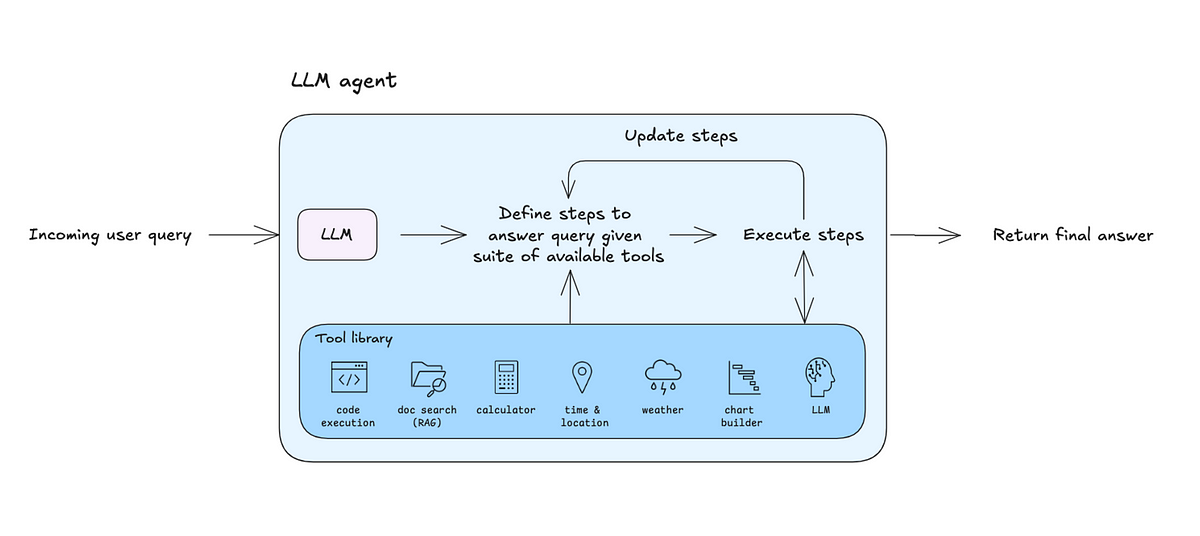

Prompt engineering is crucial to leveraging ChatGPT's capabilities, enabling users to elicit relevant, accurate, high-quality responses from the model. As language models like ChatGPT become more sophisticated, mastering the art of crafting effective prompts has become essential. This comprehensive overview delves into prompt engineering principles, techniques, and best practices, providing a detailed understanding drawn from multiple authoritative sources. Understanding Prompt Engineering Prompt engineering involves the deliberate design and refinement of input prompts to influence the output of a language model like ChatGPT. The efficacy of a prompt directly impacts the relevance and coherence of the AI's responses. Effective prompt engineering

Amazon trained me to write evidence-based narratives. I love the format. It’s a clear and compelling way to present information to drive…

In the developing field of Artificial Intelligence (AI), the ability to think quickly has become increasingly significant. The necessity of communicating with AI models efficiently becomes critical as these models get more complex. In this article we will explain a number of sophisticated prompt engineering strategies, simplifying these difficult ideas through straightforward human metaphors. The techniques and their examples have been discussed to see how they resemble human approaches to problem-solving. Chaining Methods Analogy: Solving a problem step-by-step. Chaining techniques are similar to solving an issue one step at a time. Chaining techniques include directing the AI via a systematic

27 examples (with actual prompts) of how product managers are using Perplexity today

Apply these techniques when crafting prompts for large language models to elicit more relevant responses.

Generative AI (GenAI) tools have come a long way. Believe it or not, the first generative AI tools were introduced in the 1960s in a Chatbot. Still, it was only in 2014 that generative adversarial networks (GANs) were introduced, a type of Machine Learning (ML) algorithm that allowed generative AI to finally create authentic images, videos, and audio of real people. In 2024, we can create anything imaginable using generative AI tools like ChatGPT, DALL-E, and others. However, there is a problem. We can use those AI tools but can not get the most out of them or use them

Prompt engineering has burgeoned into a pivotal technique for augmenting the capabilities of large language models (LLMs) and vision-language models (VLMs), utilizing task-specific instructions or prompts to amplify model efficacy without altering core model parameters. These prompts range from natural language instructions that provide context to guide the model to learning vector representations that activate relevant knowledge, fostering success in myriad applications like question-answering and commonsense reasoning. Despite its burgeoning use, a systematic organization and understanding of the diverse prompt engineering methods still need to be discovered. This survey by researchers from the Indian Institute of Technology Patna, Stanford University,
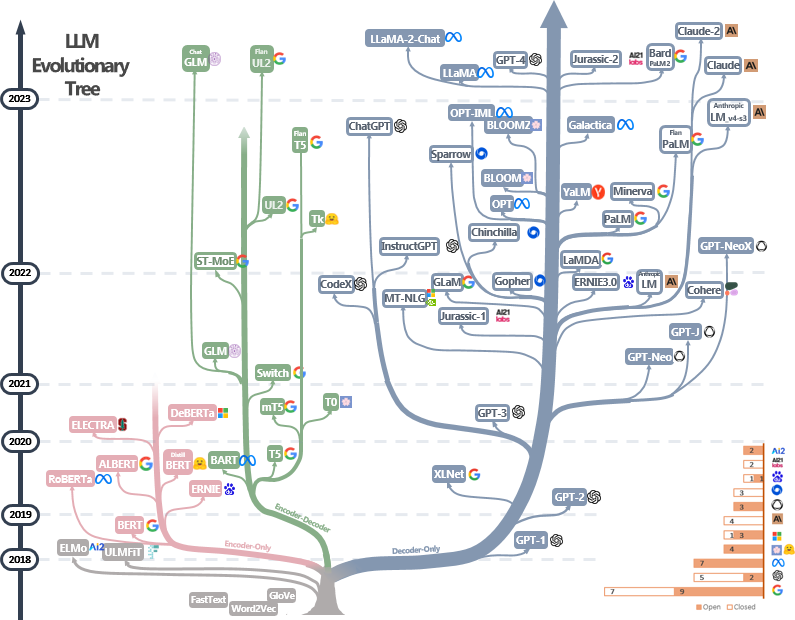
How do we communicate effectively with LLMs?

Sure, anyone can use OpenAI’s chatbot. But with smart engineering, you can get way more interesting results.

In the rapidly evolving world of artificial intelligence, the ability to communicate effectively with AI tools has become an indispensable skill. Whether you're generating content, solving complex data problems, or creating stunning digital art, the quality of the outcomes you receive is directly…

Unlock the power of GPT-4 summarization with Chain of Density (CoD), a technique that attempts to balance information density for high-quality summaries.

Explore how the Skeleton-of-Thought prompt engineering technique enhances generative AI by reducing latency, offering structured output, and optimizing projects.

Learn how to use GPT / LLMs to create complex summaries such as for medical text

Our first Promptpack for businesses
7 prompting tricks, Langchain, and Python example code
3 levels of using LLMs in practice
In this chapter, you'll learn how to concatenate multiple endpoints in order to generate text. You'll apply this by creating a story.

A practical and simple approach for “reasoning” with LLMs

Understanding one of the most effective techniques to improve the effectiveness of prompts in LLM applications.

This article delves into the concept of Chain-of-Thought (CoT) prompting, a technique that enhances the reasoning capabilities of large language models (LLMs). It discusses the principles behind CoT prompting, its application, and its impact on the performance of LLMs.

An effective prompt is the first step in benefitting from ChatGPT. That's the challenge — an effective prompt.

In this article, we will demonstrate how to use different prompts to ask ChatGPT for help and make...

Explore how clear syntax can enable you to communicate intent to language models, and also help ensure that outputs are easy to parse

ChatGPT can generate usable content. But it can also analyze existing content — articles, descriptions — and suggest improvements for SEO and social media.

Learn how standard greedy tokenization introduces a subtle and powerful bias that can have all kinds of unintended consequences.
Our weekly selection of must-read Editors’ Picks and original features

Prompt engineering is an emerging skill and one companies are looking to hire for as they employ more AI tools. And yet dedicated prompt engineering roles may be somewhat short-lived as workforces become more proficient in using the tools.
A Comprehensive Overview of Prompt Engineering
Prompt Engineering, also known as In-Context Prompting, refers to methods for how to communicate with LLM to steer its behavior for desired outcomes without updating the model weights. It is an empirical science and the effect of prompt engineering methods can vary a lot among models, thus requiring heavy experimentation and heuristics. This post only focuses on prompt engineering for autoregressive language models, so nothing with Cloze tests, image generation or multimodality models.

Garbage in, garbage out has never been more true.
This repository offers a comprehensive collection of tutorials and implementations for Prompt Engineering techniques, ranging from fundamental concepts to advanced strategies. It serves as an essen...

A comparison between a report written by a human and one composed by AI reveals the weaknesses of the latter when it comes to journalism.
-->
chatgpt
categories:
tags: chatgpt
date: 08 Apr 2025
slug:chatgpt
Johann Rehberger snagged a copy of the [ChatGPT Operator](https://simonwillison.net/2025/Jan/23/introducing-operator/) system prompt. As usual, the system prompt doubles as better written documentation than any of the official sources. It asks users …

A detailed analysis of ChatGPT search and Google's performance across 62 queries, with scoring metrics and practical examples.

A.I. insiders are falling for Claude, a chatbot from Anthropic. Is it a passing fad, or a preview of artificial relationships to come?

The power of a robust honor code—and abundant institutional resources

The popular online chatbot can now access and deliver information from across the internet in real time, including news, stock prices and sports scores.
Introduction In this post, I want to introduce Mark, a simple CLI tool that uses Markdown and its syntax to interact naturally with the GPT4-vision/GPT4o models.
Amazon trained me to write evidence-based narratives. I love the format. It’s a clear and compelling way to present information to drive…

We tested OpenAI’s ChatGPT against Microsoft’s Copilot and Google’s Gemini, along with Perplexity and Anthropic’s Claude. Here’s how they ranked.

The search engine war is heating up. ChatGPT may introduce its search engine, which will rival Google, on Monday. Although

Making your custom GPTs is just one of the ways to leverage your content strategy and use ChatGPT...

Claude and ChatGPT are two compelling options in AI chatbots, each with unique features and capabilities. To discern their strengths and suitability for various applications, let's compare these two AI chatbots comprehensively. What is Claude? Claude is an AI chatbot developed by an Anthropic AI renowned for its ability to simulate human-like conversations. Built on sophisticated NLP algorithms, Claude excels in engaging users in meaningful dialogues across a spectrum of topics. What sets Claude apart is its emphasis on understanding the user's persona and tailoring responses to match individual preferences and communication styles. This personalised touch enhances user experience, fostering
/cdn.vox-cdn.com/uploads/chorus_asset/file/24936950/potatoking.png)
More AI image generation tools at your fingertips.

What is ChatGPT? ChatGPT, developed by OpenAI, is an AI platform renowned for its conversational AI capabilities. Leveraging the power of the Generative Pre-trained Transformer models, ChatGPT generates human-like text responses across various topics, from casual conversations to complex, technical discussions. Its ability to engage users with coherent, contextually relevant dialogues stands out, making it highly versatile for various applications, including content creation, education, customer service, and more. Its integration with tools like DALL-E for image generation from textual descriptions and its continual updates for enhanced performance showcase its commitment to providing an engaging and innovative user experience. ChatGPT Key
Sure, anyone can use OpenAI’s chatbot. But with smart engineering, you can get way more interesting results.

New experiments show that very young children are better at solving creative puzzles than ChatGPT and other AI models
Identify and target personas of keywords, competitors, Reddit discussions, and more.


OpenAI's ChatGPT Vision is making waves in the world of artificial intelligence, but what exactly is it, and how can
Learn how you can access Bing Chat in Microsoft Edge. Experience AI in Microsoft Edge and ask Bing Chat complex questions, get summarized information, and more.

Bard is now Gemini. Get help with writing, planning, learning, and more from Google AI.

KDnuggets' latest cheat sheet covers 10 curated hands-on projects to boost data science workflows with ChatGPT across ML, NLP, and full stack dev, including links to full project details.

Do you use Python, Pandas, and Seaborn to collect, analyze, and plot data? Then you'll be amazed by what ChatGPT can do, when using ChatGPT+, GPT-4 model, and the plugin for Noteable's version of Jupyter notebooks. [UPDATE/NOTE: This was my first summary of Noteable and ChatGPT. I have done more experiments, which you can see here: https://www.youtube.com/watch?v=2WUZ0b-hUDU] In this video, I show you how I got things set up for using Noteable (and world headlines), then put together a query, You'll see how it goes well, where it goes wrong, and what sort of code I can create using just English-language descriptions of my plans. And I show you what's happening behind the scenes, as we see the JSON being written. This is all brand new and exciting, and I hope that you'll post suggestions and ideas in the comments for how we can take this even further! And if you're interested in analyzing data with Pandas, check out Bamboo Weekly at https://www.BambooWeekly.com/, where I look at current events through the eyes of data analysis.

Hey guys, welcome back to my R-tips newsletter. In today’s R-tip, I’m sharing a super common data science task (one that saved me 20 hours per week)… You’re getting the cheat code to automating Google Sheets. Plus, I’m sharing exactly how I made this a...

How you can fine-tune OpenAI’s GPT-3.5 Turbo model to perform new tasks using your custom data

Using ChatGPT & OpenAI's GPT API, this code tutorial teaches how to chat with PDFs, automate PDF tasks, and build PDF chatbots.

An Introduction to Auto-GPT
Explained with an example use case.

GPT, explained simply, in a metaphor of potion.

10 ChatGPT Plugins for Data Science Cheat Sheet • Noteable Plugin: The ChatGPT Plugin That Automates Data Analysis • 3 Ways to Access Claude AI for Free • What are Vector Databases and Why Are They Important for LLMs? • A Data Scientist’s Essential Guide to Exploratory Data Analysis

Transform your life with these ChatGPT’s hidden gems.
An effective prompt is the first step in benefitting from ChatGPT. That's the challenge — an effective prompt.
In this article, we will demonstrate how to use different prompts to ask ChatGPT for help and make...
ChatGPT can generate usable content. But it can also analyze existing content — articles, descriptions — and suggest improvements for SEO and social media.

The next generation of AI is leaving behind the viral chatbot.

On Tuesday, the result arrived via email: “NOT GUILTY.”

1) Reinforcement Learning with Human Feedback(RLHF) 2) The RLHF paper, 3) The transformer reinforcement learning framework.

More languages, image inputs, and extension support among Bard features at I/O ’23.
Use the power of ChatGPT from within your own apps using OpenAI’s API and this guide.
LangChain + OpenAI + Panel + HuggingFace

It's like learning a new language - kind of.

Sundays, The Sequence Scope brings a summary of the most important research papers, technology releases and VC funding deals in the artificial intelligence space.

Exploring why AI won’t replace designers, but rather enhance their work.

Dolly 2.0 could spark a new wave of fully open source LLMs similar to ChatGPT.

Artificial intelligence models have found their way into many people’s lives, for work and for fun.
Chain-of-Thought (CoT) prompting can effectively elicit complex multi-step reasoning from Large Language Models~(LLMs). For example, by simply adding CoT instruction ``Let's think step-by-step''...
#langchain #chatgpt #gpt4 #artificialintelligence #automation #python #notion #productivity #datascience #pdf #machinelearning In this tutorial, learn how to easily extract information from a PDF document using LangChain and ChatGPT. I'll walk you through installing dependencies, loading and processing a PDF file, creating embeddings, and querying the PDF with natural language questions. 00:00 - Introduction 00:21 - Downloading a sample PDF 00:49 - Importing required modules 01:21 - Setting up the PDF path and loading the PDF 01:38 - Printing the first page of the PDF 01:53 - Creating embeddings and setting up the Vector database 02:24 - Creating a chat database chain 02:49 - Querying the PDF with a question 03:27 - Understanding the query results 04:00 - Conclusion Remember to like and subscribe for more tutorials on learning, research and AI! - Source code: https://github.com/EnkrateiaLucca/talk_pdf - Link to the medium article: https://medium.com/p/e723337f26a6 - Subscribe!: https://www.youtube.com/channel/UCu8WF59Scx9f3H1N_FgZUwQ - Join Medium: https://lucas-soares.medium.com/membership - Tiktok: https://www.tiktok.com/@enkrateialucca?lang=en - Twitter: https://twitter.com/LucasEnkrateia - LinkedIn: https://www.linkedin.com/in/lucas-soares-969044167/ Music from [www.epidemicsound.com](http://www.epidemicsound.com/)

ChatGPT is a deep-learning model created by OpenAI whose ability to generate human-like prose has made AI a topic of conversation. Learn more

AI multiplies your efforts. I found out by how much...
OpenAI today announced its support of new third-party plugins for ChatGPT, and it already has Twitter buzzing about the company's potential platform play.
Quote "ChatGPT is like a genie in a bottle, but instead of granting you three wishes, it gives you endless responses until you realize you've been chatting with a machine for hours." 😂
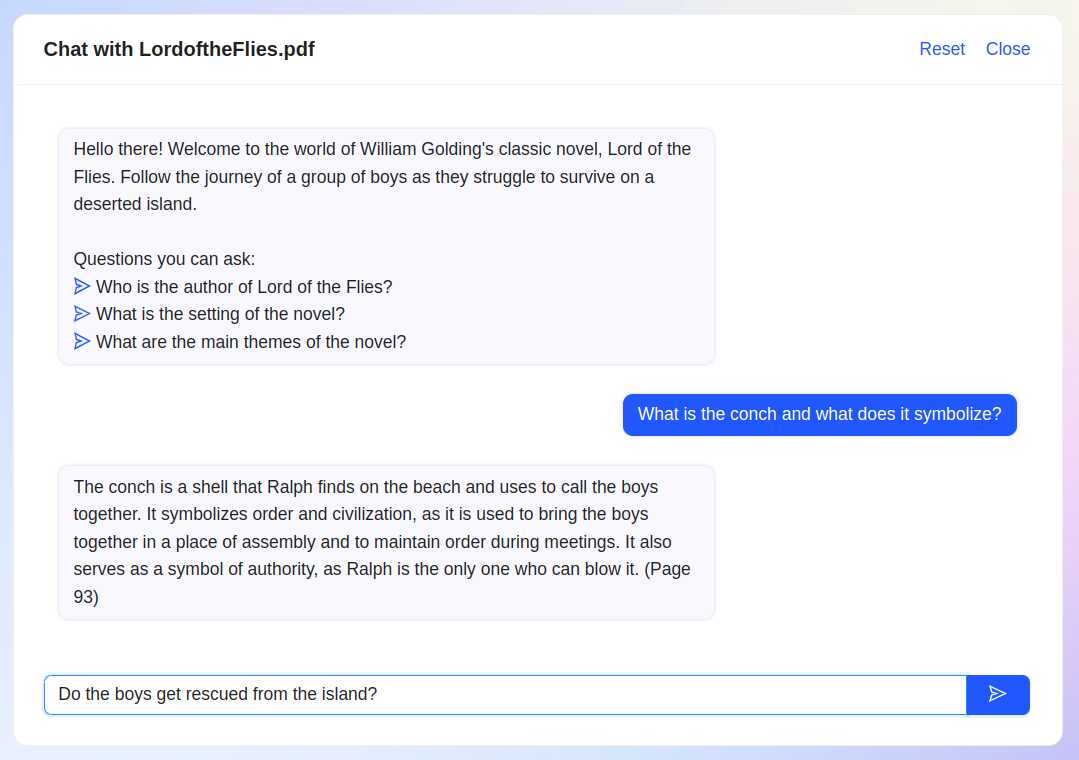
ChatPDF is the fast and easy way to chat with any PDF, free and without sign-in. Talk to books, research papers, manuals, essays, legal contracts, whatever you have! The intelligence revolution is here, ChatGPT was just the beginning!

ChatGPT recently passed the U.S. Medical Licensing Exam, but using it for a real-world medical diagnosis would quickly turn deadly.

ChatGPT invented a hit puzzle game called Sumplete that could rival Wordle. There's just one problem: It already exists.

It’s March 2023 and right now ChatGPT, the amazing AI chatbot tool from OpenAI, is all the rage. But when OpenAI released their public web API for ChatGPT on the 1st of March you might have been a bit disappointed. If you’re an R user, that is. Because, when scrolling through the release announcement you find that there is a python package to use this new API, but no R package. I’m here to say: Don’t be disappointed! As long as there is a web API for a service then it’s going to be easy to use this service from R, no specialized package needed. So here’s an example of how to use the new (as of March 2023) ChatGPT API from R. But know that when the next AI API hotness comes out (likely April 2023, or so) then it’s going to be easy to interface with that from R, as well. Calling the ChatGPT web API from R To use the ChatGPT API in any way you first need to sign up and get an API key: The “password” you need to access the web API. It could look something like "sk-5xWWxmbnJvbWU4-M212Z2g5dzlu-MzhucmI5Yj-l4c2RkdmZ26". Of course, that’s not my real API key because that’s something you should keep secret! With an API key at hand you now look up the documentation and learn that this is how you would send a request to the API from the terminal: curl https://api.openai.com/v1/chat/completions \ -H "Authorization: Bearer $OPENAI_API_KEY" \ -H "Content-Type: application/json" \ -d '{ "model": "gpt-3.5-turbo", "messages": [{"role": "user", "content": "What is a banana?"}] }' But how do we send a request to the API using R? What we can do is to “replicate” this call using httr: a popular R package to send HTTP requests. Here’s how this request would be made using httr (with the curl lines as comments above the corresponding httr code) library(httr) api_key

LLaMA-13B reportedly outperforms ChatGPT-like tech despite being 10x smaller.

OpenAI’s chatbot offers paraphrases, whereas Google offers quotes. Which do we prefer?
During the last two years there has been a plethora of large generative models such as ChatGPT or Stable Diffusion that have been published. Concretely, these models are able to perform tasks such...

I was playing around with OpenAI (GPT-3) today, building a reasonably complicated email parser for a...

The wave of enthusiasm around generative networks feels like another Imagenet moment - a step change in what ‘AI’ can do that could generalise far beyond the cool demos. What can it create, and where are the humans in the loop?
Everything I understand about chatgpt · GitHub

A conversational AI system that listens, learns, and challenges

The OpenAI ChatGPT chatbot was just released and is already quite popular. Say hello to the newest chatbot with one
The first obvious casualty of large language models is homework: the real training for everyone, though, and the best way to leverage AI, will be in verifying and editing information.

Unpack the key features and marketing insights of SearchGPT, OpenAI’s innovative search tool and its potential to rival Google’s dominance.
The Artifex blog covers the latest news and updates regarding Ghostscript, MuPDF, and SmartOffice. Subjects cover PDF and Postscript, open source, office productivity, new releases, and upcoming events.
A comparison between a report written by a human and one composed by AI reveals the weaknesses of the latter when it comes to journalism.
-->
jekyll (ruby)
categories:
tags: jekyll ruby webdev
date: 12 Apr 2025
slug:jekyll

Since Kamal 2 can host multiple sites on the same server, I am consolidating my apps into larger hosts so I have less servers to worry about. Most of my apps are Rails apps, but I have a few static jekyll sites like this blog and I decided to look into how could I move this site to a server I host other Rails apps on.

How Jekyll uses URLs and how to link posts, pages, assets, and other resources together.
This Cheat Sheet gives an overview of Liquid syntax commands one might encounter while developing a Jekyll website.
Liquid cheatsheet, Comment, Escape liquid tags, Include, Size, Array, Dynamic collection navigation, Unless, Upcase, Current date, Capture, Remove-first, Cap...
:page_with_curl: Liquid tag for displaying GitHub Gists in Jekyll sites. - jekyll/jekyll-gist
How to list all your jekyll posts by tags using the liquid templating syntax and markdown
Introduction Jekyll offers a multitude of blog related functionality out-of-the-box, all which make creating a custom blog much easier. One of these features is excerpts, which allow you to display a subset of text from blog post – useful on a list page to give the reader a quick insight into what each post is about. When creating my blog, I found this feature useful, but it had one limitation which I needed to work around – configuring where the excerpt should start from.
You have probably seen or used the YAML format in configuration files. YAML (a recursive acronym for...
Validate, Verify and Reformat your YAML documents, optimized for Ruby on Rails

Static sites were previously composed of hard-coded files comprising HTML templates, and maintaining...

Learn everything Jekyll is capable of from an exhaustive list of variables, tags, and filters.

Jekyll traverses your site looking for files to process. Any files with front matter are subject to processing. For each of these files, Jekyll makes a variety of data available via Liquid. The following is a reference of the available data.
A quick overview of using collections in Jekyll to create powerful taxonomies around your content.

By Farrel Burns Brought to you by CloudCannon, the Git-based CMS for Jekyll. What you’ll...
Most websites I build start off as a blank Jekyll site with Tailwind CSS on top.

When we (the Engineering Blog committee here at C.H. Robinson) were working on the Mobile Apps Battery Management series, we were looking for a way to link a group of similar posts into a multi-post series. We wanted to show the post order, and be able to link between the parts, both holistically, and to the previous and next posts.

Lazy loading the images of the blog and improving your page speed giving better user experience. Defer Offscreen Images in a Jekyll blog.

Why Jekyll Categories or Tags? Imagine you have a blog where you discuss very different things all together. Many bloggers post their personal experiences along with some professional posts. Curating information is very important to make users browse through your website with ease. What if New York Times had no categories like Politics, Business, Tech etc..? How hard would it be to track what happened to last night’s football game? There should be a Sports category to make readers’ life easy.

The Forestry.io team is now focused on building TinaCMS. If you wish to migrate your Forestry site to Tina, follow the guide below.
In addition to the built-in variables available from Jekyll, you can specify your own custom data that can be accessed via the Liquid templating system.

Why ‘Jekyll Collections’?
A Jekyll plugin to add metadata tags for search engines and social networks to better index and display your site's content. - jekyll/jekyll-seo-tag
So you have a static site in Jekyll that you want to deploy toHeroku. Lucky for you, this is a relatively easy task and does notrequire anything as complex a...
Transform your plain text into static websites and blogs

Making a static HTML website have dynamic search
A starter kit for jekyll + bootstrap 4.
A beginner's guide to creating a personal website and blog using Jekyll and hosting it for free using GitHub Pages.

A guide for Jekyll freelancers to get the most out of CloudCannon with templates.
Github page does not allow customized plugins, and jekyll-tagging is not one of the supported GEMs of Github pages. It needs some effort to add tag support your Jekyll blog hosted by Github page. This blog shows you how to do this step by step.

Overview of different techniques to implement comments using a static site generator.
You can implement advanced conditional logic that includes if statements, or statements, unless, and more. This conditional logic facilitates single sourcing...

This free online tool lets you convert a HTML file into a YAML file. No need to download or install any software. Click to convert your file now.
My Environment Software Version(s) Operating System Ubuntu 19.10 jekyll Latest github-pages No Current Behavior I was trying to run sudo apt install jekyll jekyll new my-awesome-site cd my-awesome-...
-->
sinatra (ruby)
categories:
tags: ruby sinatra webdev
date: 12 Apr 2025
slug:sinatra
A protip by alfuken about ruby and sinatra.

In this article, we'll introduce Ruby on Rails' lesser-known but powerful cousin Sinatra. We'll use...

Learn how to implement a Sinatra API and protect its endpoints using Auth0
Community contributed recipes and techniques.

Find out how easy it is to build a chatbot for WhatsApp using the Twilio API for WhatsApp and the Ruby web framework Sinatra.

Photo by Morre Christophe on Unsplash My team at Runtime Revolution uses an in-house app for team ma...
-->
airflow (tools)
categories:
tags: airflow
date: 12 Apr 2025
slug:airflow

Lesser known Tips, Tricks, and Best Practises to use Apache Airflow and develop DAGs like a Pro
Lessons learned from successful MLOps implementation

Chapter 5 excerpt of “Data Science in Production”
-->
productivity (behavior)
categories:
tags: behavior productivity
date: 12 Apr 2025
slug:productivity

Yes, just set that deadline.

Onboarding can be a well-documented, up-to-date, repeatable process that helps new hires become productive quickly without having to ask so many questions.

Do "outline speedrunning": Recursively outline an MVP, speedrun filling it in, and only then go back and perfect. This is a ~10x speed up over the 'loading-bar' style (more on that below) Don't just read this article and move on. Go out and do this for the very next thing you make so y
You’re working on the most complex problem in computer science: fixing permissions on a deployment pipeline. It’s been 4 days you started on that simple task...

In the fast-paced rhythm of today's world, managing time effectively is not just an advantage; it's a...


Thinking about your actions as vectors instead of scalars is a helpful mental model to manage your goals. Considering your vectors of action can help you objectively assess your progress, your impact, and your well-being.


Perfectionism is on the rise, and its consequences for mental health can be devastating. The Japanese philosophy of "wabi sabi" can help.

Henry Rollins talks about not labelling what you do, why he’s not interested in advice, the need to make things constantly, and why he’s never had a creative block.

Productivity inspiration and tactical advice that’s actually useful.

Note Scott Hanselman (me): I had been meaning to write up my productivity tips ...

These achievements aren’t about productive self-improvement. They’re designed to make the pursuit of joy a deliberate practice.
The best productivity methods keep your to-dos in front of you and prioritized so you never wonder what to work on next. Some are complicated, but oth

The most surprising thing is that you wouldn’t let anyone steal your property, but you consistently let people steal your time, which is infinitely more valuable.
Life-Hacking. Climbing. Striving for awesome. Coffee.
An introduction to kanban methodology for agile software development and its benefits for your agile team.

A few months ago, I wrote about things that look like work, but aren't. As I paid more attention to founders doing these things, I started thinking about why they were happening. I realized that...

If you're having trouble with your productivity, consider finding the root using the 5 Whys technique.

Timeboxing is the nearest thing we have to productivity magic, yet most people don’t utilize it. It amounts to boxing out periods of time to work on distinct tasks each day. But when I recommend perhaps the most effective technique ever devised to help people stay on track, most of them balk.
Bring all your engineering data in one place and build dashboards in minutes

This is the midweek edition of Culture Study — the newsletter from Anne Helen Petersen, which you can read about here. If you like it and want more like it in your inbox, consider subscribing.

I've worked at various tech companies: from "traditional" shops and consultancies, through an investment bank, to high-growth tech firms. I've also talked with software engineers working at startups, banking, automotive, big tech, and more "traditional" companies. This mix had a healthy sample of Silicon-Valley companies and ones headquartered outside this
:extract_focal()/https%3A%2F%2Fpocket-syndicated-images.s3.amazonaws.com%2Farticles%2F561%2F1633133127_dir1241241311ect.jpg)
A few timeless productivity lessons that apply no matter what you’re doing.

Stephen Wolfram, creator of Mathematica and WolframAlpha, on his carefully-crafted techniques for being effective at work.
Do you ever get that feeling like no matter how hard you work, you just can't keep up? This isn't a problem uniquely faced by modern knowledge workers. It's also a characteristic of certain software systems. This state — of being perpetually behind on intended work-in-progress — can fall naturally…
Productivity inspiration and tactical advice that’s actually useful.

The author wasn’t all about literary masterpieces, dry martinis and rakish charm – he also invented a technique that can beat procrastination and boost productivity.
:extract_focal()/https%3A%2F%2Fhbr.org%2Fresources%2Fimages%2Farticle_assets%2F2015%2F11%2Fnov15-26-2696244.jpg)
To make sure productivity doesn’t slow after you walk out of the room, do two things after and in between meetings.
Dev diaries is a development community providing daily tips and tricks about web development. Learn about how to become a better dev, and get a refreshed perspective on what it means to be a web developer. We share daily web development tips on Instagram, Twitter, Facebook, & Pinterest. Being a good web developer comes down to a lot of things, but one of the major skills is being able to Google and find the right answer on Stackoverflow...
In a world where there are no secrets, where innovations are quickly imitated or become obsolete, the theory of competitive advantage may have had its day. Realistically, ask yourself, If all your competitors gave their strategic plans to each other, would it really make a difference? In 1986, Amar Bhide wrote “Hustle as Strategy” for the Harvard Business Review. At the time, he was an assistant professor at HBS. He examined the dynamics within the financial services market.

Inefficient does not mean ineffective, and it is certainly not the same as lazy. You get things done – just not in the most effective way possible. You’re a bit sloppy, and use more energy. But don’t feel bad about it. There is real value in not being the best.
“Anyone who lives within their means suffers from a lack of imagination.” — Oscar Wilde

In a recent survey of 100 productivity hacks, timeboxing — migrating to-do lists into calendars — was ranked the most useful. Timeboxing can give you a much greater sense of control over your workday. You decide what to do and when to do it, block out all distractions for that timeboxed period, and get it done. The benefits of calendarized timeboxing are many, varied, and highly impactful. The practice improves how we feel (control), how much we achieve as individuals (personal productivity), and how much we achieve in the teams we work in (enhanced collaboration). This may be the single most important skill or practice you can possibly develop as a modern professional, as it buys you so much time to accomplish anything else. It’s also straightforwardly applied and at no cost. Box some time to implement a version of this that works for you.

The first few times it happens, it feels like a positive signal. Somebody wants your advice and perspective. You must be good at what you do. And th

This is Part 2 of a three part series on high performing teams. Part one is of Design the Team You Need to Succeed Now you’ve decided you want more than a workgroup, what should you do? What does i…

I remember the first time I had to write one of these puppies. I had just been promoted to manager at Yahoo back in 2000, and was running a small team. I was told to “write a status email covering …

South Island, New Zealand, a.k.a. Middle-Earth If you were to make a list of what you want to get done this week, it would mostly consist of things you have to do. Get groceries. Book a hair appointment. Get back to so-and-so. Read that health and safety thing for work. If you were to make a list of things you
-->
acting (behavior)
categories:
tags: acting behavior
date: 12 Apr 2025
slug:acting

In describing how they remember their lines, actors are telling us an important truth about memory.

The actor plays dual roles in 'Fallout'—a monster and the man he used to be—prompting a look back at his own unlikely past.

From 2008: What was real about the realest actor of them all? Claudia Roth Pierpont on Brando’s dilemmas and his depths.

Paul Giamatti’s performance in "The Holdovers" is just another high point in a long, memorable career.

A star since childhood, she spent decades guarding her privacy. On-screen, she’s always played the solitary woman under pressure. But in a pair of new roles, she’s revealed a different side of herself.

The world is finally singing her long-overdue praise.

We asked critics and Hollywood creators: Which supporting players make everything better?

After leaving L.A. and making only one public appearance since — on a widely condemned mental illness episode of 'Dr. Phil' — the complicated star of 'The Shining' discusses her legacy and the trauma of the Stanley Kubrick film.

From ‘Urban Cowboy’ to ‘Northern Exposure’ to ‘No Country for Old Men,’ Texas’s finest character actor isn’t hanging up his spurs just yet.

Although ‘Cheers’ made the actor a star, he always swore he had a tough time getting comfortable playing the womanizing character. But the humanity he brought to Sam has informed his career and his life ever since.
-->
visualizations
categories:
tags: visualization
date: 19 Apr 2025
slug:raindrop-visualization

This Sprint focuses on Yellowbrick, a Python visualization library that extends the scikit-learn API to incorporate visual diagnostics in your machine learning workflow.
A 2D cloth Verlet simulation made in Rust
Apache ECharts, a powerful, interactive charting and visualization library for browser
Create diagrams and visualizations using text and code.

Motivation • Dimensionality reduction is vital to the analysis of high dimensional data, i.e. data with many features. It allows for better understa…
Generation of diagrams like flowcharts or sequence diagrams from text in a similar manner as markdown - mermaid-js/mermaid

To show a catalog of almost 100 million books in one view, phiresky mapped them based on International Standard Book Numbers, or ISBNs, with an interactive visualization.


A list of the most powerful R packages to create stunning graphs.

Ever wished to design those beautiful Tableau based packed bubble charts? Follow along for a tutorial on the Matplotlib solution

Create your first run chart and start interpreting your data using just four rules. Your go-to QI resource.

So, you’ve mastered the basics of ggplot2 animation and are now looking for a real-world challenge? You’re in the right place. After reading this one, you’ll know how to download and visualize stock data change through something known as race charts. You can think of race charts as dynamic visualizations (typically bar charts) that display […] The post appeared first on appsilon.com/blog/.

Something a llttle different: Hexbin maps by Jerry Tuttle I recently became acquainted with hexbin maps, so I thought I would experiment with one. In a hexbin map, each geographical region is represented by an equall...

Decent Patterns is a collective effort to further the adoption of decentralized technologies by providing open tooling and resources for the community.

Can designers defend pursuing beauty when communicating science or innovation?
Decent Patterns is a collective effort to further the adoption of decentralized technologies by providing open tooling and resources for the community.
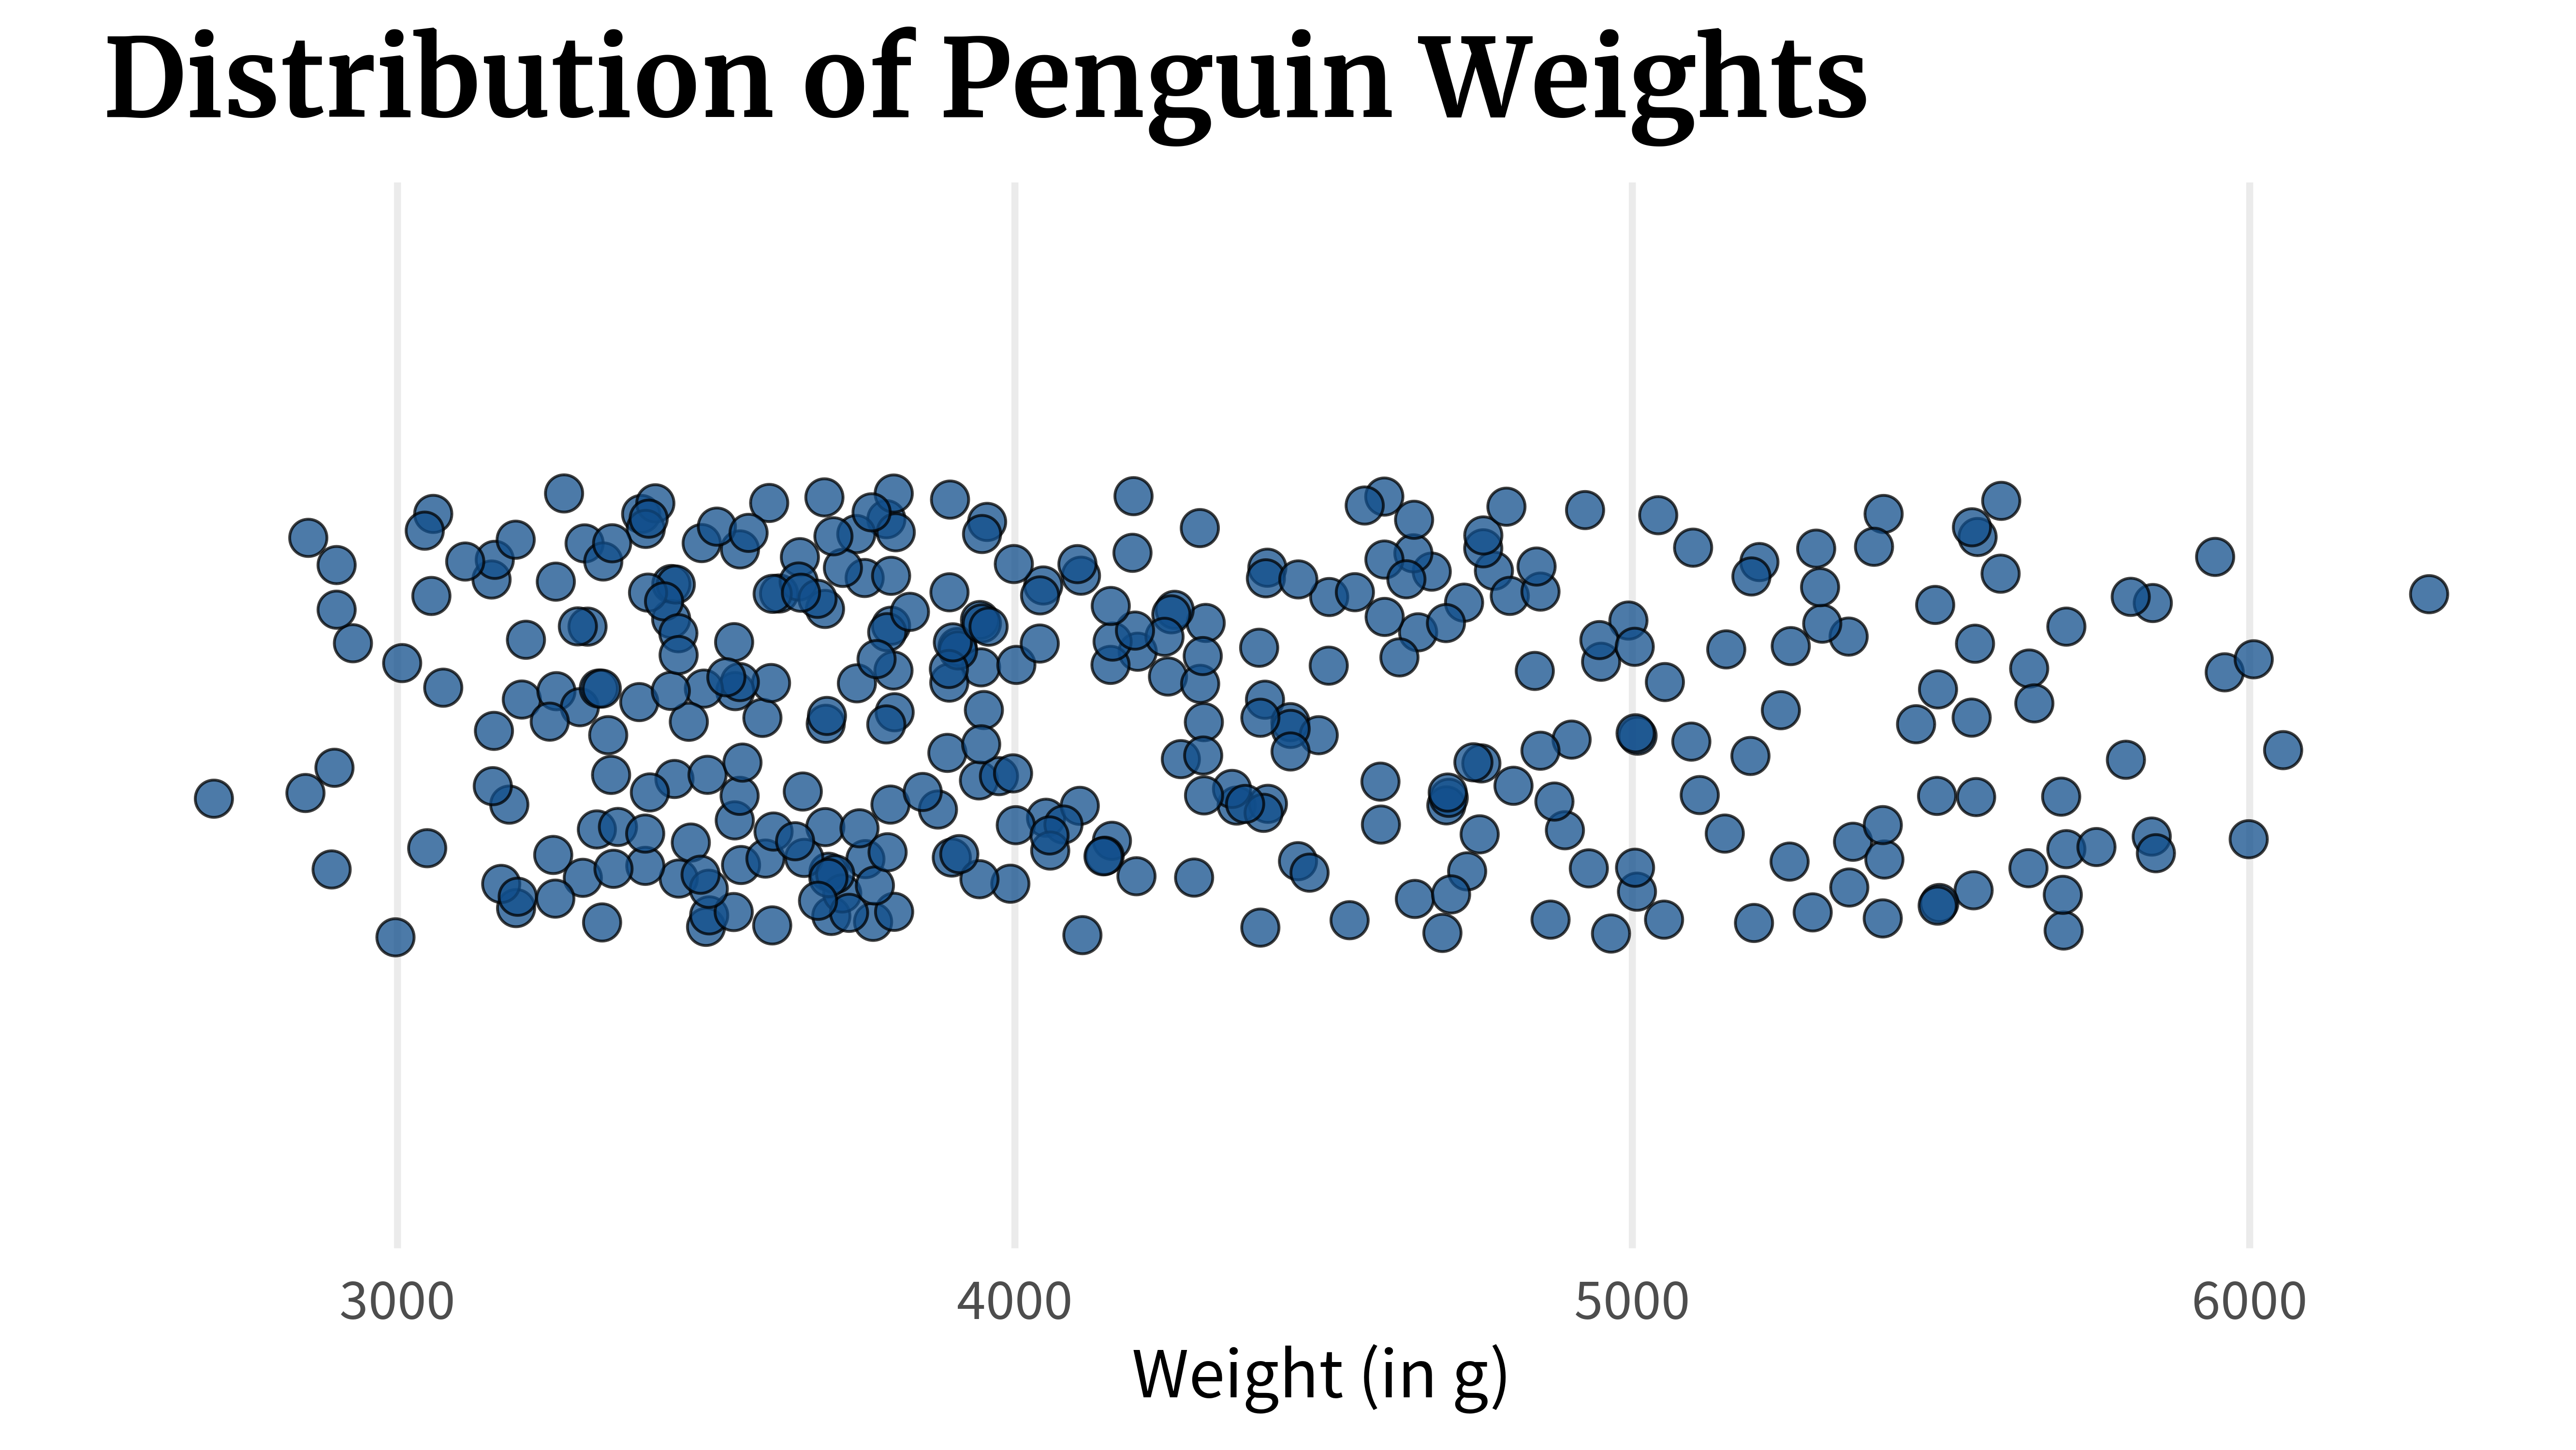
Box plots are a very common tool in data visualization to show how your data is distributed. But they have a crucial flaw. Let’s find out what that flaw is. And if you’re interested in the video version of this blog post, you can find it here: ...

In this article, I'll take you through some advanced data visualization concepts you should know to enhance your graphs.

Bubble charts are an engaging way to visualize groups of people or events. Flourish allows you to create interactive bubble charts with multiple image and label options.
Easily document cables and wiring harnesses.

Diagrams are the cornerstone of software development, illuminating complex systems and fostering...

Bloom effects are typically used to enhance the brightness and lighting effects of images or scenes,...

Use Python’s statistical visualization library Seaborn to level up your analysis.

Learn graphical text analysis with NLTK

Interactive article explaining the physics of an airfoil and what makes airplanes fly
Community website for Apache Superset™, a data visualization and data exploration platform
Matrix Product Interpretations and Visualizations: Learn Linear Algebra from scratch. Build a foundation for Machine Learning and other key technologies.
For me, mathematics cultivates a perpetual state of wonder about the nature of mind, the limits of thoughts, and our place in this vast cosmos (Clifford A. Pickover - The Math Book: From Pythagoras to the 57th Dimension, 250 Milestones in the History of Mathematics) I am a big fan of Clifford Pickover and I
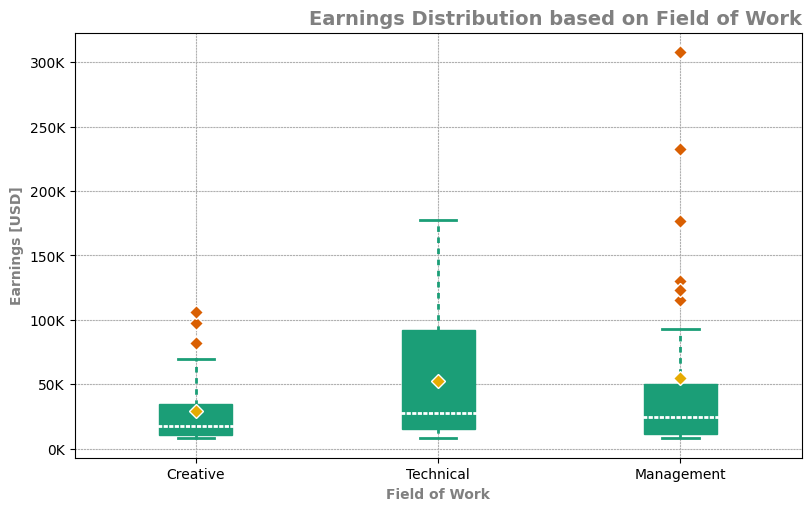
Consistently beautiful plots with less code and minimal effort

Turn a government PDF into a financial planning tool
Use 3D to visualize matrix multiplication expressions, attention heads with real weights, and more.
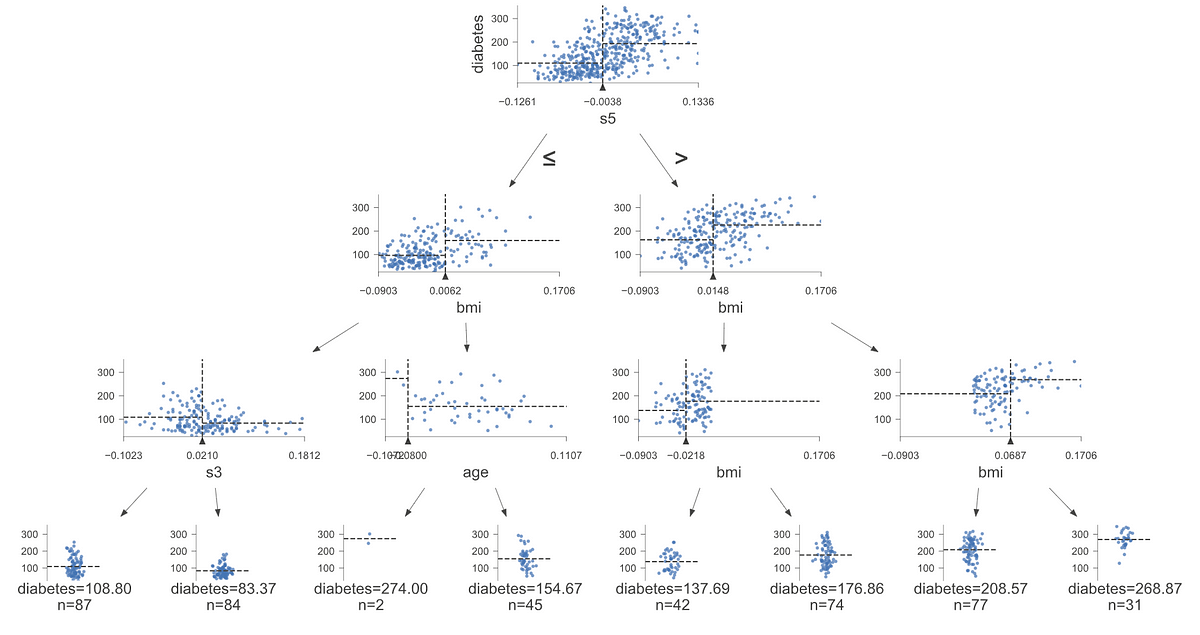
How to visualize decision tree models with this useful library

This is the good stuff for March.

Learn how to design beautiful tables in R! Join our workshop on Designing Beautiful Tables in R which is a part of our workshops for Ukraine series. Here’s some more info: Title: Designing Beautiful Tables in R Date: Thursday, April 27th, 18:00 – 20:00 CEST (Rome, Berlin, Paris timezone) Speaker: Tanya Shapiro is a freelance … Continue reading Designing Beautiful Tables in RDesigning Beautiful Tables in R was first posted on March 25, 2023 at 3:28 pm.
DISCLAIMER: This blog post was written by a human with the help of AI Hypotrochoids and epitrochoids...
Utilising Python’s Matplotlib to Create Advanced Data Visualisations

Charts are a powerful tool for data visualization, but with so many chart types available, it can be...
A quick guide on how to make clean-looking, interactive Python plots to validate your data and model
An Introduction to the PyGWalker Library for Easy Data Visualisation
A React+D3 animated bubble chart.

Written by Mads Stoumann✏️ Not so long ago, these beautiful posters showed up in an advertisement on...
Learn how to quickly create a presentation-ready plot to aid your data storytelling
A Great Alternative to Pie Charts for Data Visualisation

Better alternatives to scatter, bar, and line plots.
A command line tool that draw plots on the terminal. - red-data-tools/YouPlot

Four ways how to use drawing to get more ideas: Study, Explore, Develop, and Show. They will boost your creativity.

Step 1. Create a grid Use d3.geoGraticule10 to create lines of constant longitude and latitude. Step 2. Apply clipping Set projection.clipAngle to 90° to show only the front hemisphere. Stroke the outline of the sphere to better separate the globe from the background. Step 3. Apply a radial gradient Apply a radial gradient to simulate lighting on a diffuse surface. Appendix

D3’s projections use adaptive sampling to increase the accuracy of projected lines and polygons while still performing efficiently. Without sampling, only the input vertices of polygons are projected. This results in the artifacts (visible above) due to projected lines becoming curves. Uniform sampling improves the appearance by adding interstitial samples between input vertices. It is inefficient because most samples are not needed, and even areas of extreme distortion still exhibit artifacts! Adaptive sam
The JavaScript library for bespoke data visualization
Some Unique Data Visualization Techniques for Getting High-Level Insight into the Data

Posted by Mahima Pushkarna, Senior Interaction Designer, and Andrew Zaldivar, Senior Developer Relations Engineer, Google Research As machine learn...
Using a heatmap to visualise a confusion matrix, time-series movements, temperature changes, correlation matrix and SHAP interaction values
Simple and easy pieces of code to enhance your seaborn scatter plots
A guide on how to make different types of maps using Python

Interactive article explaining how sound works.
The Sankey chart is a great way to discover the most prominent contributions just by looking at how individual items flow across states.
We look at how to create the 12 most useful graphs and charts in Python and Streamlit
The MovingBubble chart is one of those mind-blowing charts to look at. Learn how to create them using your own data set and Python!

Mix and match plots to get more information from a scatter plot
A guide to making visualizations that accurately reflect the data, tell a story, and look professional.
Create interactive, and stand-alone charts that are built on the graphics of d3 javascript (d3js) but configurable with Python.

Let’s catch those high-dimensional outliers

Effective interactive data visualizations in R
Creating eye-catching graphs with Python to use instead of bar charts.

Build the next generation of Location Intelligence applications with the Targomo API

Learn how to create isochrones for different transport modes with our free isochrone map generator, Isochrone API or software plugins.
The good-looking cousin of stacked area charts
Easily adding arrows, multiple axes, gradient fill, and more
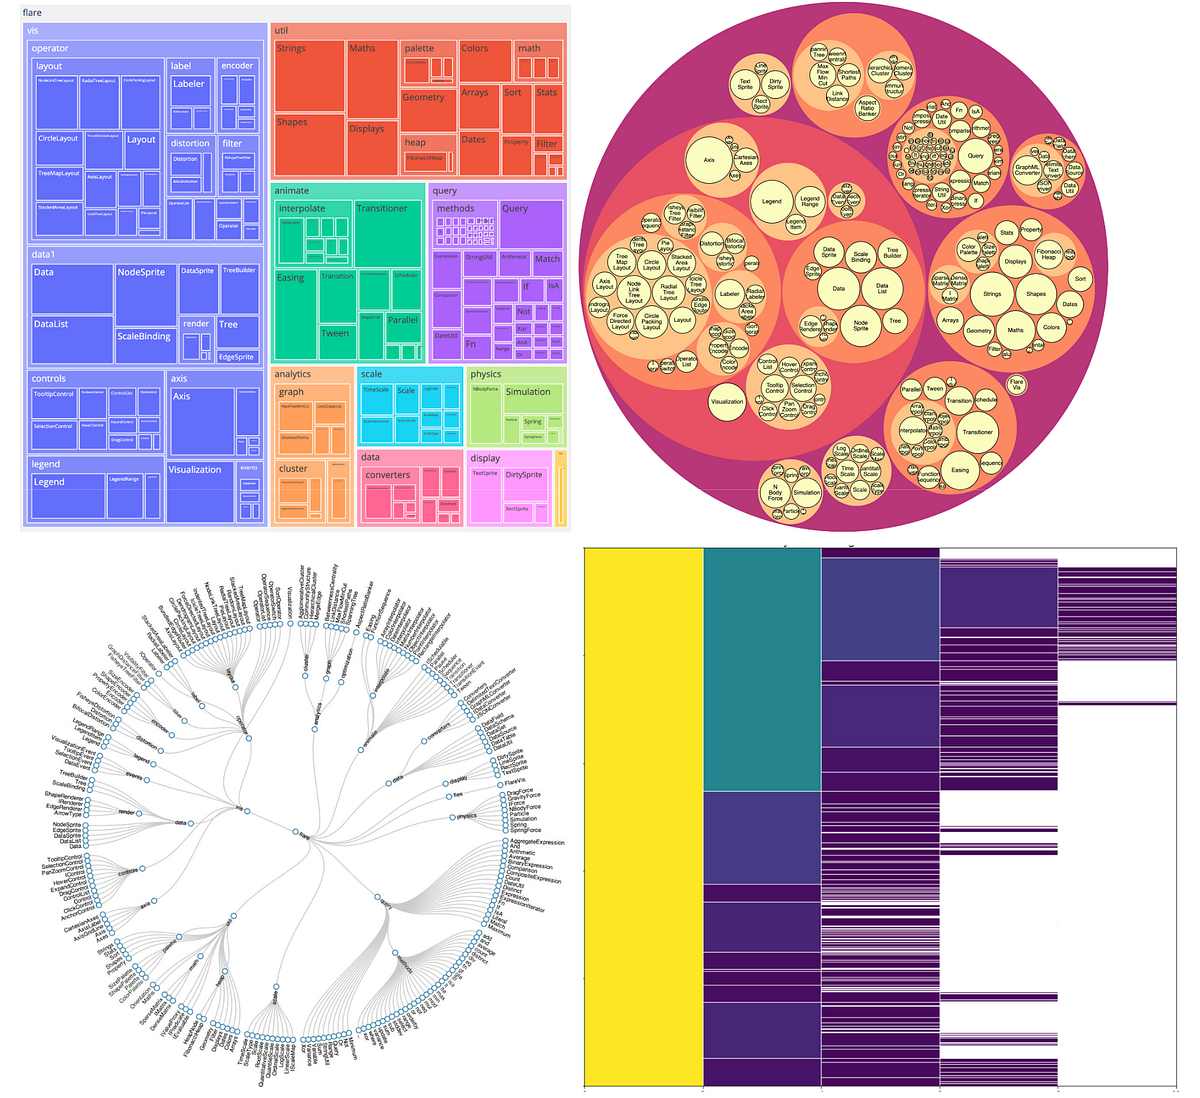
Create a variety of data visualizations with hierarchical data
Animation can help people make sense of all the data at their fingertips.

Here’s the good stuff for June.

This chart shows the relationship between idle and eruption times for Old Faithful. See also the importable chart component version of this example.

All the data in the world won’t do anyone any good if we can’t make sense of it. Or better yet, make it sing. Here are some stunning examples of data visualization in the wild, and some pointers on how to start making your own.

A Sankey diagram is a collection of nodes which are connected with each other to show data flow or hierarchical data connected from one to another.

Data visualization breaks down complex data values into simple and flexible elements that you can easily deal with without being worried.
Using the Folium Package to Create Stunning Choropleths

Adobe Photoshop is still the king of the graphics software industry, by name if not in practice. It is still the bread and butter of artists, designers, illustrators, and creatives, even when there are more focused applications available, like ones for making comics or manga, for example. Despite its popularity, getting legitimate access to Photoshop
How to make choropleths with different data structures in Python

Smart SVG techniques, from generative SVG grids to SVG paths with masks, grainy SVG gradients, cut-out effects and fractional SVG stars. Let’s look at some magical SVG techniques that you can use right away.

SVG is an awesome and incredibly powerful image format. This tutorial gives you an overview of SVG by explaining all you need to know in a simple way
Learn how to visualize data using Seaborn’s axes-level and figure-level plots
Exploring some of the best visualization options for data science projects with the Seaborn library

This cookbook contains more than 150 recipes to help scientists, engineers, programmers, and data analysts generate high-quality graphs quickly—without having to comb through all the details of R’s graphing systems. Each recipe tackles a specific problem with a solution you can apply to your own project and includes a discussion of how and why the recipe works.

If the recent discrimination allegations against Pinterest are leaving you uninspired (if not quesy), here are some great alternatives.
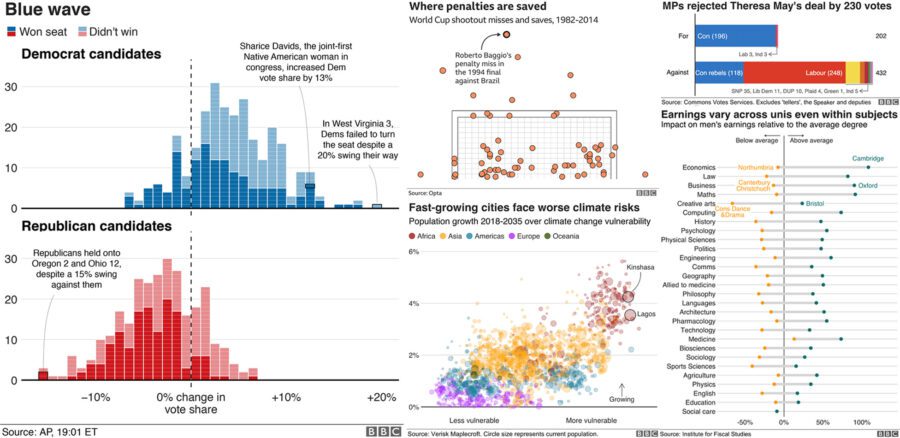
R graphics tutorial: scatterplots with anti-aliasing, using the Cairo library. Two lines of code to make much better visualizations in R.
Based on scatterplot by Myriam Barnes. A simple to viz categories in a scatter plot. - bjpcjp/category-scatterplot
Who needs GIS when you can build eye-catching 3D topography maps with Python?

Also known as ridgelines, use the method to create a compact visualization where you can easily identify major patterns and outliers.
Interactive Tools for Machine Learning, Deep Learning and Math - Machine-Learning-Tokyo/Interactive_Tools

Create breathtaking visuals and “see” your data

Using “Kneedle” algorithmus detecting knees with Python package “kneed”
Visualize flow between nodes in a directed acyclic network. - d3/d3-sankey
Should you bypass Matplotlib?
Scroll down to see how to interpret a plot created by a great tool for comparing two classes and their corpora.

Data analysis and visualization have always been extremely important issues in the professional environment and a fundamental tool for decision-making in companies. In this environment, Microsoft…
Publication-quality data representation library based on Matplotlib. - alopezrivera/mpl_plotter
Sample files to accompany the FT's Chart Doctor column - Financial-Times/chart-doctor

A short excursion into the world of human visual information processing
I recently wrote a post about visualizing weather data from NOAA. We walked through processing the data and making some basic interactive maps with Plotly. In this article I want to use the same data…
A D3 project showing a barchart that allows user interactions
Create PDF reports with beautiful visualizations in 10 minutes or less.
Strip charts are extremely useful to make heads or tails from dozens (and up to several hundred) of time series over very long periods of…
Sample files to accompany the FT's Chart Doctor column - Financial-Times/chart-doctor
A heatmap is a graphical representation of data in which data values are represented as colors. That is, it uses color in order to…

Creating usable, readable treemaps is difficult. They are a complex, area-based data visualization for hierarchical data that can be hard to interpret precisely.

Looking for a good D3 example? Here’s a few (okay, …) to peruse. Animation D3’s data join, interpolators, and easings enable flexible animated transitions between views while preserving object constancy. Interaction D3’s low-level approach allows for performant incremental updates during interaction. And D3 supports popular interaction methods including dragging, brushing, and zooming. Analysis D3 is for more than visualization; it includes tools for quantitative analysis, such as data transformation, rand

How to build a treemap with Javascript and D3.js: from the most basic example to highly customized examples.
Learn to Develop Choropleth Map Easily Using Python’s Folium Library
Library of impossible figures. There's greyscale and wireframe versions of figures.
Create stunning visualizations for Pandas DataFrames

Working notes & digital experiments
If the recent discrimination allegations against Pinterest are leaving you uninspired (if not quesy), here are some great alternatives.
I have been working as a Data Analyst for almost 5 years now but, in this time I have mostly used business intelligence software for all…
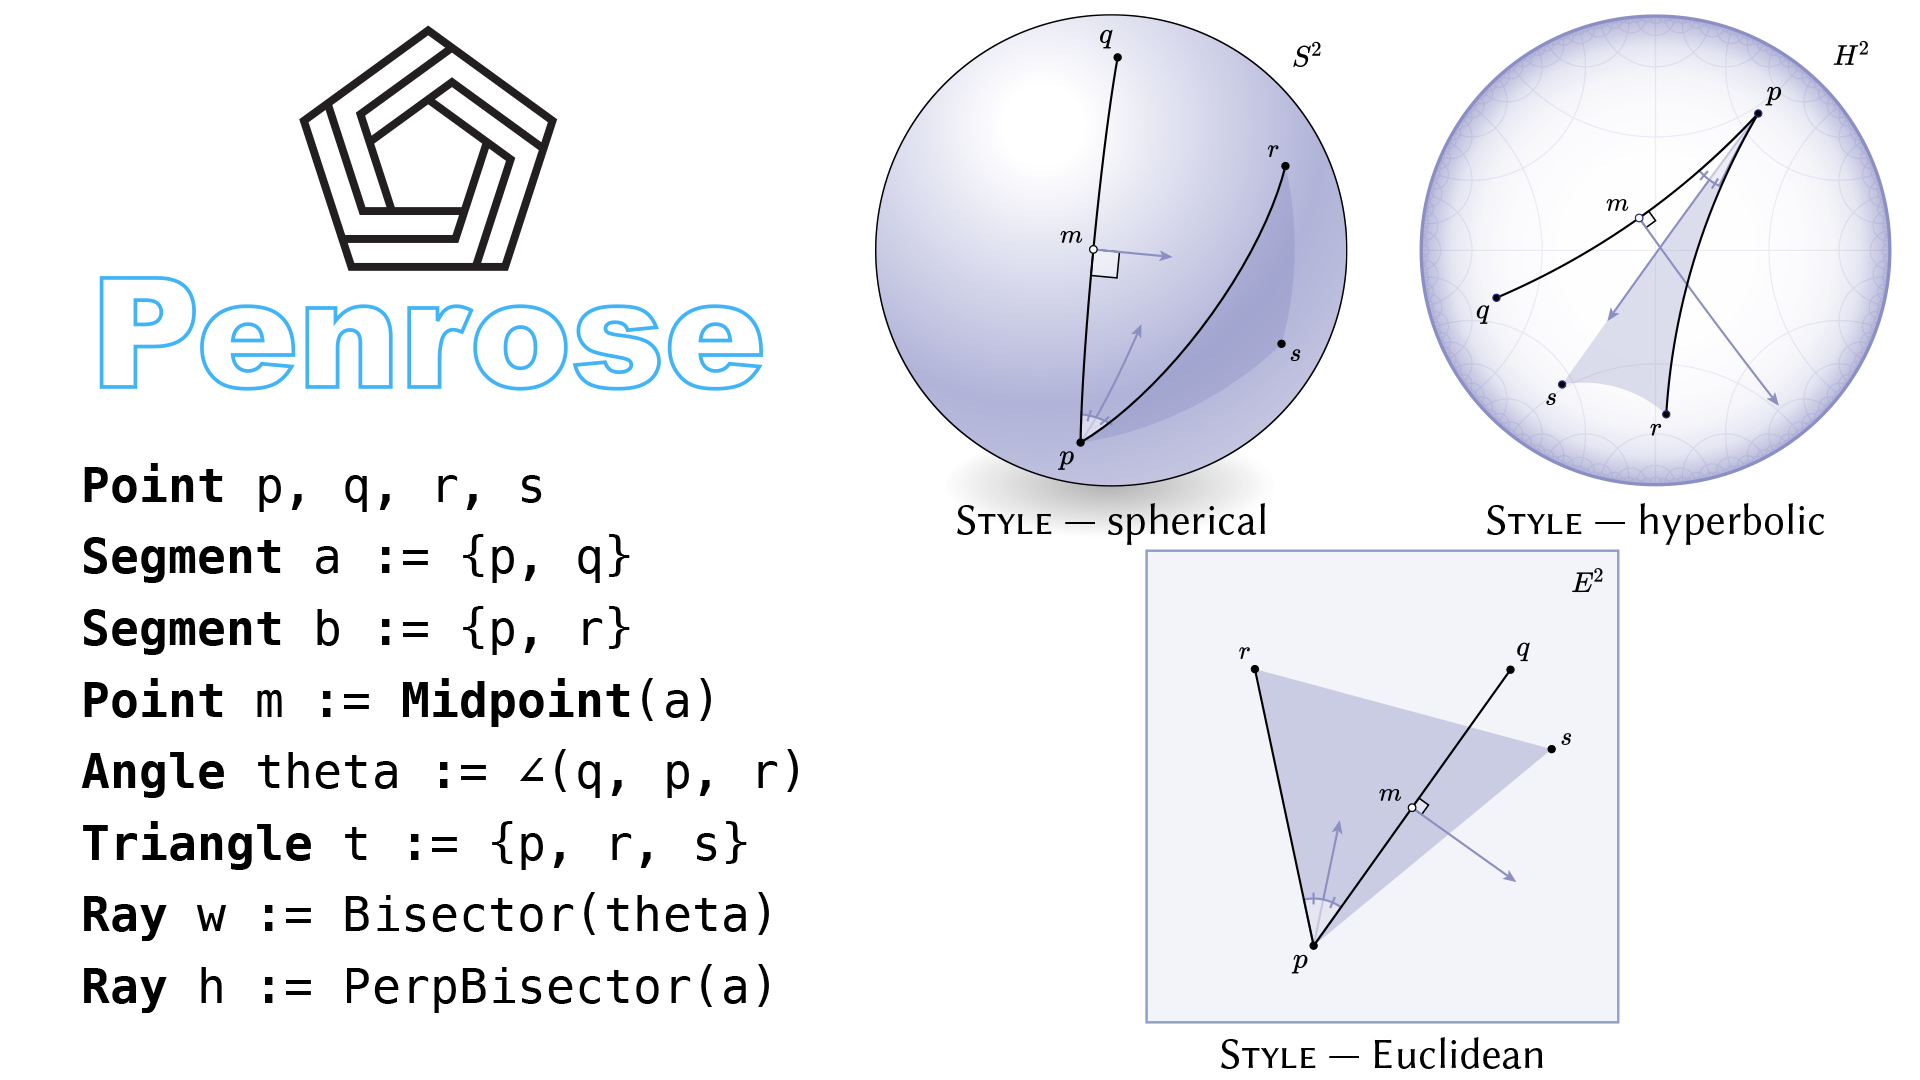
Materials from our SIGGRAPH '20 paper.
Confused about which Visualization Tool to Use? I Broke Down the Pros and Cons of Each Libary for You
But really should know

A circular chart shows proportion and position relationships implemented in Python Plotly

Estimated population by county, 2016. See also the bubble map as an alternative presentation of this data, and an alternative implementation with Observable Plot. Data: American Community Survey This dataset comes from the U.S. Census API and contains three columns: the estimated population (as a string), the two-digit state FIPS code, and the three-digit county FIPS code. Since this dataset doesn’t include the positions of the counties, this centroid helper method is used. It takes a (already projected) Ge
Choropleth Maps using Plotly to track COVID 19 cases.
Ultra high resolution satellite and elevation imagery
A step by step guide on creating and plotting Voronoi diagrams in Python

Traditional sales visualizations miss critical information about what is happening in the sales process.
A Picture is worth a thousand words. Literally! there are 2200+ words in this picture. 😱
A Walkthrough on Hyperspectral Image Analysis Using Python.

Histograms and Kernel Density Estimators explained with bricks and sandpiles
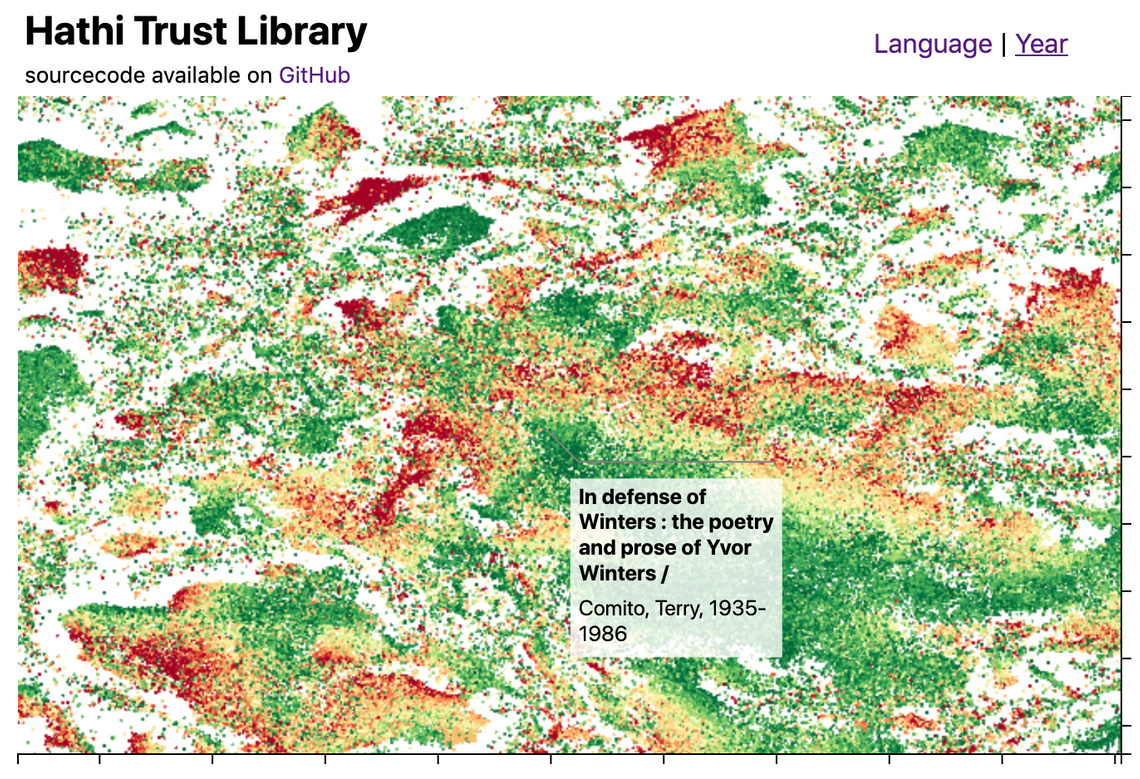
This blog post introduces the WebGL components which we recently added to D3FC, this suite of components make it easy to render charts with very large numbers of datapoints using D3. Throughout this post I'll describe the creation of the following visualisation, which displays 1 million books from the Hathi Trust library
The new tools shows the potential of data visualizations for understanding features in a neural network.
In real life, data preprocessing is really a pain for most data scientists. But with the help of data visualization libraries, it actually…
Seaborn is one of the most used visualization libraries and I enjoy working with it. In my latest projects, I wanted to visualize multiple…

Plotting heatmaps, contour plots, and 3D plots with Python
What if you can create a scatter plot for categorical features?
A walkthrough of many Seaborn tools using NHL Statistics


Create better population pyramids that allow for improved comparisons between sexes and populations.

This treemap supports zooming: click any cell to zoom in, or the top to zoom out.

"Enter into picture Swarmplots, just like their name." https://lttr.ai/MJtZ #datavisualization #awesomevisualization #seaborn #python

This zoomable time series area chart shows the number of flights per day. The effect of the September 11, 2001 attacks on air travel is evident.
Five Hundred and Seven Mechanical Movements, now Animated for the Internet.

Interactive article explaining how mechanical gears work.


This is a pedagogical implementation of an animated bar chart race. Read on to learn how it works, or fork this notebook and drop in your data! The data for the race is a CSV with columns date (in YYYY-MM-DD format), name, value and optionally category (which if present determines color). To replace the data, click the file icon

A map of over 18,000 asteroids in the Solar System.
In my previous blog post, I explained how I take lecture notes using Vim and LaTeX. In this post, I’ll talk about how I draw figures for my notes using Inkscape and about my custom shortcut manager.Some examples First, let me show you some examples of figures…
Bokeh is a Python library for creating interactive visualizations for modern web browsers. It helps you build beautiful graphics, ranging from simple plots to complex dashboards with streaming data...

Emergence is the story of natural laws and processes, their inherent beauty, and their action to yield the universe, us and the world we live in.
Anaconda is the birthplace of Python data science. We are a movement of data scientists, data-driven enterprises, and open source communities.
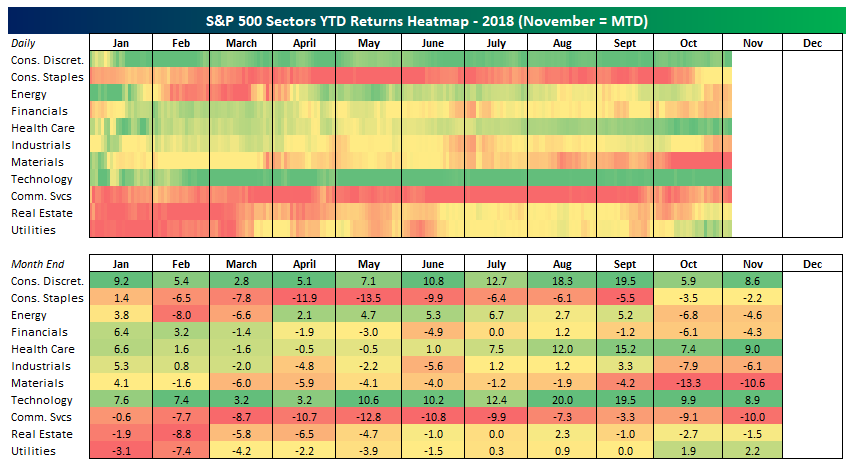
Stock market rotation has been a pretty big theme this year but you wouldn't necessarily know it from our sector performance heatmap.

An intuitive library to add plotting functionality to scikit-learn objects. - reiinakano/scikit-plot

The end-to-end solution for creating expressive data apps, dashboards, and reports. Discover richer insights in your data today.
R Language Tutorials for Advanced Statistics

If you have tried to communicate research results and data visualizations using R, there is a good chance you will have come across one of its great limitations. R is painful when you need to...

Stay up-to-date on the latest data science and AI news in the worlds of artificial intelligence, machine learning, deep learning, implementation, and more.
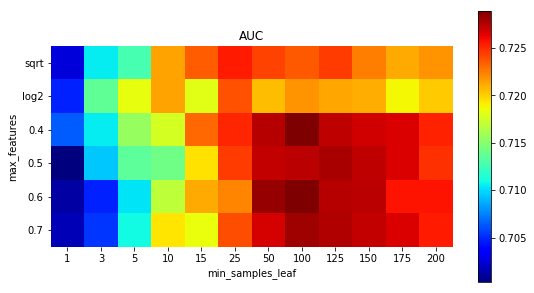
An introduction to parfit
The Python Graph Gallery displays hundreds of charts made with Python, always with explanation and reproduciible code
-->
reactjs (javascript)
categories:
tags: javascript reactjs
date: 19 Apr 2025
slug:raindrop-reactjs
A React+D3 animated bubble chart.

React JS has been an important framework in developers’ toolkits for a decade now. But if you’re just starting your career, you’re probably better off not spending time learning it.

A JavaScript library for building user interfaces. React Enlightenment, the most famous guide to examine and understand the building blocks of React apps.


By Cory House Standardize your React development with these key decisions React was open-sourced in 2013. Since then, it has evolved. As you search the web, you’ll stumble across old posts with dated approaches. So, here are eight key decisions your ...
React Tutorial - This React tutorial is intended to assist you in learning the fundamentals to advance of ReactJS. Learn all about ReactJS from basics to advanced concepts like Component, State, Props, Router, Fragmentation, Redux, etc.

Learn React and build this todos project with this course. Do you want to learn React and build...

If you spend a lot of time on Hacker News, it’s easy to get taken by the allure of building a project without a framework.

The library for web and native user interfaces

"Framework is heart of every technology." Whether you are a beginner, a senior developer, a freela...

See why React is the most popular JavaScript library for building frontends, and use it to build sites and apps.
426K subscribers in the reactjs community. A community for discussing anything related to the React UI framework and its ecosystem. Join the…

Evergreen is a React UI Framework for building ambitious products on the web. Made by Segment in San Francisco, CA.
-->
nextjs (javascript)
categories:
tags: javascript nextjs
date: 19 Apr 2025
slug:raindrop-nextjs
Production grade React applications that scale. The world’s leading companies use Next.js by Vercel to build pre-rendered applications, static websites, and more.

In this guide, Ibrahima Ndaw will be looking at Next.js, a popular React framework that offers a great developer experience and ships with all of the features you need for production. We will also build a blog, step by step, using Next.js and MDX. Finally, we’ll cover why you would opt for Next.js instead of “vanilla” React and alternatives such as Gatsby.

Next.js 8 introduces Serverless Mode, smaller bundles, performance improvements, and more.
-->
meteorjs (javascript)
categories:
tags: javascript meteorjs
date: 19 Apr 2025
slug:raindrop-meteorjs

It has been more than one year since we have introduced Vue Js in our Meteor Production App, and last month we have implemented the…
Production Quality Meteor Deployment to Anywhere.

Let's start with how publications and subscriptions work on Meteor, which are the "under the hood" of Meteor's real-time data model.

Node 14, HMR improvements, removal of deprecated APIs and much more!
-->
javascript
categories:
tags: javascript
date: 19 Apr 2025
slug:raindrop-javascript
Apache ECharts, a powerful, interactive charting and visualization library for browser
🥞Data Structures and Algorithms explained and implemented in JavaScript + eBook - amejiarosario/dsa.js-data-structures-algorithms-javascript

We highlight five JavaScript libraries that are likely to become obsolete in 2025 and why it's time to move on. Also: we list alternatives!

Many website admins, it seems, have yet to get memo to remove Polyfill[.]io links.
Hotwire is an alternative approach to building modern web applications without using much JavaScript by sending HTML instead of JSON over the wire.
Diagrams are the cornerstone of software development, illuminating complex systems and fostering...

In the first part of our series, we'll explore two Hotwire methods to make modals accessible in your Rails application.

There are many ways to code graphics for the web. You can create art with CSS. You can code an SVG image as part of an HTML file. Or you can generate graphics from JavaScript using the Canvas API. In this article, we'll explore how to use JavaScript ...

JavaScript keeps growing and growing, opening doors for new “to be tech geeks” in the market as it’s...

Check this post on my web notes. In almost every project we work on, we use extra tools to make...

This version of Rails has been years in the conceptual making. It’s the fulfillment of a vision to present a truly full-stack approach to web development that tackles both the front- and back-end challenges with equal vigor. An omakase menu that includes everything from the aperitif to the dessert.
Learn how to use JavaScript to draw any regular shape to a HTML canvas with a single function, and how to modify it to draw multiple shapes.

In the development scenario using JavaScript/TypeScript, it is unthinkable to build professional...


Discover how to put an error handling layer in place for your Node.js application using Express.

In this tutorial we’ll be using the HTML Geolocation API to display the current location of a user on...

With the rapidly changing technologies, developers are being provided with incredible new tools and...
Nginx is a popular web server that is widely used to serve static content, reverse proxy, and load...
A React+D3 animated bubble chart.

Both npm (Node Package Manager) and Yarn are popular package managers for JavaScript projects,...
Babylon.js playground is a live editor for Babylon.js WebGL and WebGPU 3D scenes

SvelteKit is the latest of what I'd call next-gen application frameworks. It, of course, scaffolds an application for you, with the file-based routing,

John Mueller from Google advises placing JavaScript code underneath the HTML element to ensure that search engines can clearly understand your website.

A rugged, minimal framework for composing behavior directly in your markup.
Welcome to the second tutorial in this series on animating with anime.js! In the previous post,...

InnerHTML, innerText and textContent can each help to manipulate JavaScript code, but they contain subtle differences. Here’s what to know

Make sense of the proliferation of new Javascript web frameworks. A deep dive into the problems at scale and the recent evolution of innovation.

Introduction Being a multi-paradigm language, JavaScript maintains programming styles...

In many modern websites, there is a lot of JavaScript. In fact, according to the HTTP Archive, the...

Build your own web framework that deploys to edge and serverless infrastructure.
Master programming by recreating your favorite technologies from scratch. - codecrafters-io/build-your-own-x

Let's dive into multithreading and how to use worker threads in Node.
React JS has been an important framework in developers’ toolkits for a decade now. But if you’re just starting your career, you’re probably better off not spending time learning it.

A common reason why an Angular bundle is bloated is that it uses a library like MomentJS that isn't...

This tutorial will show you three different techniques of creating and saving files with JavaScript.

I have been working with typescript for almost a year now, and I have learned and implemented a lot...
TypeScript Fundamentals in One Place 1. Introduction Programming...

Realtime and offline SKU detection in the browser using Tensorflow.js

NodeJS is growing in popularity since its inception. 30 million websites use NodeJS Back in 2018,...

This is a comprehensive overview for the most popular Node.js frameworks in the current year. Also covers up and rising stars to keep an eye out for.
It has been more than one year since we have introduced Vue Js in our Meteor Production App, and last month we have implemented the…

Yarn and NPM are two of the most popular Node.js package managers. They allow downloading,...

One of the main benefits of JavaScript is that it runs both in the browser and the server. As an engineer you need to master a single language and your skills…

From bold transformations to simple highlights, we share some fantastic CSS & JavaScript card UI hover effect snippets.

Let’s make 2021... fast! An annual front-end performance checklist, with everything you need to know to create fast experiences on the web today, from metrics to tooling and CSS/JavaScript techniques.
Starting with Rails 6, Webpacker is the default JavaScript compiler. It means that all the JavaScript code will be handled by Webpacker instead of the old assets pipeline aka Sprockets. Webpacker is different from asset pipeline in terms of philosophy as well as implementation. In this blog post, we will

Why do we need to talk about robust JavaScript and how do we achieve it?
Cheatsheet for the JavaScript knowledge you will frequently encounter in modern projects. - mbeaudru/modern-js-cheatsheet

A guide for front-end developers to equip themselves with latest learning resources and development tools in front-end engineering.

A guide for front-end developers to equip themselves with latest learning resources and development tools in front-end engineering.

With ES8 we got another way to write code that is async in a more readable way then callback's its called Async / Await. With ES6 we already got Promises.
webpack is a module bundler. Its main purpose is to bundle JavaScript files for usage in a browser, yet it is also capable of transforming, bundling, or packaging just about any resource or asset.

Documentation for the npm registry, website, and command-line interface

Couple of weeks ago we started a series aimed at digging deeper into JavaScript and how it actually works: we thought that by knowing the…
A set of best practices for JavaScript projects.
📝 Algorithms and data structures implemented in JavaScript with explanations and links to further readings - trekhleb/javascript-algorithms

A JavaScript Handbook exploring perfomance & readibility.
This collection of the best JavaScript animation libraries will help you get a headstart in animating any element on your website.
A JS library for predictable and maintainable global state management
Peter Dierx demonstrates how flexible and powerful npm can be when used as a build tool and suggests that you might not actually need Grunt, Gulp and co.
A JavaScript library for building user interfaces. React Enlightenment, the most famous guide to examine and understand the building blocks of React apps.
Express is a minimal web server built on Node.js that provides essential functionality for delivering web applications to the browser and mobile devices...

A quick to tutorial that will get you started with Bower, an excellent front-end development package manager.

AngularJS is a magic framework. Using it well will drastically improve your productivity, code modularity and reusability. Using it badly…

This tutorial will show you how to get started with TypeScript, including the installation process, writing some code, and compiling it to JavaScript.
:zap: Delightful Node.js packages and resources.
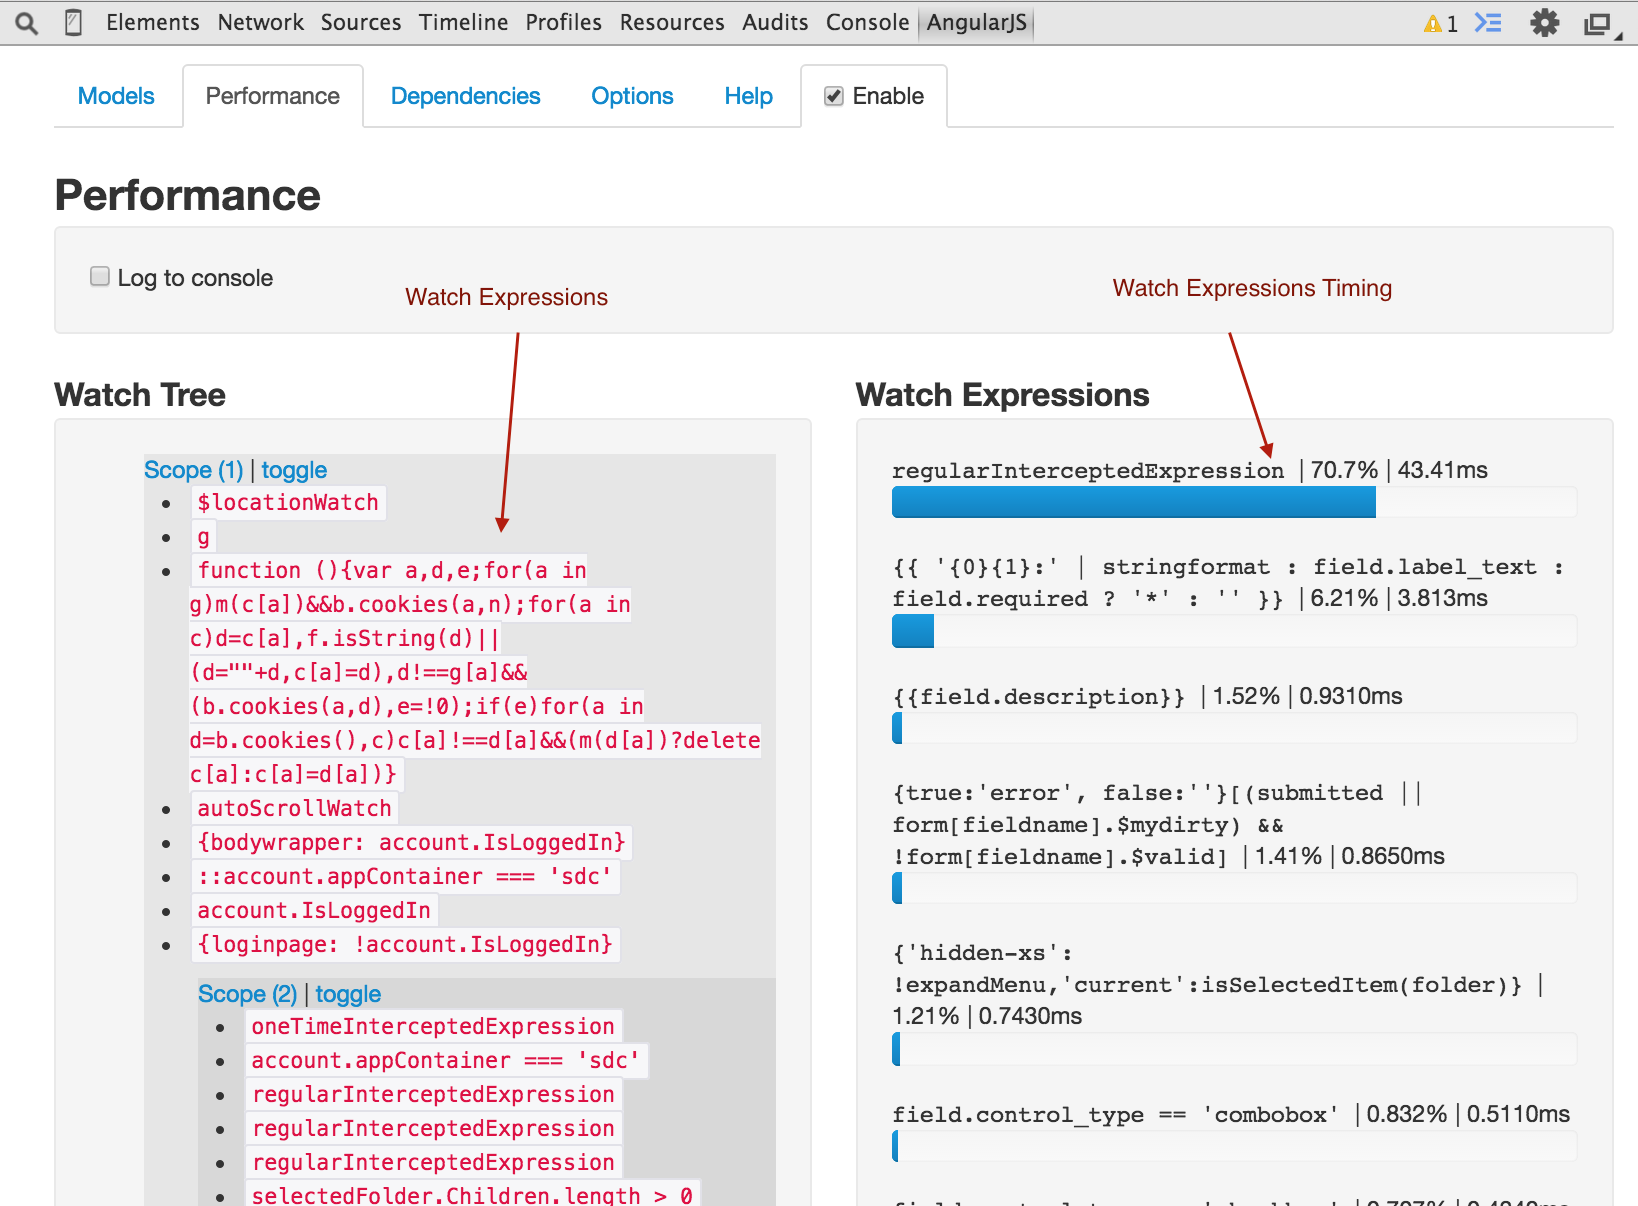
I am new to Angular (even though I am not new to the web development), so please take everything that I am about to say with a grain of salt. That being said, I watched a lot of talks and read a lot of articles relevant to Angular performance, and this post is the summary […]

The landscape for learning d3 is rich, vast and sometimes perilous. You may be intimidated by the long list of functions in d3’s API…
Empower JavaScript with native APIs. Liberate your development by using Android, iOS, visionOS... APIs directly without leaving your love of JavaScript.
Angular is a platform for building mobile and desktop web applications. Join the community of millions of developers who build compelling user interfaces with Angular.

By Shubheksha Jalan Ashley Williams is one of the leaders of the Node.js community. She tweeted about a new package managers. I didn’t really understand what she meant, so I decided to dig in deeper and read about how package managers work. This was ...
Production Quality Meteor Deployment to Anywhere.
Programming reference for JavaScript.

🕑 The Wait Is Over ❕
A quick reference to best practices for writing JavaScript -- links to code patterns and tutorials from around the web

When dealing with web-based projects that run in the production environment, being able to build and deploy changes quickly is a top priority. However, repetitive processes such as building front-end assets, when not automated, can be prone to critical errors. In this article, Toptal Freelance Software Engineer A...
Ember.js helps developers be more productive out of the box. Designed with developer ergonomics in mind, its friendly APIs help you get your job done—fast.
Exploring the relationship between JavaScript and the modern HTML DOM

Modern JavaScript Tutorial: simple, but detailed explanations with examples and tasks, including: closures, document and events, object oriented programming and more.
An open-source book on JavaScript Design Patterns


A tool for visualizing Execution Context, Hoisting, Closures, and Scopes in JavaScript.
Angular Style Guide: A starting point for Angular development teams to provide consistency through good practices. - johnpapa/angular-styleguide

(A Comprehensive Handlebars.js Tutorial) This is a complete tutorial, and indeed a reference, on Handlebars.js templating and, principally, JavaScript templating. Handlebars.js is a client-side (though it can be used...

By Cory House Standardize your React development with these key decisions React was open-sourced in 2013. Since then, it has evolved. As you search the web, you’ll stumble across old posts with dated approaches. So, here are eight key decisions your ...

Do websites created with reactive frameworks get indexed by Google and other search engines? Is it compulsory to set up pre-rendering, as your SEO consultants suggest? Or are they wrong? In this article, Paolo Mioni will talk mostly about Vue.js, since it is the framework he’s used most, and with which he has direct experiences in terms of indexing by the search engines on major projects, but most of what will be covered is valid for other frameworks, too.
:snowflake: a short introduction to node.js.
🎉 A curated list of awesome things related to Vue.js - vuejs/awesome-vue
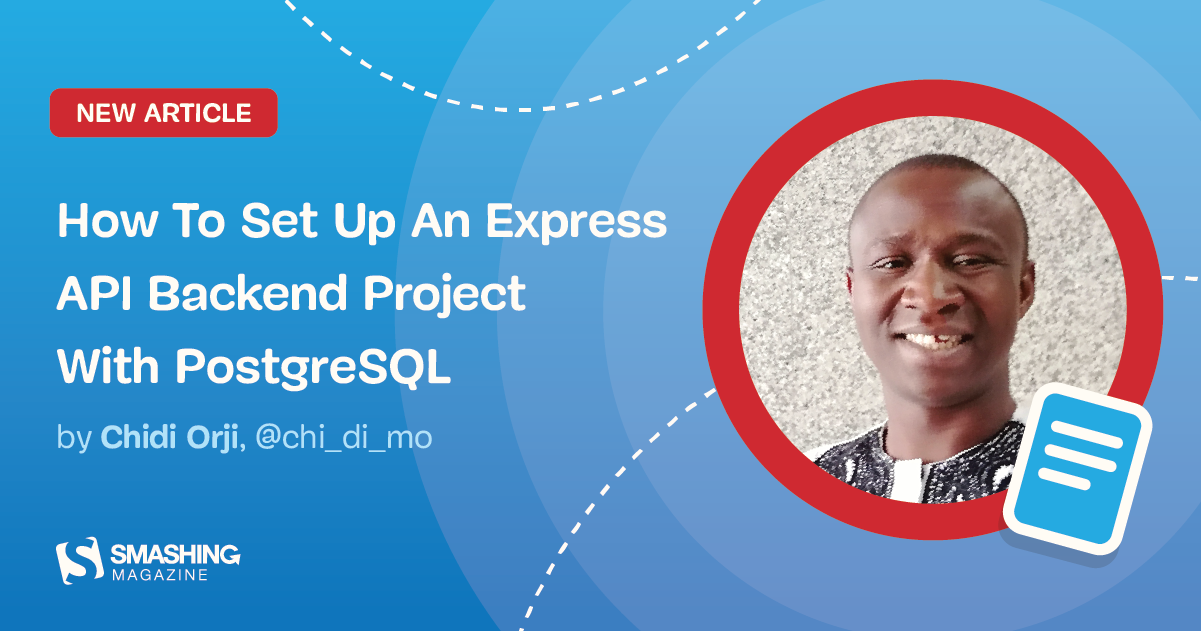
In this article, Chidi Orji will create a set of API endpoints using [Express](https://expressjs.com/) from scratch in ES6 syntax, and cover some development best practices. Find out how all the pieces work together as you create a small project using Continuous Integration and Test-Driven Development before deploying to Heroku.

For the last six years, Vue, Angular, and React have run the world of front-end component frameworks. Google and Facebook have their own sponsored frameworks,
📜 33 JavaScript concepts every developer should know. - leonardomso/33-js-concepts
A few weeks ago we started a series aimed at digging deeper into JavaScript and how it actually works: we thought that by knowing the…
Learn to create interesting biological models and graphics using SVG and AngularJS
Installing Ember is easy! And our new install process includes Ember CLI, Ember's build tool - State of the art asset management (including combining, minifying, and versioning) - Built-in generators can help you create components, routes, and more (and...

The ultimate performance battle between JavaScript frameworks

Welcome back to ES6 – “Oh, good. It’s not another article about Unicode” – in Depth series. If you’ve never been around here …
🛠️⚡ Step-by-step tutorial to build a modern JavaScript stack. - verekia/js-stack-from-scratch
A toolkit to automate & enhance your workflow.

In this post, Rodney Rehm focuses on how to make your code accessible to other developers. Discover the most important things that you will need to consider before and while writing your own utilities and libraries.

Most modern Unix-like operating system, rely on a centralized package management system for finding and installing software. This guide serves as a quick ref…

Have you ever had a requirement in which you had to design and build an interactive web experience but the grid system fell short? Furthermore, the design elements turned into unusual shapes that just wouldn’t fit into the regular web layouts? In this article, Krutie Patel is going to build an interactive infographic using Vue.js, SVG and GreenSock by using dynamic data and unusual layout.

As JavaScript is slowly moving out of the browser, several tools have emerged that significantly improve JavaScript's robustness. One such tool is called Underscore.js and that's what we're going...


Solid is a purely reactive library. It was designed from the ground up with a reactive core. It's influenced by reactive principles developed by previous libraries.

Here is a quick reference guide for basic commands that we can use when dealing with Node and...
Introduction Libraries help us to code faster through their predefined classes for...

Minification is the process of deleting unneeded or redundant data from a resource without altering...
I didn't much care for vanilla JavaScript prior to ES6. Through all of the 2000s, I chased different approaches to avoid writing too much of it. First there was RJS (Ruby-to-JavaScript). Then there was CoffeeScript. Both transpiling approaches that turned more enjoyable-to-write source code into the kind of JavaScript that browsers wou...
Let's start with how publications and subscriptions work on Meteor, which are the "under the hood" of Meteor's real-time data model.
Node 14, HMR improvements, removal of deprecated APIs and much more!

Getting started with SvelteKit: 10 tips I learned building fast Svelte sites from tooling to integrating SEO components and Netlify config

NPM stands for Node Package Manager and it is the package manager for the Node JavaScript platform....

webpack is a famous static module bundler. Module bundlers are used to bundle Javascript modules into...
Getting a good performance score from Google is hard for any website — but doing so for an online store is even harder. We achieved green scores — even several for mobile. Here is how we did it.
React Tutorial - This React tutorial is intended to assist you in learning the fundamentals to advance of ReactJS. Learn all about ReactJS from basics to advanced concepts like Component, State, Props, Router, Fragmentation, Redux, etc.

“Tree-shaking” is a must-have performance optimization when bundling JavaScript. In this article, we dive deeper on how exactly it works and how specs and practice intertwine to make bundles leaner and more performant. Plus, you’ll get a tree-shaking checklist to use for your projects.

Article was originally published here : https://bootrails.com/blog/rails-webpacker-full-setup Webpac...
Production grade React applications that scale. The world’s leading companies use Next.js by Vercel to build pre-rendered applications, static websites, and more.
Learn React and build this todos project with this course. Do you want to learn React and build...

This article is the first part of an upcoming series that provides a practical introduction to Dependency Injection in a manner that immediately permits you to realize its many benefits without being hampered down by theory.

About a year ago I wrote a guide on how to migrate to typescript from javascript on node.js and it g...
If you spend a lot of time on Hacker News, it’s easy to get taken by the allure of building a project without a framework.
The library for web and native user interfaces

Fast, reliable, and secure dependency management.
Working notes & digital experiments
In this guide, Ibrahima Ndaw will be looking at Next.js, a popular React framework that offers a great developer experience and ships with all of the features you need for production. We will also build a blog, step by step, using Next.js and MDX. Finally, we’ll cover why you would opt for Next.js instead of “vanilla” React and alternatives such as Gatsby.

Building fast, dynamic apps with Javascript and the static web
How to create simple CI/CD pipelines for automated deployments
Meet our new book, “TypeScript in 50 Lessons”, a deep-dive to understand what TypeScript is, how it works, and how you can make it work for you. With code walkthroughs, hands-on examples and common gotchas. 464 pages. Jump to table of contents and get the book right away.

55K subscribers in the angularjs community. A community for the awesome MVC JS framework.
"Framework is heart of every technology." Whether you are a beginner, a senior developer, a freela...
1kB-ish JavaScript framework for building hypertext applications - jorgebucaran/hyperapp
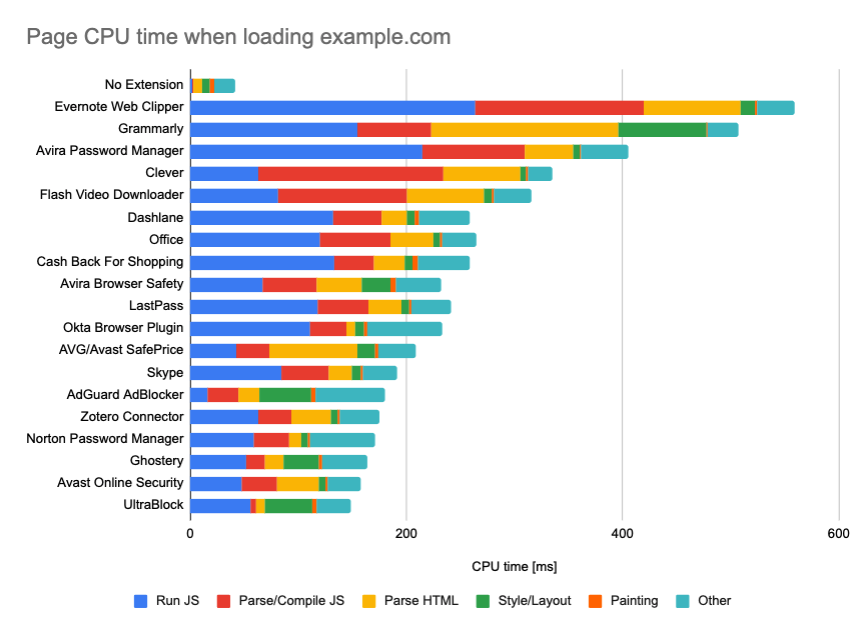
A look at how Chrome extensions affect CPU usage, page rendering, and browser memory consumption.

Deno features improved security, performance, and developer experience compared to its predecessor. It's a great time to upgrade your Node.js project to run on Deno.

Next.js 9.4 introduces React Fast Refresh, Incremental Static Regeneration, New Environment Support, Built-in Fetch, and more!

Installing latest node.js ubuntu. How do I Install stable node.js, npm on Ubuntu. Installing Node.js with apt-get package manager on Ubuntu

A new Rails 6 application will install both Webpacker and Sprockets by default. Don't they solve the same problem? This article dives into why Sprockets lives on even though webpack has surpassed most of its features ...

Design patterns are reusable solutions to commonly occurring problems in software design. Let's take a look at how they work and explore some popular JavaScript design patterns.

New! JavaScript and jQuery plugin to automatically add next pages.
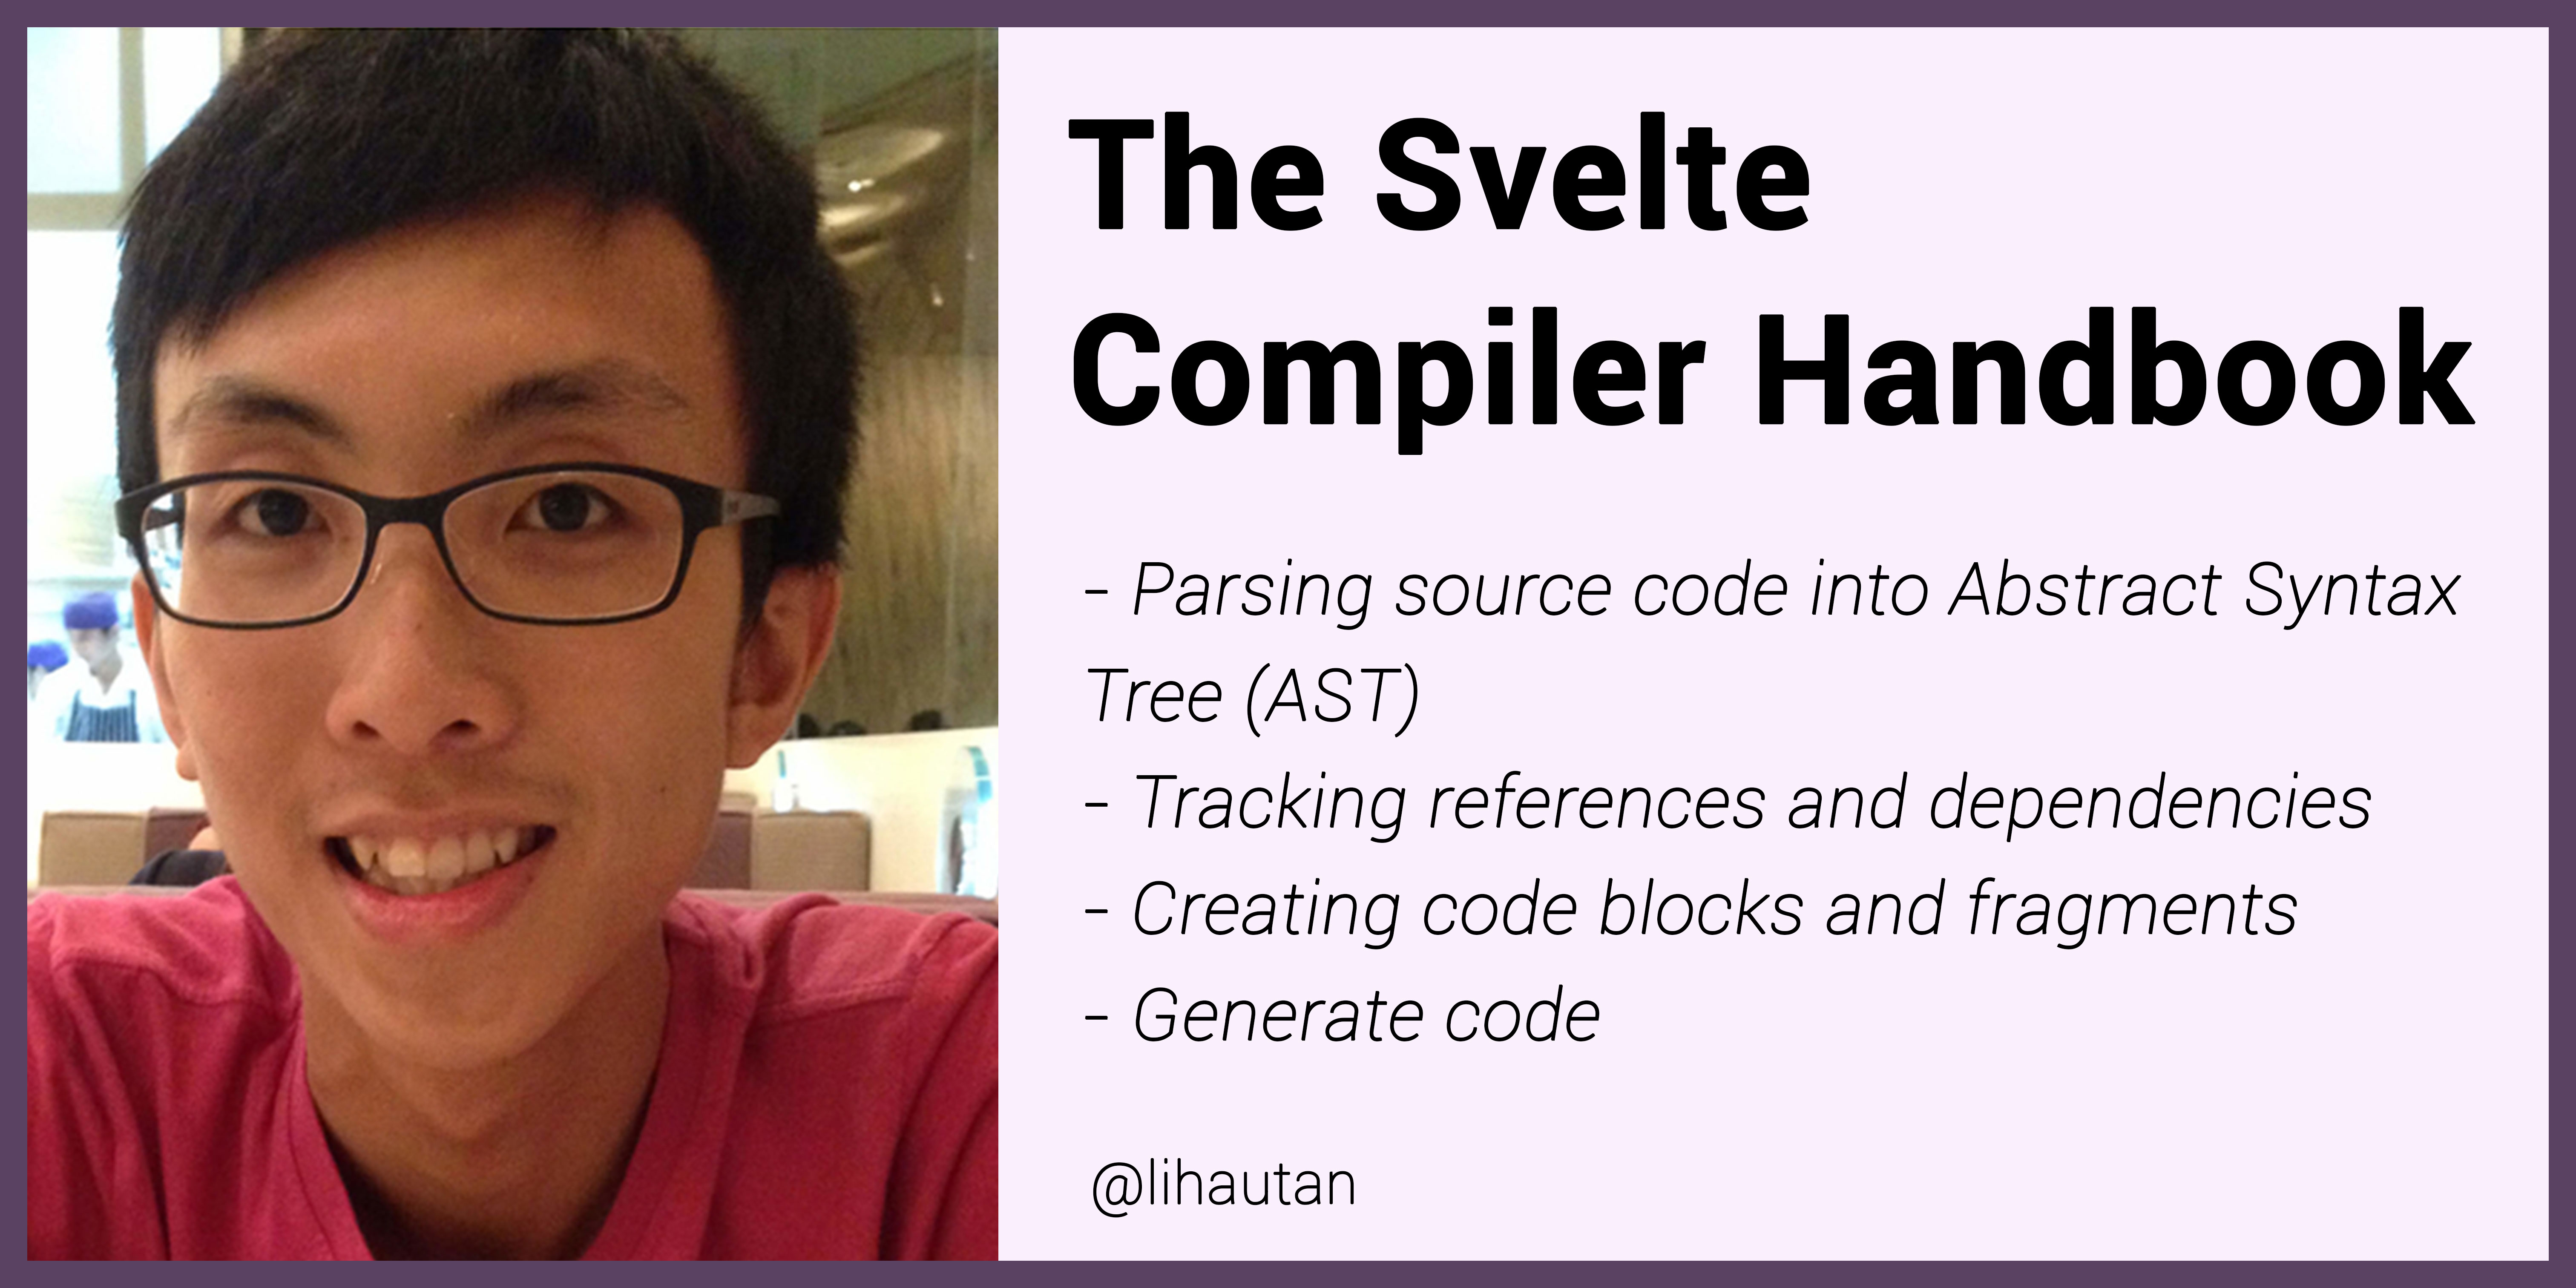
The Svelte compilation process can be broken down into 4-steps, 1) parsing source code into AST, 2) tracking references and dependencies, 3) creating code blocks and fragments, and 4) generate code.


55K subscribers in the angularjs community. A community for the awesome MVC JS framework.

55K subscribers in the angularjs community. A community for the awesome MVC JS framework.

The front-end is everything involved with what the user sees, including design and some languages like HTML and CSS.
55K subscribers in the angularjs community. A community for the awesome MVC JS framework.

See why React is the most popular JavaScript library for building frontends, and use it to build sites and apps.

Hackers are continuously developing new ways to exploit JavaScript vulnerabilities. Here are the JS attack vectors developers should know about.
Next.js 8 introduces Serverless Mode, smaller bundles, performance improvements, and more.
426K subscribers in the reactjs community. A community for discussing anything related to the React UI framework and its ecosystem. Join the…

Round, flat, designer-friendly pseudo-3D engine for canvas and SVG
Something a lot of beginners struggle with is the concept of passing data between different programmi...

React, Vue and Angular have been hot topics lately. Let's see if there are any other interesting tools and concepts out there.

This November's collection is packed with some powerful CSS frameworks, awesome date and time library and JS tools.

Debug More Efficiently
Evergreen is a React UI Framework for building ambitious products on the web. Made by Segment in San Francisco, CA.
HackerNews clone with Vue.js.

As JavaScript is getting more and more popular, teams are leveraging its support on many levels in their stack - front-end, back-end…
There’s been an interesting Reddit thread circling my corner of the internet for the last week or so. It started with a question: I’m inviting pure opinion here, but what’s your list of ten things that everyone looking for a good javascript role should know and understand. Personally, I’m in a role where what I know is adequate, but I want to be somewhere better; somewhere that has some flippin standards.

Two of the most commonly taught data structures in computer science are the singly-linked list and doubly-linked list.
-->
d3js (javascript)
categories:
tags: d3js javascript
date: 19 Apr 2025
slug:raindrop-d3js
The Sankey chart is a great way to discover the most prominent contributions just by looking at how individual items flow across states.
The MovingBubble chart is one of those mind-blowing charts to look at. Learn how to create them using your own data set and Python!
The landscape for learning d3 is rich, vast and sometimes perilous. You may be intimidated by the long list of functions in d3’s API…
A list of D3 libraries, plugins and utilities.
Visualize flow between nodes in a directed acyclic network. - d3/d3-sankey
A D3 project showing a barchart that allows user interactions
-->
angularjs (javascript)
categories:
tags: angularjs javascript
date: 19 Apr 2025
slug:raindrop-angularjs
A common reason why an Angular bundle is bloated is that it uses a library like MomentJS that isn't...
AngularJS is a magic framework. Using it well will drastically improve your productivity, code modularity and reusability. Using it badly…
I am new to Angular (even though I am not new to the web development), so please take everything that I am about to say with a grain of salt. That being said, I watched a lot of talks and read a lot of articles relevant to Angular performance, and this post is the summary […]
Angular is a platform for building mobile and desktop web applications. Join the community of millions of developers who build compelling user interfaces with Angular.
🕑 The Wait Is Over ❕
Angular Style Guide: A starting point for Angular development teams to provide consistency through good practices. - johnpapa/angular-styleguide
Learn to create interesting biological models and graphics using SVG and AngularJS
How to create simple CI/CD pipelines for automated deployments
55K subscribers in the angularjs community. A community for the awesome MVC JS framework.
"Framework is heart of every technology." Whether you are a beginner, a senior developer, a freela...
55K subscribers in the angularjs community. A community for the awesome MVC JS framework.
-->
negotiations (behavior)
categories:
tags: behavior negotiations
date: 19 Apr 2025
slug:raindrop-negotiations
A forgotten Nixon-era negotiation offers urgent lessons for our new age of economic warfare.


These five simple techniques can help you successfully negotiate anything—even when that involves speaking with a bully.
Negotiating effectively means proving that you’re a collaborator, not an adversary. To do that, you need to demonstrate that you’re attuned to your counterpart’s logic, emotions, and perspective. These strategies can help. Use short, simple vocal prompts. For example: “And?” “Really?” “Then?” “Mmm,” “Uh huh,” “Go on,” and “Interesting.” The aim is to nudge the […]

In artificial intelligence, the capacity of Large Language Models (LLMs) to negotiate mirrors a leap toward achieving human-like interactions in digital negotiations. At the heart of this exploration is the NEGOTIATION ARENA, a pioneering framework devised by researchers from Stanford University and Bauplan. This innovative platform delves into the negotiation prowess of LLMs, offering a dynamic environment where AI can mimic, strategize, and engage in nuanced dialogues across a spectrum of scenarios, from splitting resources to intricate trade and price negotiations. The NEGOTIATION ARENA is a tool and a gateway to understanding how AI can be shaped to think, react,

It was inevitable that the golf legend would be wooed away from the PGA Tour, writes Alan Shipnuck in an excerpt from his new book, LIV and Let Die. The question was who’d come along with him. “Everyone,” as one player puts it, “had a number."

The key to finding your power in any negotiation is preparation. Here's what to do.

Negotiation is tough. While no words work all the time, the following phrases can help keep you on track and serve notice to the other side.


The lesson in the Griner case is that public pressure can steer hostage negotiations in a direction that is disadvantageous to our side, but at least solves one case.
When people argue, a kind of frustration called persuasion fatigue can cloud their judgment and harm relationships
Arguing well isn’t just about winning. A philosophical approach will help you and the other person get much more out of it
Negotiating is something we do on a daily basis, be it at work or at home, and is key to ensuring that you always get the best outcome.

(Cross posted to LessWrong)
How to turn arguments from vicious battles into productive dialogues.

People, including negotiators, lie every day, so when you’re trying to make a deal, it’s important to defend against deception. The best strategy, says the author, is to focus not on detecting lies but on preventing them. She outlines five tactics that research has shown to be effective: Encourage reciprocity. You can build trust and prompt other parties to disclose strategic information by sharing information yourself. Ask the right questions. Negotiators often lie by omission, keeping mum about relevant facts, but if directly asked, they are more likely to respond honestly. Watch for dodging. Don’t let your counterparts sidestep your questions—write them down in advance, take notes on the answers, and make sure you get the information you’re seeking. Don’t dwell on confidentiality. Studies show that the more you reassure others that you’ll protect their privacy, the more guarded and apt to lie they become. So be nonchalant when discussing sensitive topics. Cultivate leaks. People often reveal information unwittingly, so listen carefully for any slips and try indirect approaches to gaining information.

Insights into attitudinal restructuring and intra-organizational negotiations still hold the key to positive outcomes.
Notes from books and other interesting things that I've read. Table of contents at the end 👇 - mgp/book-notes

Why did you sting me? You'll drown too

How does hostage negotiation get people to change their minds? The Behavioral Change Stairway Model was developed by the FBI’s hostage negotiation unit, and it...

Imagine you’re a product manager and a co-worker from Marketing comes to you with a feature request. Let’s call her ‘fictitious Annie’. She asks you, “Wouldn’t it be awesome if we built this amazing crypto-blockchain feature into our product?” Well…

It's possible to get a higher salary without taking anyone captive.

In this article, my goal is to show you what is negotiation for Product Managers and share 10 steps to influence without authority.

Whether you want a raise, different responsibilities, or more resources, knowing how to negotiate is vital. Here are 5 (non-sleazy, promise!) tricks straight from the car lot that will help you get what you want at work.
Learn the street epistemology conversation technique and how you can apply it at work.

Stop wielding your values as a weapon and start offering them as a gift.

The case for the argumentative theory of reason, as made by The Office
The long read: The troubled times we live in, and the rise of social media, have created an age of endless conflict. Rather than fearing or avoiding disagreement, we need to learn to do it well
Bridge the divide with thoughtful conversation techniques, next-level listening, and a dip into the science of changing minds.

Three very different case studies — involving hostages in Afghanistan, a suicidal man in Calgary, and a tug-of-war between Brazilian and French businessmen — point to the importance of face, or reputation, in negotiations. To help you and your negotiating partners succeed, it is important to recognize why face matters, map out all the players involved in a negotiation, ask yourself if the solution being proposed will cause a loss of face for anyone, and work to help avoid that.
The book Honeybee Democracy, published in 2010, has been sitting on my shelf for many years.

Want to ask for a raise, lower your rent or haggle for the best price on a new car? Understanding how your brain works is the first step.

Big ideas, strong-willed characters, impossible deadlines and close quarters — if you wrote out a recipe for conflict, it might bear an uncanny resemblance to the high-stakes, pressure-cooker environment of a startup. We spoke with top engineers, seasoned managers and experts in human behavior to share their experience-tested wisdom on conflict mediation and management in rapidly scaling companies.
:extract_focal()/https%3A%2F%2Fi2.wp.com%2Fdariusforoux.com%2Fwp-content%2Fuploads%2F2017%2F09%2Fassholes.png%3Ffit%3D665%252C499%26ssl%3D1)
Because some people never outgrow being bullies.

How to be a better negotiator: tips from Christopher Voss, former international FBI hostage negotiator for 24 years

How do you get what you want out of a negotiation? United Nations negotiation trainer Alex Carter says the best methods center on recruitment, not rivalry. Whether you're asking for a raise or resolving a family dispute, she offers five simple tips for a successful discussion — starting with one powerful question.
-->
jupyter
categories:
tags: jupyter
date: 19 Apr 2025
slug:jupyter
Explore this post and more from the Jupyter community

Posted by mehul_gupta1997 - 8 votes and 0 comments

You cannot share Jupter Notebook's ipynb files with everyone. However, if you convert it to PDF, sharing becomes easier. Here's how to do it.
JupyterLab 4.3.0 and Notebook 7.3.0 have been released! These new minor releases include many enhancements and bug fixes.

The digital age demands for automation and efficiency in the domain of software and applications. Automating repetitive coding tasks and reducing debugging time frees up programmers' time for more strategic work. This can be especially beneficial for businesses and organizations that rely heavily on software development. The recently released AI-powered Python notebook Thread addresses the challenge of improving coding efficiency, reducing errors, and enhancing the overall coding experience for both beginners and experienced programmers. Traditional coding environments often require significant investment in writing boilerplate code, debugging, and understanding complex syntax, which can be daunting for beginners and time-consuming for experts.
JupyterLab 4.1 and Notebook 7.1 are now available! These releases include several new features, bug fixes, and enhancements for extension…
I trying to use virtualenv on jupyter notebook, to use all packages installed in an environment, but inside jupyter they are not recognized. Already tried: pip install tornado==4.5.3 pip install
Do you use Python, Pandas, and Seaborn to collect, analyze, and plot data? Then you'll be amazed by what ChatGPT can do, when using ChatGPT+, GPT-4 model, and the plugin for Noteable's version of Jupyter notebooks. [UPDATE/NOTE: This was my first summary of Noteable and ChatGPT. I have done more experiments, which you can see here: https://www.youtube.com/watch?v=2WUZ0b-hUDU] In this video, I show you how I got things set up for using Noteable (and world headlines), then put together a query, You'll see how it goes well, where it goes wrong, and what sort of code I can create using just English-language descriptions of my plans. And I show you what's happening behind the scenes, as we see the JSON being written. This is all brand new and exciting, and I hope that you'll post suggestions and ideas in the comments for how we can take this even further! And if you're interested in analyzing data with Pandas, check out Bamboo Weekly at https://www.BambooWeekly.com/, where I look at current events through the eyes of data analysis.
A much overlooked way to save some time.

Unlock the full potential of Jupyter Notebook with expert tips and techniques, including time-saving shortcuts, powerful magic functions, and advanced features, to boost your productivity.
An Introduction to the PyGWalker Library for Easy Data Visualisation
We are pleased to announce a major update to JupyterLab Desktop which adds many new features with main focus on the user experience…
Explore data with Python & SQL, work together with your team, and share insights that lead to action — all in one place with Deepnote.
I have to conclusion how to setup MongoDB (NoSQL) with Jupyter Notebook by summary step like...

Project Jupyter provides a broad collection of open-source tools for interactive computing that has become ubiquitous in data science and…

Write, test, document, and distribute software packages and technical articles — all in one place, your notebook.
Create delightful software with Jupyter Notebooks

Explore the Jupyter Notebook beyond its traditional use. Discover 8 alternative ways to utilize this versatile tool, making it even more powerful for coding, experimentation, and collaboration.
How to create parameterized Jupyter Notebooks with Papermill
Practical tips to enhance your workflow documentation

I love Jupyter notebooks and the power they provide.They can be used to present findings as well as share code in the most effective manner which was not easy with the previous IDEs.Yet there is something still amiss.There are a few functionalities I aspire in my text editor which don’t come by default in Jupyter.But fret not. Just like everything in Python, Jupyter too has third-party extensions. This post is about some of the most useful extensions I found.
IPython is a powerful Python REPL that gives you tab completion, better tracebacks, multiline editing, and several useful features on top…

All good things (must) come to an end to make way for something better.

If you're doing data science in Python, notebooks are a powerful tool. This free Jupyter Notebooks tutorial has will help you get the best out of Jupyter.
Essential extensions that will boost your productivity in Jupyter Notebook.

Jupyter notebooks are mostly known for their web-based user interface, such as JupyterLab or the Classic Notebook. They offer a great user…

Not only Jupyter, Google Colab, R Markdown, and much more.
for beginners as well as advanced users
JupyterLab moves closer to becoming a full-fledged IDE with xeus-python.

Introducing a new Jupyter kernel for Robot Framework

Common keyboard shortcuts for notebooks
Hi, conda activate base jupyter notebook Gives me this message: Traceback (most recent call last): File "/home/ics_vr/anaconda3/bin/jupyter-notebook", line 7, in from noteb...
Make your Jupyter Notebook more ‘magical’ with these magic commands
Official gem repository: Ruby kernel for Jupyter/IPython Notebook - SciRuby/iruby

Jupyter Notebook is an open-source web application that lets you create and share interactive code, visualizations, and more. This tool can be used with seve…
Imagine having your Friends Working with your Local Jupyter Notebook in a Remote Machine
This article introduces the easy to use blogging platform fastpages. fastpages relies on Github pages for hosting, and Github Actions to automate the creation of your blog, and contains extra features for Jupyter Notebooks.

By Pier Paolo Ippolito Introduction Jupyter Notebook is nowadays probably the most used environment for solving Machine Learning/Data Science tasks in Python. Jupyter Notebook is a client-server application used for running notebook documents in the...

The Xeus project has been incorporated as a Jupyter subproject.
Collection of notebooks about quantitative finance, with interactive python code. - cantaro86/Financial-Models-Numerical-Methods
Here's how to install PySpark on your computer and get started working with large data sets using Python and PySpark in a Jupyter Notebook.
1.3M subscribers in the Python community. The official Python community for Reddit! Stay up to date with the latest news, packages, and meta…
My Jupyter notebooks installed with python 2 kernel. I do not understand why. I might have messed something up when I did the install. I already have python 3 installed. How can I add it to Jupyter?

Jupyter Notebook is a powerful tool for data analysis. Here are 28 tips, tricks and shortcuts to turn you into a Jupyter notebooks power user!

Creating complex layouts of widgets (button, sliders, maps, graphs etc.) can be cumbersome. New layout templates make this task a breeze.

Today, we are pleased to announce the 1.0 release of JupyterHub. We’ve come a long way since our first release in March, 2015. There are…
Being in the data science domain for quite some years, I have seen good Jupyter notebooks but also a lot of ugly. Notebooks can have the perfect balance between text, code and visualisations but how often do your notebooks rather get messy and incomprehensible after a while? Follow some simple best practices to work more efficiently with your notebooks.

How to get the most from the notebook environment
Edited: Update on 2018-11-23 Added: Table of Content, %debug magic, nbdime for notebook diffing

Scientists, educators and engineers not only use programming languages to build software systems, but also in interactive workflows, using…
Introduction of a new feature-rich golang Jupyter kernel
Check out these 5 Jupyter notebook extensions to help increase your productivity.
Custom Jupyter Notebook Themes.
Interactive Widgets for the Jupyter Notebook.

Looking to bring more features into your Jupyter Notebooks? Lean about the powerful features that can be added to enhance business intelligence.
-->
finance
categories:
tags: finance
date: 19 Apr 2025
slug:raindrop-finance
-->
prodmgmt/features
categories:
tags: features prodmgmt
date: 19 Apr 2025
slug:feature-factories
prodmgmt/features

When it's time to call a feature quits, how should you announce end of life? Here's how to sunset a feature while minimizing customer impact.
Imagine you’re a product manager and a co-worker from Marketing comes to you with a feature request. Let’s call her ‘fictitious Annie’. She asks you, “Wouldn’t it be awesome if we built this amazing crypto-blockchain feature into our product?” Well…

Meet the hidden pressures shaping design, from the waistlines of kings to the whims of 18th Century wagon drivers.
-->
nodejs (javascript)
categories:
tags: javascript nodejs
date: 19 Apr 2025
slug:raindrop-nodejs

Overview Redis, which stands for Remote Dictionary Server, is an open-source, in-memory...
Discover how to put an error handling layer in place for your Node.js application using Express.
Nginx is a popular web server that is widely used to serve static content, reverse proxy, and load...

Check out 5 Node.js tools that can help boost your productivity in 2023.
Let's dive into multithreading and how to use worker threads in Node.
NodeJS is growing in popularity since its inception. 30 million websites use NodeJS Back in 2018,...
This is a comprehensive overview for the most popular Node.js frameworks in the current year. Also covers up and rising stars to keep an eye out for.
One of the main benefits of JavaScript is that it runs both in the browser and the server. As an engineer you need to master a single language and your skills…
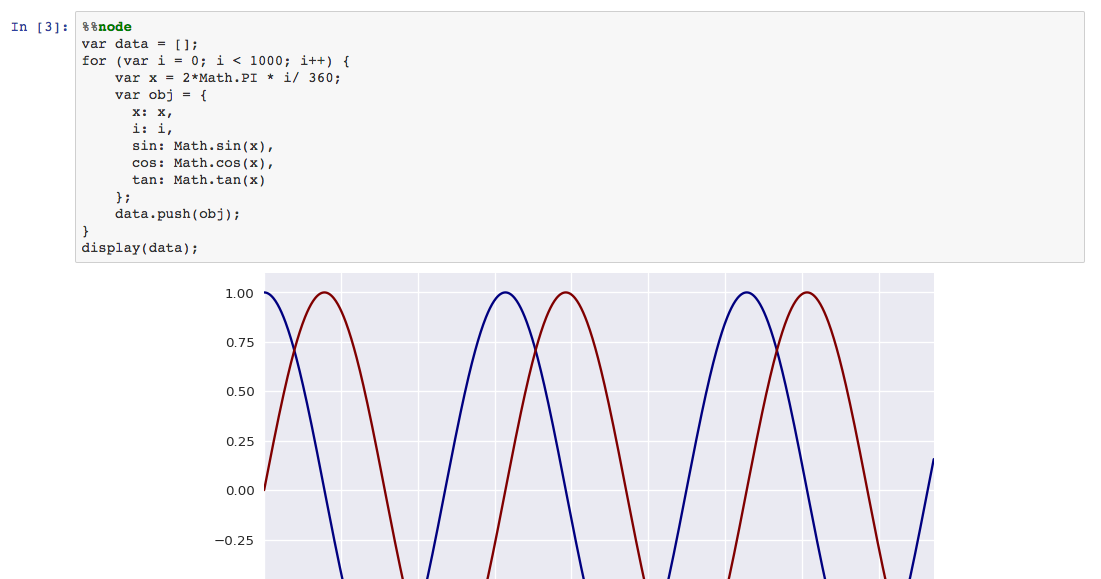
Python and Node.js in the same Jupyter notebook (part 1)

I was recently called to speak at a huge Brazilian conference called The Conf. The whole point of...

This Node.js tutorial series will help you build a Node.js-powered real-time chatroom web app fully deployed in the cloud. In this series, you will learn
:zap: Delightful Node.js packages and resources.
A step-by-step guide for deploying your first Node app and mastering the basics of Heroku
:snowflake: a short introduction to node.js.

While it is single-threaded, Node.js uses worker threads that allow for a separate execution thread that runs alongside the main thread.

Even a few years ago, web application development was not what it is today. Nowadays, there are so...

Application Programming Interface is the abbreviation for API. An API is a software interface that...
NPM stands for Node Package Manager and it is the package manager for the Node JavaScript platform....

Hi there 👋 Every application, you'll agree, needs a back-end. And there are many languages and tools...
According to the Node.js web survey report 2018, Node.js has increased developer productivity by 68%,...
Installing latest node.js ubuntu. How do I Install stable node.js, npm on Ubuntu. Installing Node.js with apt-get package manager on Ubuntu

How people are talking about your brand
A simplified Jira clone built with React/Babel (Client), and Node/TypeScript (API). Auto formatted with Prettier, tested with Cypress. - oldboyxx/jira_clone

In this article, you will learn how performing parallel computations can speed up the multiplication of two matrices.

Blog about programming

When it comes to performance, what works in the browser doesn’t necessarily suit Node.js. So, how do we make sure a Node.js implementation is fast and fit for purpose? Node is a very versatile platform, but one of the predominant applications is creating networked processes. In this article David Mark Clements is going to focus on profiling the most common of these: HTTP web servers.
-->
packaging (prodmgmt)
categories:
tags: packaging prodmgmt
date: 19 Apr 2025
slug:raindrop-prodmgmt-packaging
The benefits of Amazon's "Look inside" book label applies to many products. Apparel, bags, housewares, and more could experience more conversions with an inside peek.
Your #1 resource for digital marketing tips, trends, and strategy to help you build a successful online business.
The Swiss pharmaceutical giant Roche is nothing if not determined in its quest to acquire Illumina, the San Diego-based leader in genetic-sequencing equipment. In January, after Illumina’s board rebuffed Roche’s initial overtures, Roche made a $5.7 billion tender offer directly to shareholders. When that didn’t succeed, it extended the offer to midnight last Friday. Now […]

Believe it or not, packaging design is easier than you think! In this guide, learn everything you need to know to create stand-out product packaging.
Increase customer loyalty and take advantage of an additional opportunity to connect with customers by using packaging inserts. Here's why and how to use them in every package you send out.
If you’re a creative entrepreneur who understands the power of branding in your packaging design, you’re already
American consumers can’t resist the lure of a well-designed container. Of all the things I’ve purchased during the pandemic, the most useful has been a box cutter.
European stores like Marks & Spencer and Monoprix, and U.S. chains like Whole Foods, understand the powerful "appetite appeal" of grocery labels.

The containers we use over and over, from Cool Whip tubs to Taster’s Choice jars, can evoke stronger feelings than the food that came in them.
In the modern business world, there are several businesses releasing similar products into the market.
A recurring subscription model is a powerful tool for growth and profit — if you can get subscribers. "A lot of brands install our subscription software
In today's consumer-centric world, packaging designs hold a very important place! A unique and attractive packaging design is what captures the interest and attention of your consumer. It pulls the consumer towards the product and even drives them to purchase it. Hence, allocating time, effort, and energy to create an appealing packaging design is extremely
The box has never looked better.
Manufacturers are developing two packaging designs for the same product: those destined for the retail shelf and those sent directly to consumers.
-->
transformers (llms)
categories:
tags: llms transformers
date: 19 Apr 2025
slug:raindrop-llms-transformers
We insist that large language models repeatedly translate their mathematical processes into words. There may be a better way.
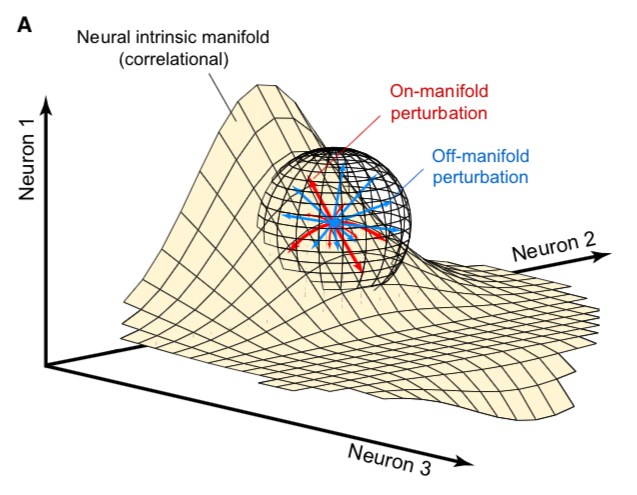

Large language models (LLMs) can understand and generate human-like text by encoding vast knowledge repositories within their parameters. This capacity enables them to perform complex reasoning tasks, adapt to various applications, and interact effectively with humans. However, despite their remarkable achievements, researchers continue to investigate the mechanisms underlying the storage and utilization of knowledge in these systems, aiming to enhance their efficiency and reliability further. A key challenge in using large language models is their propensity to generate inaccurate, biased, or hallucinatory outputs. These problems arise from a limited understanding of how such models organize and access knowledge. Without clear

Speed up your LLM inference

Natural Language Processing (NLP) has rapidly evolved in the last few years, with transformers emerging as a game-changing innovation. Yet, there are still notable challenges when using NLP tools to develop applications for tasks like semantic search, question answering, or document embedding. One key issue has been the need for models that not only perform well but also work efficiently on a range of devices, especially those with limited computational resources, such as CPUs. Models tend to require substantial processing power to yield high accuracy, and this trade-off often leaves developers choosing between performance and practicality. Additionally, deploying large models
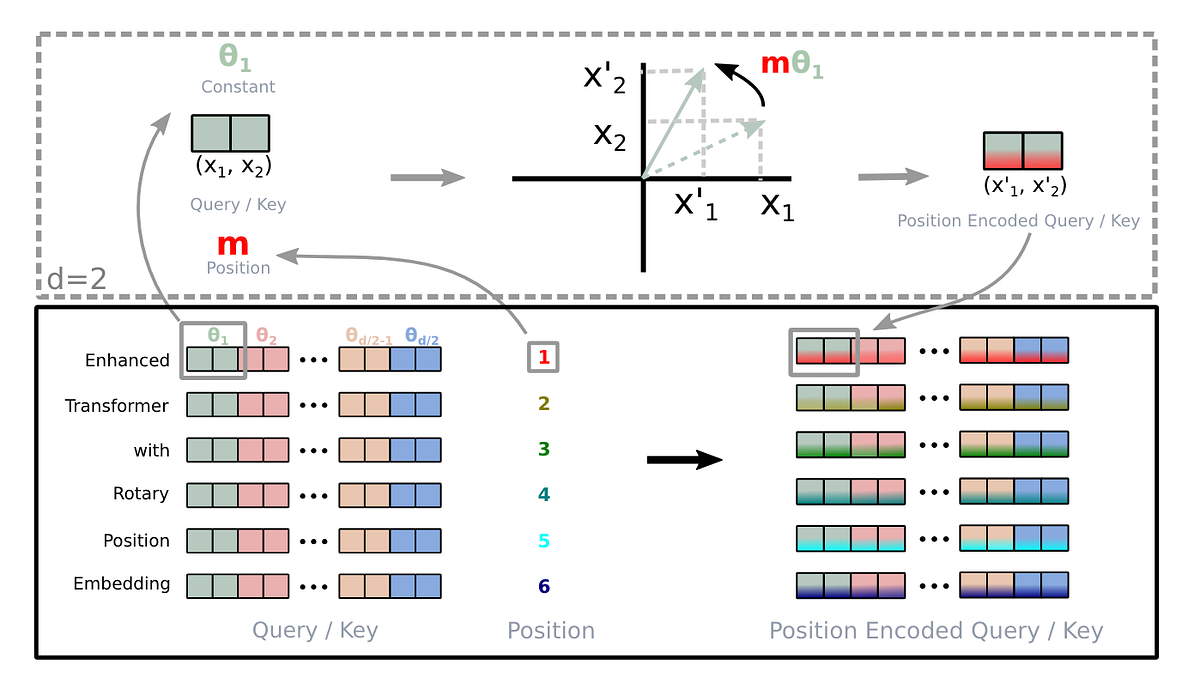
A deep dive into absolute, relative, and rotary positional embeddings with code examples

The Sohu AI chip by Etched is a thundering breakthrough, boasting the title of the fastest AI chip to date. Its design is a testament to cutting-edge innovation, aiming to redefine the possibilities within AI computations and applications. At the center of Sohu's exceptional performance is its advanced processing capabilities, which enable it to handle complex computations at unprecedented speeds. With a capability of processing over 500,000 tokens per second on the Llama 70B model, the Sohu chip enables the creation of unattainable products with traditional GPUs. An 8xSohu server can effectively replace 160 H100 GPUs, showcasing their remarkable efficiency
This is a visual guide (scroll story) to Vision Transformers (ViTs), a class of deep learning models that have achieved state-of-the-art performance on image classification tasks.

Is Attention all you need? Mamba, a novel AI model based on State Space Models (SSMs), emerges as a formidable alternative to the widely used Transformer models, addressing their inefficiency in processing long sequences.
The Math and the Code Behind Position Embeddings in Vision Transformers
The Math and the Code Behind Attention Layers in Computer Vision
A Full Walk-Through of Vision Transformers in PyTorch
In the past few years we have seen the meteoric appearance of dozens of foundation models of the Transformer family, all of which have memorable and sometimes funny, but not self-explanatory,...

Welcome to this beginner-friendly tutorial on sentiment analysis using Hugging Face's transformers...
A quick-start guide to using open-source LLMs

This article provides a series of techniques that can lower memory consumption in PyTorch (when training vision transformers and LLMs) by approximately 20x without sacrificing modeling performance and prediction accuracy.
1) Reinforcement Learning with Human Feedback(RLHF) 2) The RLHF paper, 3) The transformer reinforcement learning framework.

Facebook’s parent company is inviting researchers to pore over and pick apart the flaws in its version of GPT-3

Transformer models are one of the most exciting new developments in machine learning. They were introduced in the paper Attention is All You Need. Transformers can be used to write stories, essays, poems, answer questions, translate between languages, chat with humans, and they can even pass exams that are hard for humans! But what are they? You’ll be happy to know that the architecture of transformer models is not that complex, it simply is a concatenation of some very useful components, each o
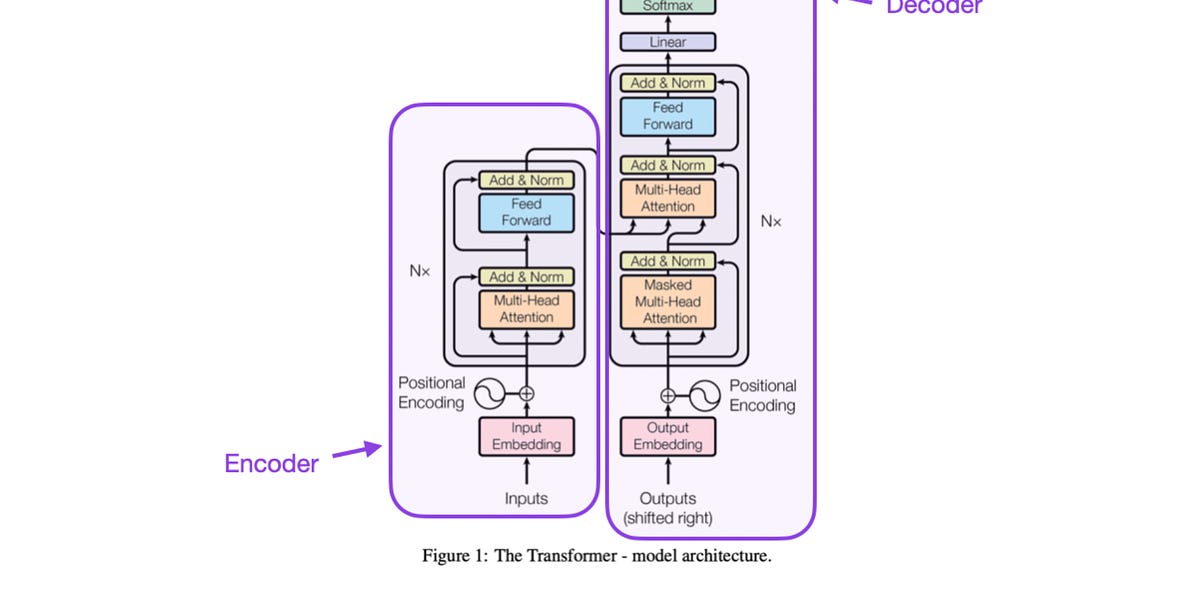
A Cross-Section of the Most Relevant Literature To Get Up to Speed
I explain what is so unique about the RWKV language model.
The rapidly increasing size of deep-learning models has caused renewed and growing interest in alternatives to digital computers to dramatically reduce the energy cost of running state-of-the-art...
Many new Transformer architecture improvements have been proposed since my last post on “The Transformer Family” about three years ago. Here I did a big refactoring and enrichment of that 2020 post — restructure the hierarchy of sections and improve many sections with more recent papers. Version 2.0 is a superset of the old version, about twice the length. Notations Symbol Meaning $d$ The model size / hidden state dimension / positional encoding size.
Implementation of Vision Transformer, a simple way to achieve SOTA in vision classification with only a single transformer encoder, in Pytorch - lucidrains/vit-pytorch
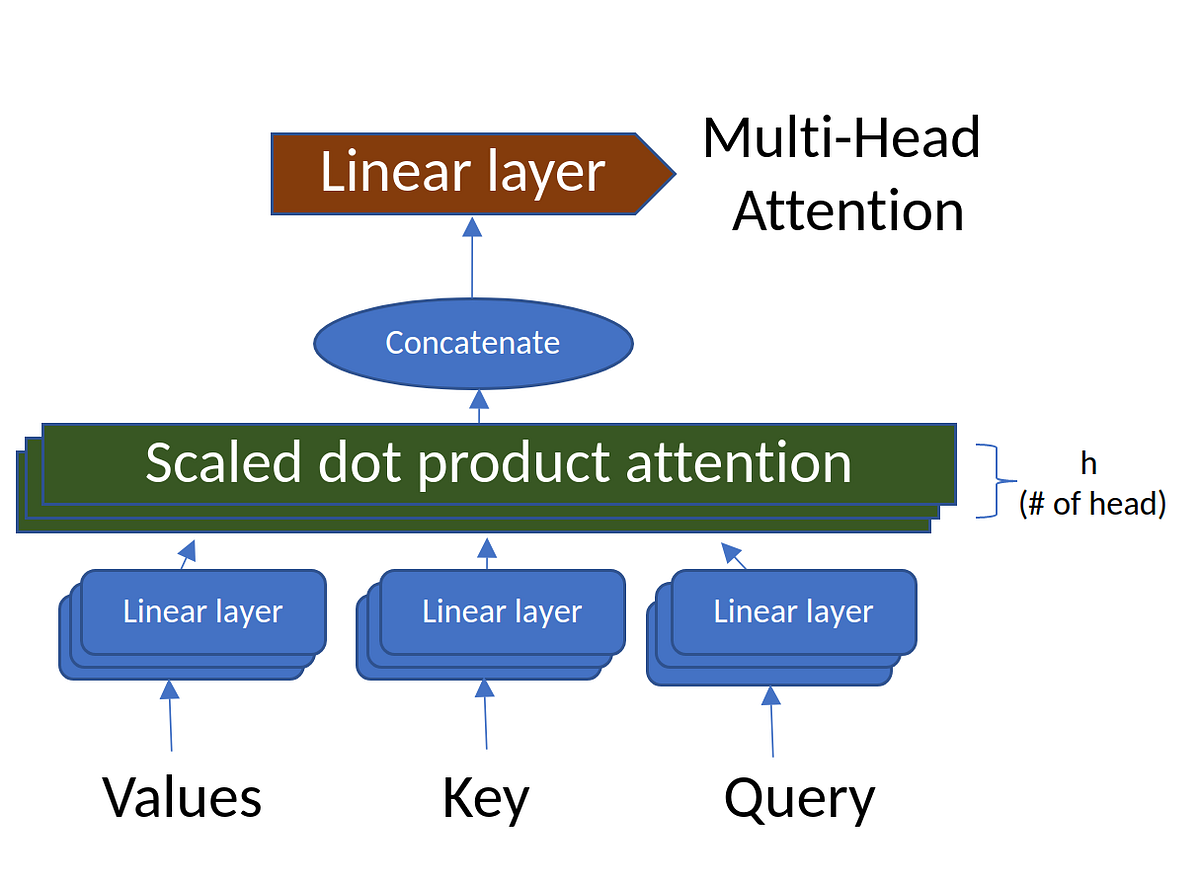
Attention, Self-Attention, Multi-head Attention, Masked Multi-head Attention, Transformers, BERT, and GPT
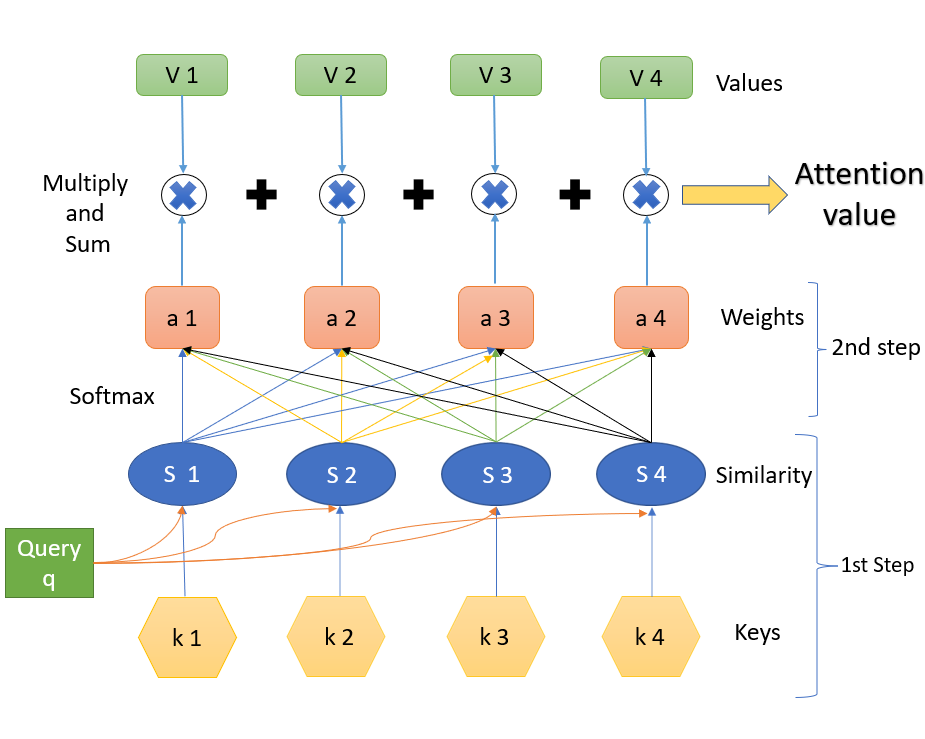
Attention, Self-Attention, Multi-head Attention, and Transformers
State-of-the-art transformers for Ruby.
Summary: We have released GPT-J-6B, 6B JAX-based (Mesh) Transformer LM (Github).GPT-J-6B performs nearly on par with 6.7B GPT-3 (or Curie) on various zero-shot down-streaming tasks.You can try out …
This repository contains demos I made with the Transformers library by HuggingFace. - NielsRogge/Transformers-Tutorials
Discussions: Hacker News (65 points, 4 comments), Reddit r/MachineLearning (29 points, 3 comments) Translations: Arabic, Chinese (Simplified) 1, Chinese (Simplified) 2, French 1, French 2, Italian, Japanese, Korean, Persian, Russian, Spanish 1, Spanish 2, Vietnamese Watch: MIT’s Deep Learning State of the Art lecture referencing this post Featured in courses at Stanford, Harvard, MIT, Princeton, CMU and others In the previous post, we looked at Attention – a ubiquitous method in modern deep learning models. Attention is a concept that helped improve the performance of neural machine translation applications. In this post, we will look at The Transformer – a model that uses attention to boost the speed with which these models can be trained. The Transformer outperforms the Google Neural Machine Translation model in specific tasks. The biggest benefit, however, comes from how The Transformer lends itself to parallelization. It is in fact Google Cloud’s recommendation to use The Transformer as a reference model to use their Cloud TPU offering. So let’s try to break the model apart and look at how it functions. The Transformer was proposed in the paper Attention is All You Need. A TensorFlow implementation of it is available as a part of the Tensor2Tensor package. Harvard’s NLP group created a guide annotating the paper with PyTorch implementation. In this post, we will attempt to oversimplify things a bit and introduce the concepts one by one to hopefully make it easier to understand to people without in-depth knowledge of the subject matter. 2020 Update: I’ve created a “Narrated Transformer” video which is a gentler approach to the topic: A High-Level Look Let’s begin by looking at the model as a single black box. In a machine translation application, it would take a sentence in one language, and output its translation in another.

How this novel neural network architecture changes the way we analyze complex data types, and powers revolutionary models like GPT-3 and BERT.
An intuitive understanding on Transformers and how they are used in Machine Translation. After analyzing all subcomponents one by one such as self-attention and positional encodings , we explain the principles behind the Encoder and Decoder and why Transformers work so well
-->
gans (deep learning)
categories:
tags: deep-learning gans
date: 19 Apr 2025
slug:gans
Fréchet Inception Distance (FID) is a metric that quantifies the quality and diversity of images generated by GANs by comparing feature representations.

Deep learning architectures have revolutionized the field of artificial intelligence, offering innovative solutions for complex problems across various domains, including computer vision, natural language processing, speech recognition, and generative models. This article explores some of the most influential deep learning architectures: Convolutional Neural Networks (CNNs), Recurrent Neural Networks (RNNs), Generative Adversarial Networks (GANs), Transformers, and Encoder-Decoder architectures, highlighting their unique features, applications, and how they compare against each other. Convolutional Neural Networks (CNNs) CNNs are specialized deep neural networks for processing data with a grid-like topology, such as images. A CNN automatically detects the important features without any human supervision.
Wasserstein distance helps WGANs outperform vanilla GANs and VAEs. This post explains why so using some easy math.

An overview of DCGAN architecture with a step-by-step guide to building it yourself

Because GANs are not all you need

Computer scientists from the University at Buffalo used the method to successfully detect Deepfakes taken from This Person Does Not Exist.
I bet most of us have seen a lot of AI-generated people faces in recent times, be it in papers or blogs. We have reached a stage where it is becoming increasingly difficult to distinguish between actual human faces and faces that are generated by Artificial Intelligence. In this post, I will help the reader to understand how they can create and build such applications on their own. I will try to keep this post as intuitive as possible for starters while not dumbing it down too much. This post is about understanding how GANs work.
Nvidia's GauGAN tool has been used to create more than 500,000 images, the company announced at the SIGGRAPH 2019 conference in Los Angeles.

Generative adversarial networks (GANs) are a class of neural networks that are used in unsupervised machine learning. They help to solve such tasks as image generation from descriptions, getting high resolution images from low resolution ones, predicting which drug could treat a certain disease, retrieving images that contain a given pattern, etc. Our team asked… Read More »Generative Adversarial Networks (GANs): Engine and Applications
Emil Mikhailov is the founder of XIX.ai [http://XIX.ai] (YC W17). Roman Trusov is a researcher at XIX.ai. Recent studies by Google Brain have shown that any machine learning classifier can be tricked to give incorrect predictions, and with a little bit of skill, you can get them to give pretty much any result you want. This fact steadily becomes worrisome as more and more systems are powered by artificial intelligence — and many of them are crucial for our safe and comfortable life. Banks, sur
-->
prodmgmt/ideation
categories:
tags: ideation prodmgmt
date: 19 Apr 2025
slug:raindrop-prodmgmt-ideation

Reading obituaries can boost creativity by exposing you to distant ideas, fueling the associations that lead to unexpected breakthroughs.

Can financial incentives turn innovation into a chore? A study of GitHub's efforts to sponsor software coders by Maria Roche and colleagues explores the interplay between motivation and creativity.

Organizing multistep projects can be challenging. Scrintal lets you easily focus on one element at a time.

Architect and poet Paolo Belardi traces the many conditions and situations that have inspired extraordinary ideas across the arts and sciences.
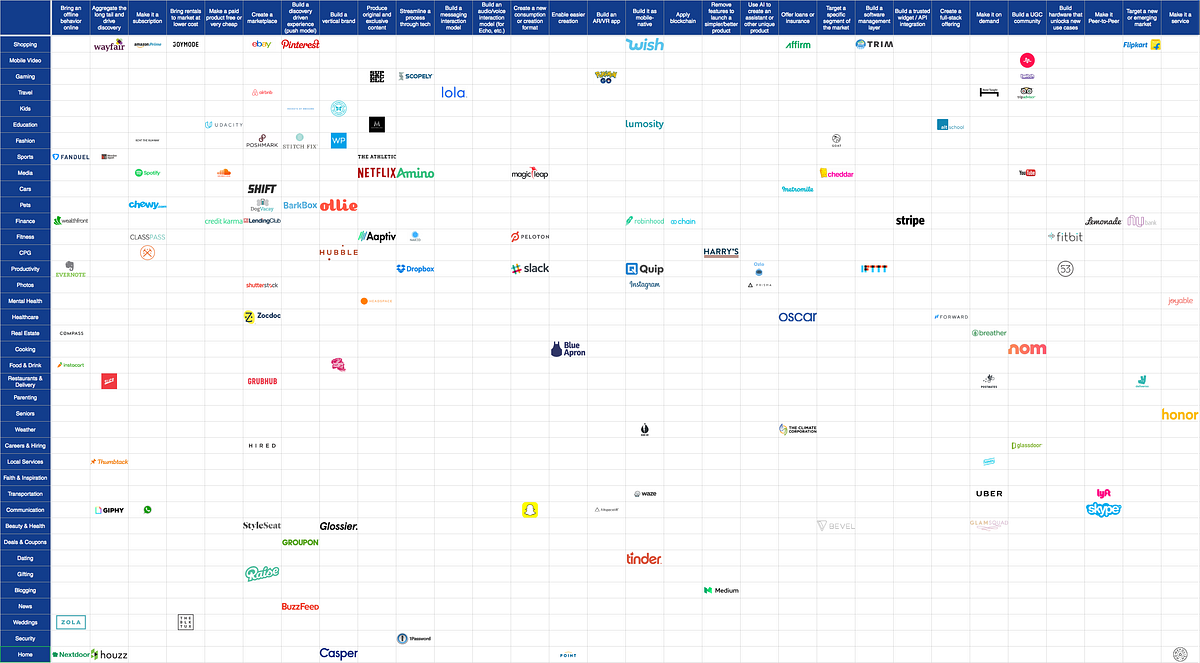
You can follow my latest writing at ScreenshotEssays.com

Creativity research in psychology reveals 14 ways to increase imaginative and creativity thinking, discover new ideas and solve problems.

Sometimes the search for creative insight requires us to focus, and sometimes it requires us to look away.

Feeling uninspired? Learn how to stay creative and keep on generating new ideas with these 13 simple yet effective tips.

You might need help to turn an idea into a project. Most of the time, though, project developers walk up to those that might help and say, “I have a glimmer of an idea, will you help me?̶…
In the Creative Founder, students are paired semi-randomly, and then spend a semester trying to get to product-market fit. I always start them with market selection. A market has three key elements…

Part Two of the Needfinding/Ideation/MVP Creation Charette This is the second part of a three part essay on rapid MVP creation to start testing assumptions. Part One is here. It was written for my …
Let’s say you manage a product that helps small businesses support their customers. You’re looking to improve customers’ engagement and retention levels. There are two ideas are on the table:

With close study, the genealogies of even the most original ideas can be traced
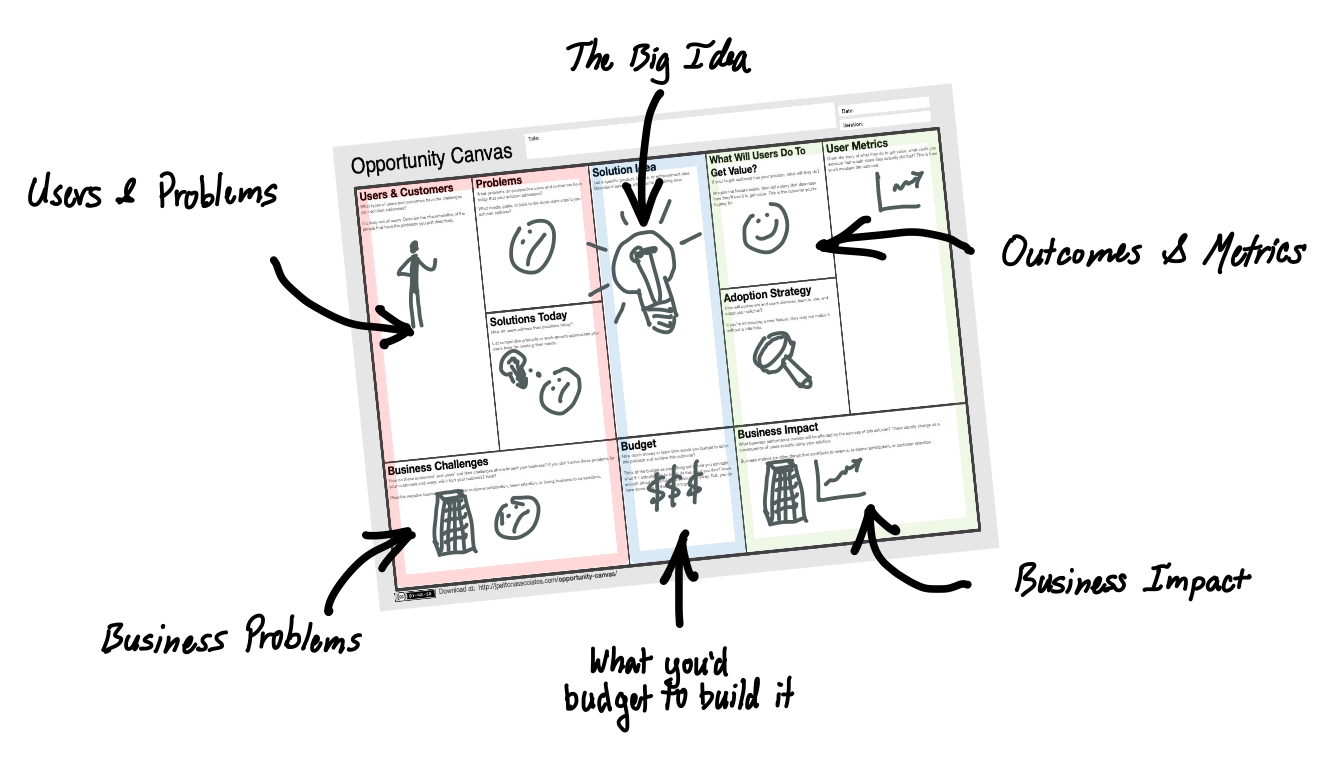

Mike Krieger, Instagram's founder thinks you can build apps that fit the real world by watching what people want, not guessing. He presented his eight core product design insights today at 500 Startups' Warm Gun conference. Here's the cheat sheet to his talk.
Two inventors turned a failed experiment into an irresistibly poppable product that revolutionized the shipping industry
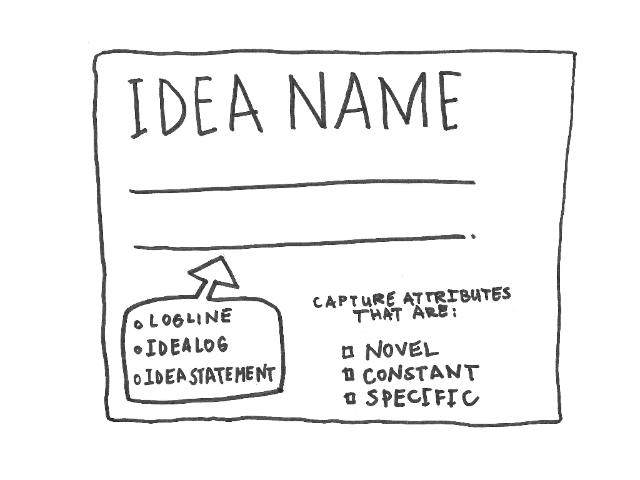
What's an idea? What sorts of ideas are there? And how to explain them once you have them?
This is an article about juxting — coming up with ideas by randomly juxtaposing two things and seeing the ways they could relate to each…
If you've ever stared at a blank page, you know the importance of creative constraints. Learn how to harness limitations for more and better ideas.
An introduction to forming hypothesis statements for product experimentation.
It’s so important to test your new product idea long before you feel ready.
I regularly help pre-seed entrepreneurs identify and evaluate potential startup opportunities. The following is a set of heuristics I’ve developed and collected over the years that might of u…

When you're faced with uncertainty, the best thing you can do is analyse your inputs, synthesise a new model, and then destroy it to start over again.

Most crowdsourcing initiatives end up with an overwhelming amount of useless ideas. Dealing with a full submission box is not only extremely time consuming and costly, it also biases how ideas are selected: When firms receive too many ideas, they tend to focus on ideas that are already familiar to them, defeating the entire purpose of crowdsourcing, which is to surface new thinking. Why do many crowdsourced ideas turn out so bad, and what can firms do about it? Recent research finds that it comes down to understanding the motivations of crowd members.
One of the best ways to learn and come up with new ideas is to focus intensely on a problem, then let your mind wander. I’ve enjoyed doing this when problem solving and learning, and recently I’ve been thinking about how weird it is to build trust in your unconscious to do the work for you, especially when it comes to technical work. Letting your mind focus and letting your mind wander The first recommendation I have for anyone taking a meta look at learning is Barbara Oakley’s Learning How To Learn.

Asynchronous remote ideation allows people to contribute ideas whenever it’s convenient to do so, but synchronous sessions lead to faster results and more team building.

Second-order thinking is a mental model that smart people like Warren Buffett & Howard Marks use to avoid problems. Read this article to learn how it works.
Confirming what people already believe can sometimes help organizations overcome barriers to change.
-->
llms/prompts
categories:
tags: llms prompts
date: 20 Apr 2025
slug:raindrop-llms-prompts
OpenAI's president Greg Brockman recently shared this cool template for prompting their reasoning models o1/o3. Turns out, this is great for ANY reasoning… | 32 comments on LinkedIn
Johann Rehberger snagged a copy of the [ChatGPT Operator](https://simonwillison.net/2025/Jan/23/introducing-operator/) system prompt. As usual, the system prompt doubles as better written documentation than any of the official sources. It asks users …
Prompt engineering is an emerging skill and one companies are looking to hire for as they employ more AI tools. And yet dedicated prompt engineering roles may be somewhat short-lived as workforces become more proficient in using the tools.
It's like learning a new language - kind of.
91 votes, 10 comments. 1.3M subscribers in the awesome community. For everything that is awesome!

OpenAI's new reasoning model o1 behaves differently than previous models. So users have to prompt it differently than GPT-4 or even 4o.
A comparison between a report written by a human and one composed by AI reveals the weaknesses of the latter when it comes to journalism.
-->
mcps (llms)
categories:
tags: llms mcp
date: 20 Apr 2025
slug:raindrop-llms-mcp
In November 2024, Anthropic published a blog post announcing what may be its most significant contribution to the AI ecosystem so far: the Model Context Protocol.

Here are my top 12 MCP Servers I used and tested so far: - Python Code Interpreter: Runs Python code in a sandbox using Pyodide and Deno for isolation. https://lnkd.in/eYmexFA2 - Web fetcher: Fetches web page content using Playwright headless browser with JavaScript support. https://lnkd.in/eKQ4EXEX - Github MCP server: Provides seamless integration with GitHub APIs for automation and interaction. https://lnkd.in/eEKE83c3 - Filesystem: Implements filesystem operations like reading/writing files, creating/listing/deleting directories, moving, searching, and getting metadata within specified directories. https://lnkd.in/eqi4vUdJ - Google Drive: Integrates with Google Drive to allow listing, reading, and searching over files, with automatic export for Google Workspace file types. https://lnkd.in/eTGUHXgr - Fetch: Fetching websites converts HTML to markdown and allowing chunked reading. https://lnkd.in/ebuk59ZR - Markitdown: Converts various file types (PDF, Office docs, HTML, etc.) to Markdown, preserving structure for LLM consumption and text analysis. https://lnkd.in/eHuK-wj6 - Brave search: Integrates with Brave Search API to enable web searches and local business lookups via natural language queries. https://lnkd.in/e22vEUME - Slack: Enables interaction with Slack workspaces, including listing channels, posting messages, replying to threads, adding reactions, and getting history/users. https://lnkd.in/eWf4pZY6 - Notion API: Implements an MCP server for the Notion API, allowing interaction with Notion pages and databases. https://lnkd.in/edCuP443 - Airbnb: Allows searching Airbnb listings and retrieving detailed listing information. https://lnkd.in/etgemCvH - Arxiv: Provides access to arXiv papers through their API, allowing search and retrieval of paper metadata and links. https://lnkd.in/eUpPnhXX | 34 comments on LinkedIn


Try these MCP servers with Claude Desktop today for free.
MCP, short for Model Context Protocol, is the hot new standard behind how Large Language Models (LLMs) like Claude, GPT, or Cursor integrate with tools and data. It’s been described as the “USB-C for…
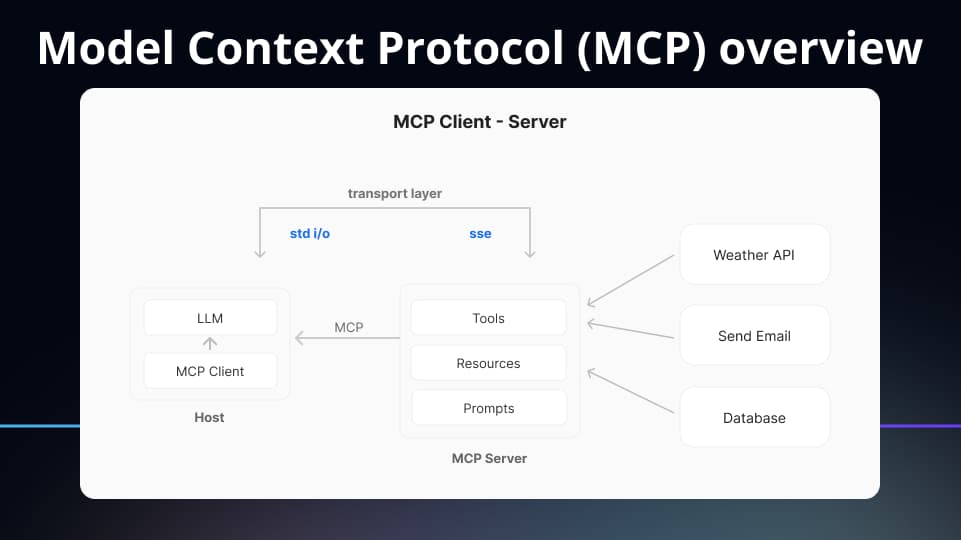
Overview of the Model Context Protocol (MCP) how it works, what are MCP servers and clients, and how to use it.

Learn how to configure and use Model Context Protocol (MCP) servers with GitHub Copilot in Visual Studio Code.
Explore this post and more from the Jupyter community
Posted by mehul_gupta1997 - 8 votes and 0 comments

-->
agents (llms)
categories:
tags: agents llms
date: 20 Apr 2025
slug:raindrop-llms-agents
What are the principles we can use to build LLM-powered software that is actually good enough to put in the hands of production customers? - humanlayer/12-factor-agents
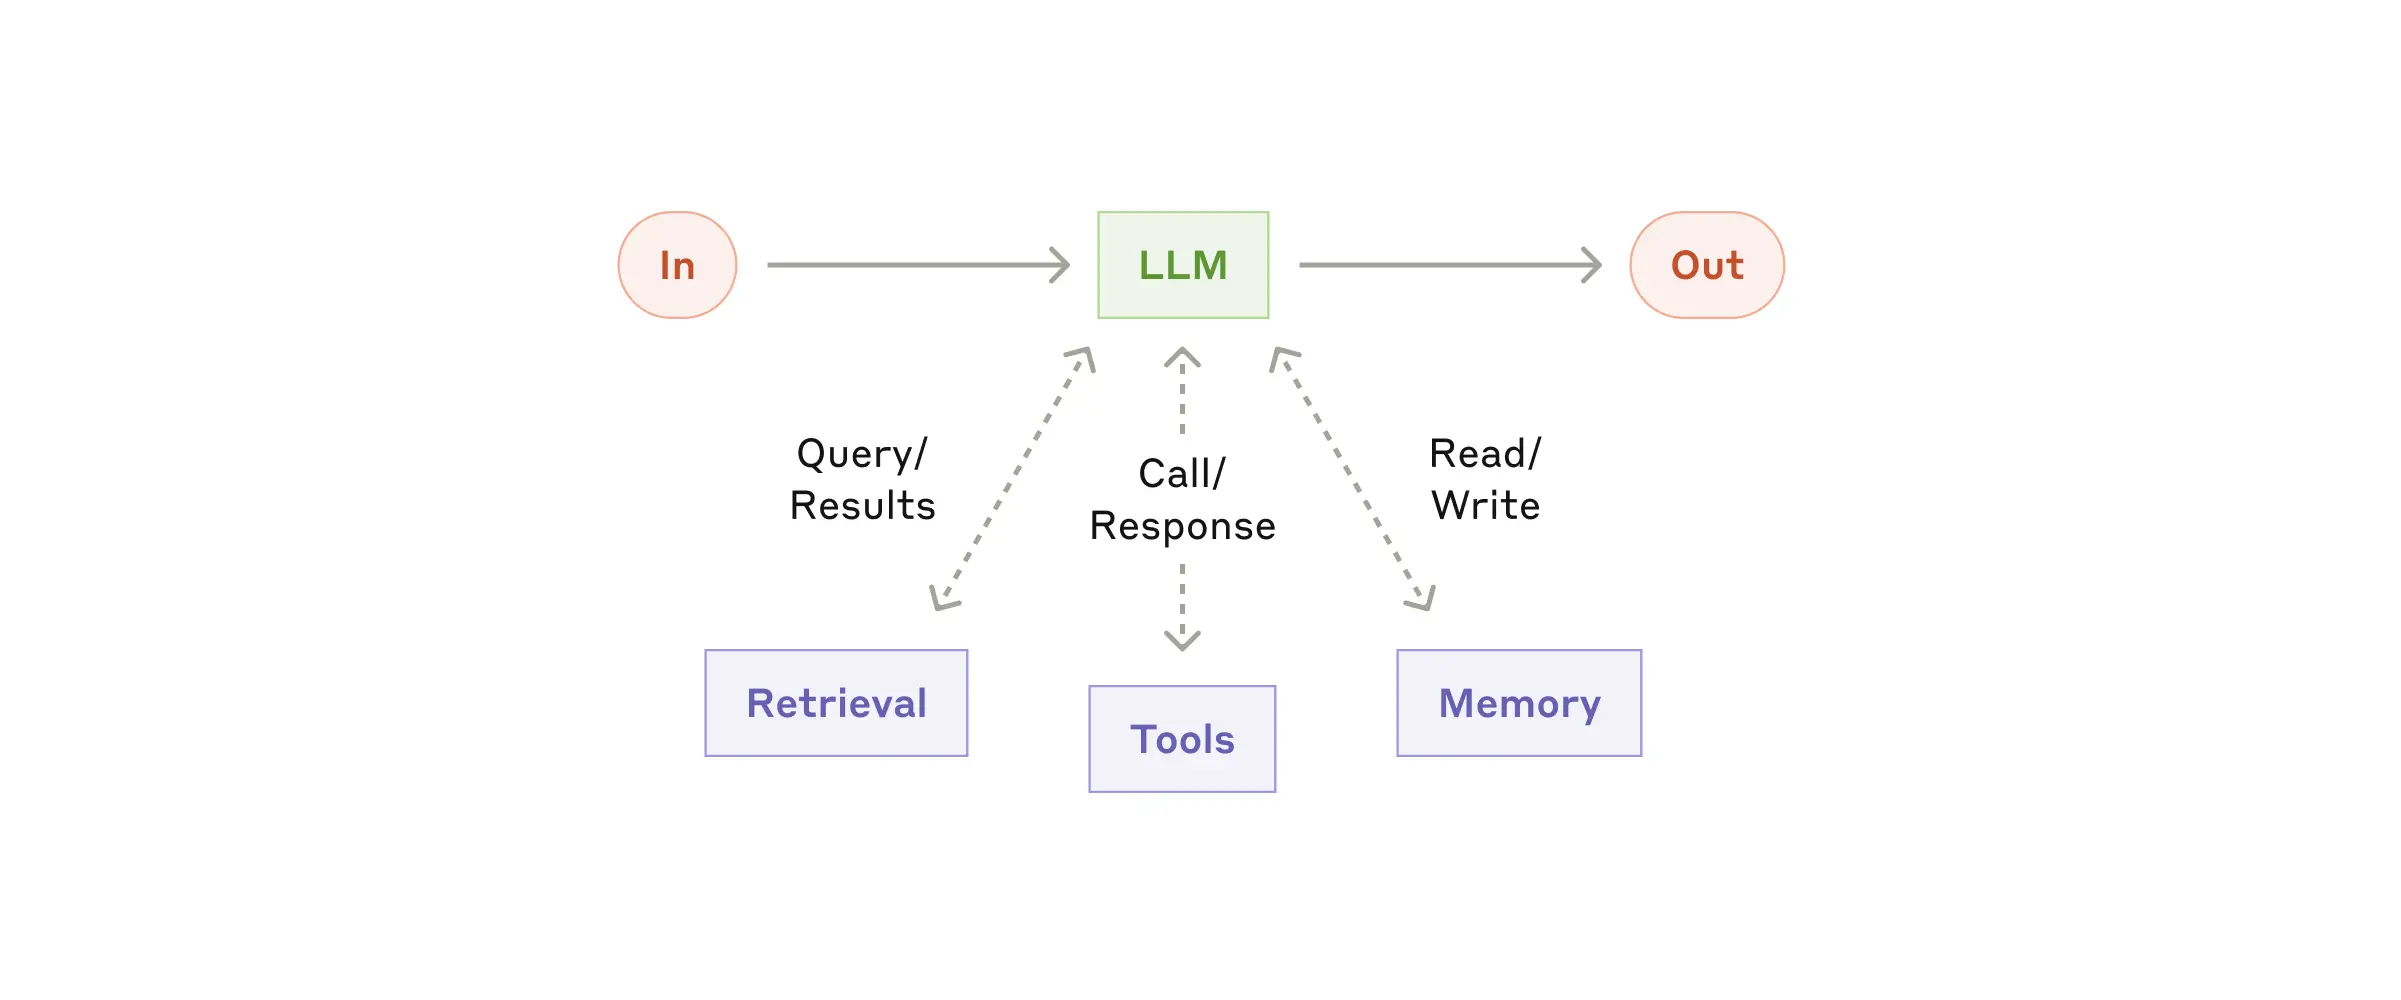
A post for developers with advice and workflows for building effective AI agents
Gary Hunt is an enigma. He trains with the intensity of a modern athlete, but relaxes like a sportsman of a bygone era. He is fiercely competitive but unbelievably laid-back. How did he become the greatest cliff diver of all time?
We introduce DeepNash, an autonomous agent capable of learning to play the imperfect information game Stratego from scratch, up to a human expert level. Stratego is one of the few iconic board...
Using q-learning for sequential decision making and therefore learning to play a simple game.
The Portuguese super-agent Jorge Mendes joined forces with investors from Shanghai and planned to cash in on buying and selling athletes, documents show.
-->
llms/attention
categories:
tags: attention
date: 20 Apr 2025
slug:raindrop-attention

A Blog post by Ksenia Se on Hugging Face

Compute costs scale with the square of the input size. That’s not great.
A deep dive into absolute, relative, and rotary positional embeddings with code examples
Deep learning architectures have revolutionized the field of artificial intelligence, offering innovative solutions for complex problems across various domains, including computer vision, natural language processing, speech recognition, and generative models. This article explores some of the most influential deep learning architectures: Convolutional Neural Networks (CNNs), Recurrent Neural Networks (RNNs), Generative Adversarial Networks (GANs), Transformers, and Encoder-Decoder architectures, highlighting their unique features, applications, and how they compare against each other. Convolutional Neural Networks (CNNs) CNNs are specialized deep neural networks for processing data with a grid-like topology, such as images. A CNN automatically detects the important features without any human supervision.

Large language models do better at solving problems when they show their work. Researchers are beginning to understand why.
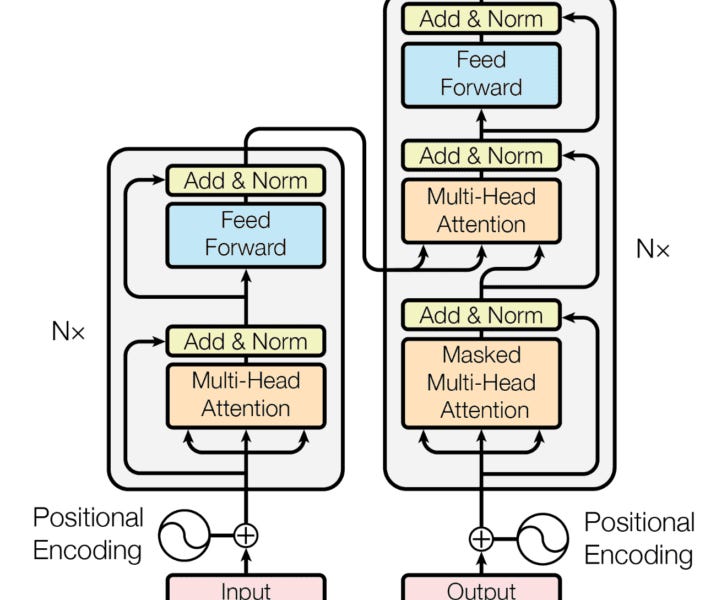
We will deep dive into understanding how transformer model work like BERT(Non-mathematical Explanation of course!). system design to use the transformer to build a Sentiment Analysis

Large Language Models (LLMs) have gained significant prominence in modern machine learning, largely due to the attention mechanism. This mechanism employs a sequence-to-sequence mapping to construct context-aware token representations. Traditionally, attention relies on the softmax function (SoftmaxAttn) to generate token representations as data-dependent convex combinations of values. However, despite its widespread adoption and effectiveness, SoftmaxAttn faces several challenges. One key issue is the tendency of the softmax function to concentrate attention on a limited number of features, potentially overlooking other informative aspects of the input data. Also, the application of SoftmaxAttn necessitates a row-wise reduction along the input sequence length,
-->
pricing/collusion
categories:
tags: collusion pricing prodmgmt
date: 20 Apr 2025
slug:pricing-collusion
Our paper, Beyond Human Intervention: Algorithmic Collusion through Multi-Agent Learning Strategies, with Suzie Grondin and Philipp Ratz is now available online Collusion in market pricing is a concept associated with human actions to raise market prices through artificially limited supply. Recently, the idea of algorithmic collusion was put forward, where the human action in the … Continue reading Beyond Human Intervention: Algorithmic Collusion through Multi-Agent Learning Strategies →
-->
execution/onboarding
categories:
tags: execution onboarding
date: 20 Apr 2025
slug:onboarding-shopify

Superhuman became known for its unique approach to onboarding: a highly-personalized, white-glove, human-led experience. Superhuman's Gaurav Vohra, startup advisor and growth leader, gives us a detailed look at how he built and scaled the program.
Onboarding can be a well-documented, up-to-date, repeatable process that helps new hires become productive quickly without having to ask so many questions.

Anna Binder, Asana's Head of People and the company's first HR hire, shares her step-by-step approach to intentionally building the company culture.

Customer retention begins at onboarding, so use these metrics to help you track the success of your customer onboarding processes.

Starting a new job can be stressful so I've developed an algorithm that has helped me get up to speed quickly.

Learn everything you need to know about creating an effective welcome email in these 17 examples. Read more.
Web magazine about user experience matters, providing insights and inspiration for the user experience community

Because I’m not good enough to wing it.

I’m now six months into Shopify. So far it’s going basically on schedule: as I was told, “Your first couple months you’re going to have zero idea what’s going on. Then around month three you’ll com…

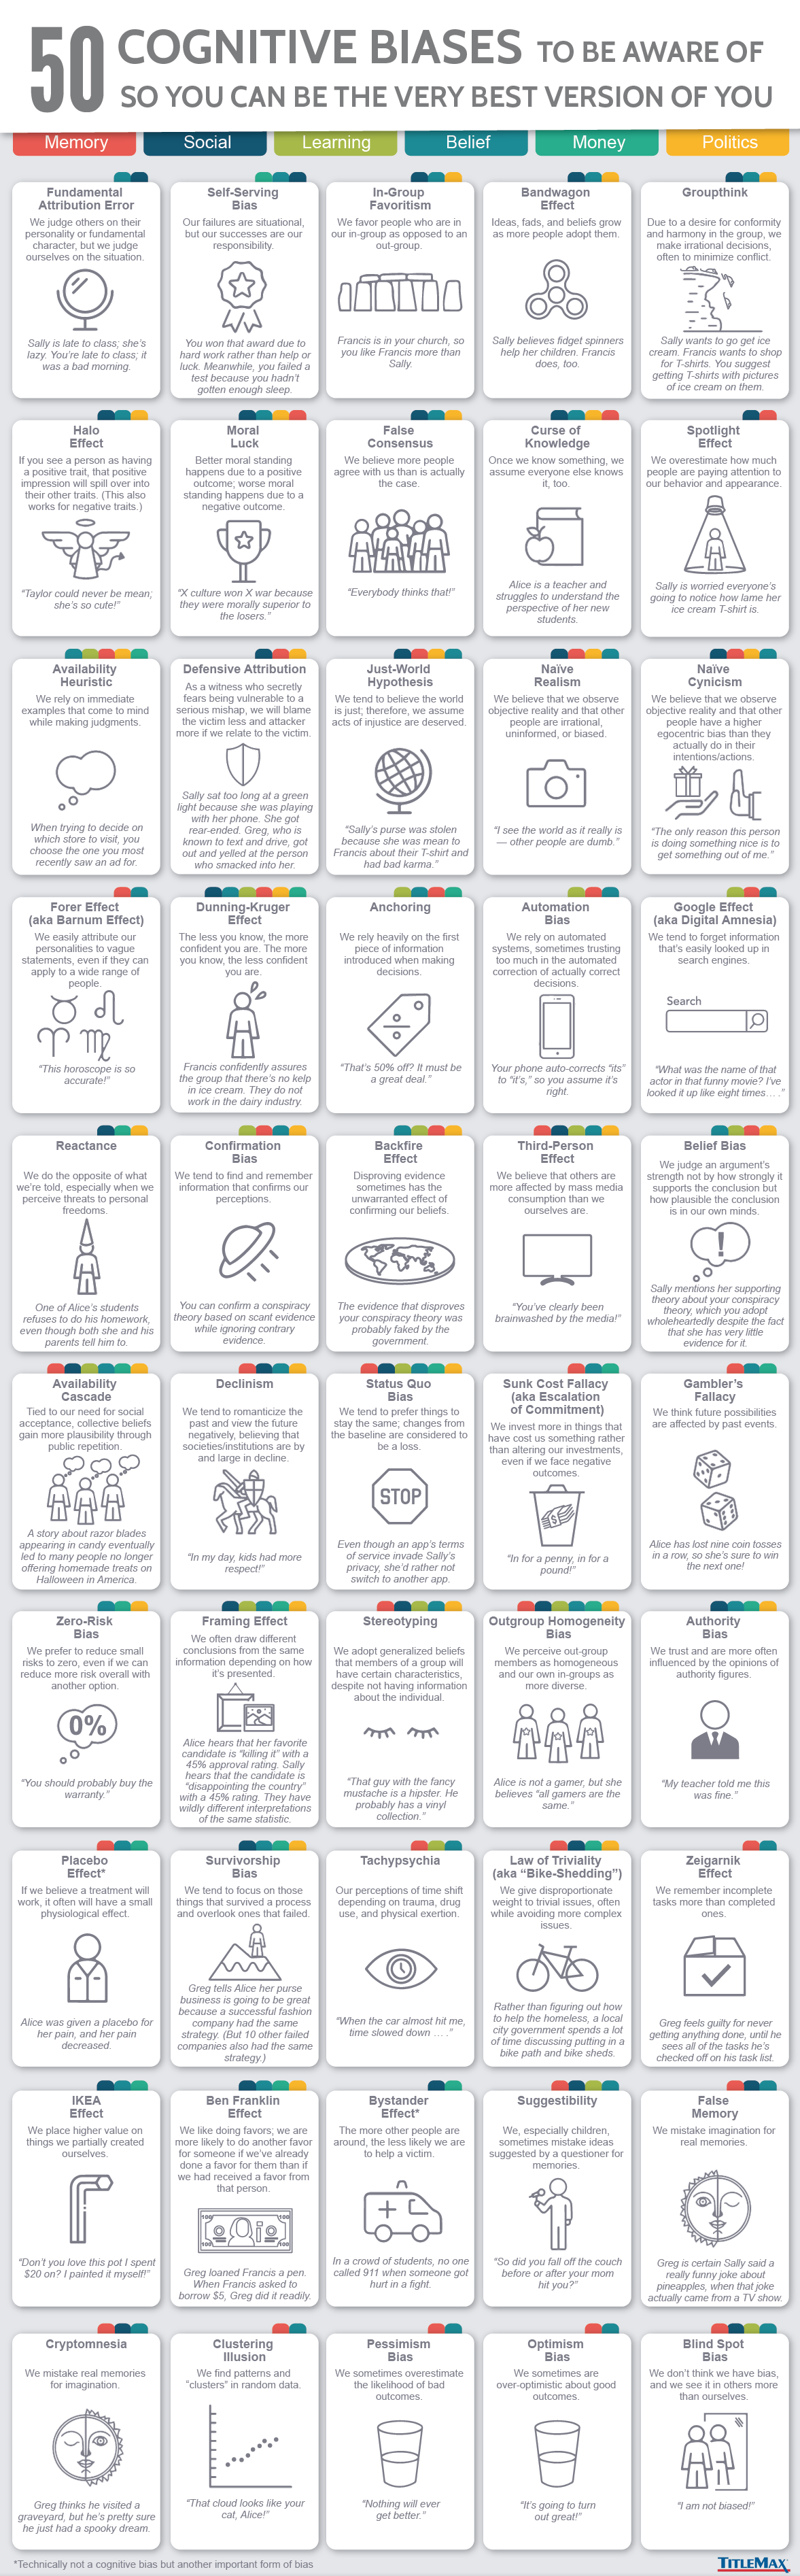
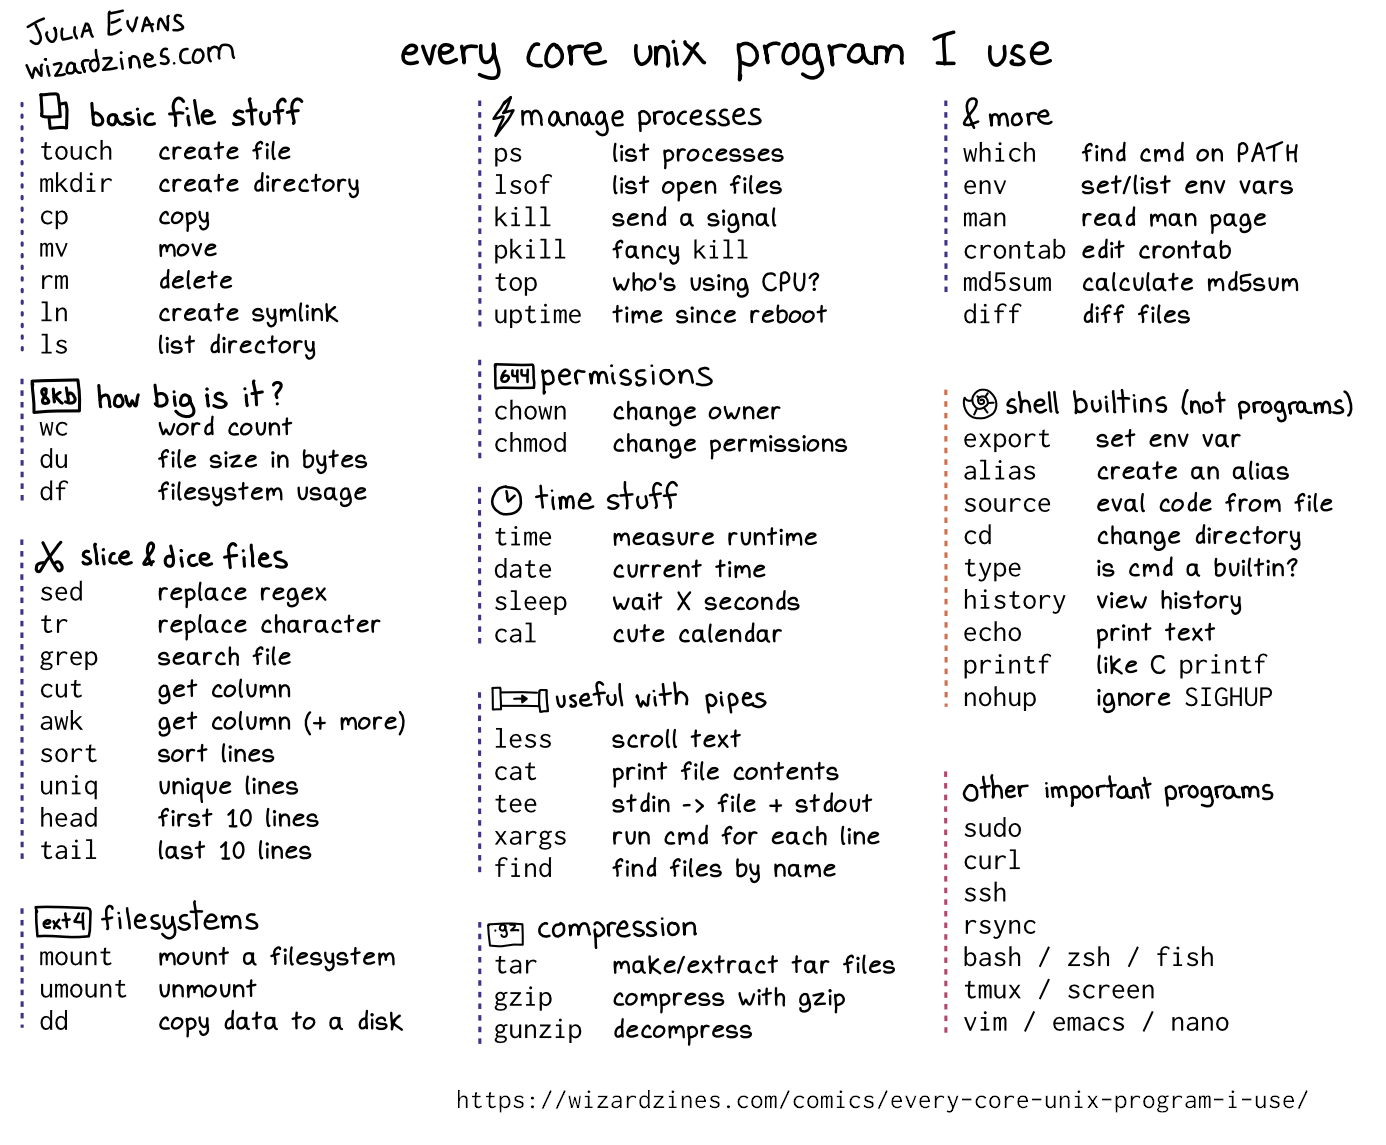
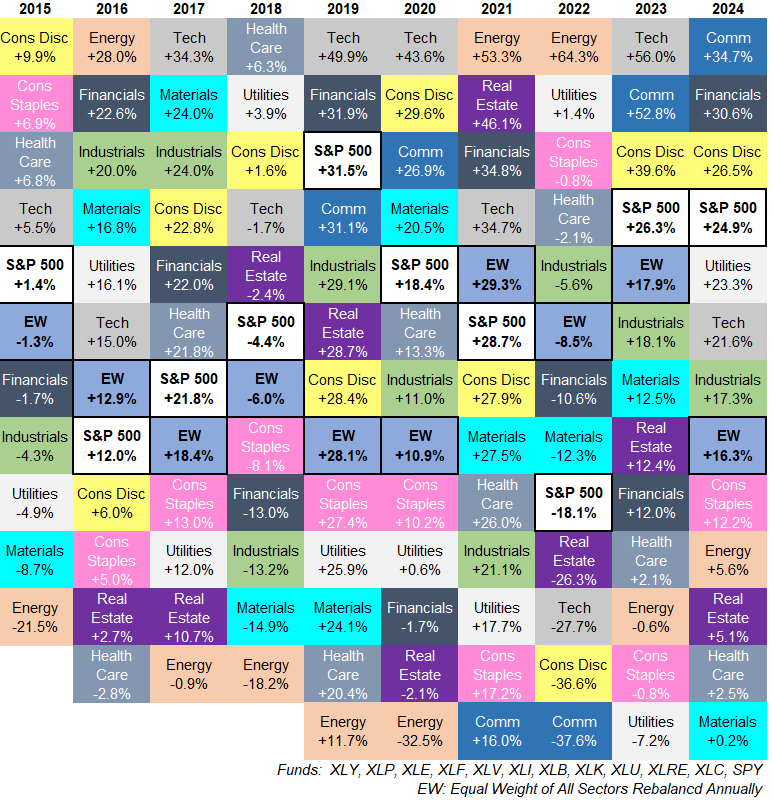
Welcome to the largest collection of Product-Led Growth articles, videos, and podcasts all in one place. Whether you're looking for advice on product-led growth, sales, marketing or onboarding, we have it all. Let's turn your product into a powerful growth engine today.

Employee onboarding is a critical moment when new hires begin integrating into the culture and workflows of their new company.
The “traditional” user onboarding flows and walkthroughs are dead. Learn about the next era of user onboarding and how to adapt to the changes in your org.

The ideal onboarding path is an easy and frictionless path to finding value. But some products include irreducible complexity – so here are 5 techniques that help to create the magic of a consumer onboarding flow in a complex product with considered actions.

Want to get the most out of your first month as a product manager? Want your new hire to hit the ground running? Here's our best practices.
-->
llm articles
categories:
tags: llms
date: 22 Apr 2025
slug:raindrop-llms
-->
math
categories:
tags: math-algorithms
date: 01 May 2025
slug:raindrop-math
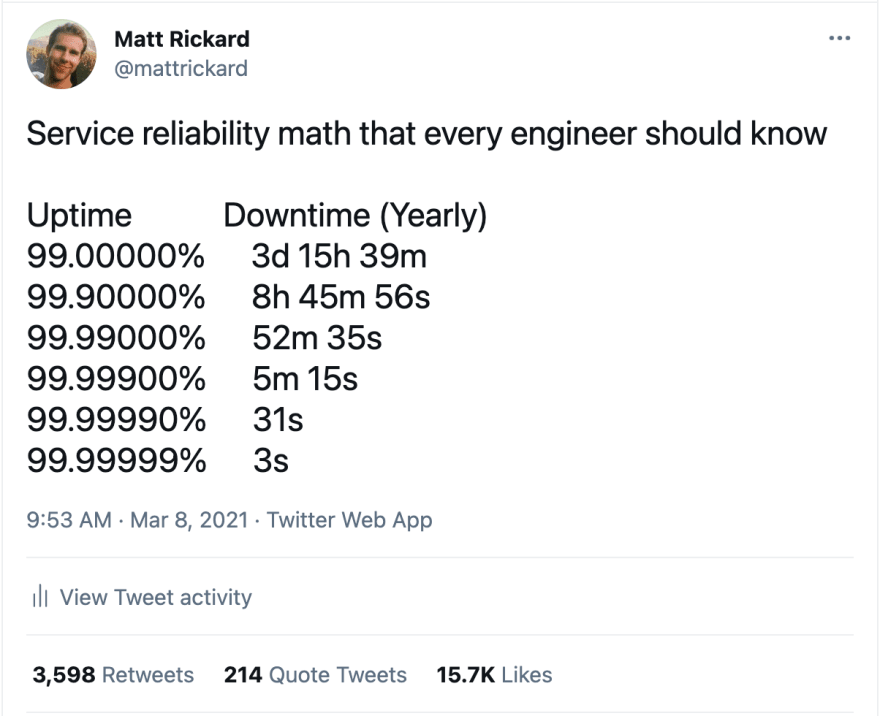
-->
behaviors / behave booknotes
categories:
tags: booknotes military-warfare
date: 06 May 2025
slug:test3
36 tactics of Chinese generals - booknotes
categories:
tags: booknotes military-warfare
date: 06 May 2025
slug:test2
warfare / 33 strategies - booknotes
categories:
tags: booknotes military-warfare
date: 06 May 2025
slug:test
behavior / coup d'etats - booknotes
categories:
tags: booknotes military-warfare
date: 08 May 2025
slug:test4-coupdetat