Dot Product in Linear Algebra for Data Science using Python
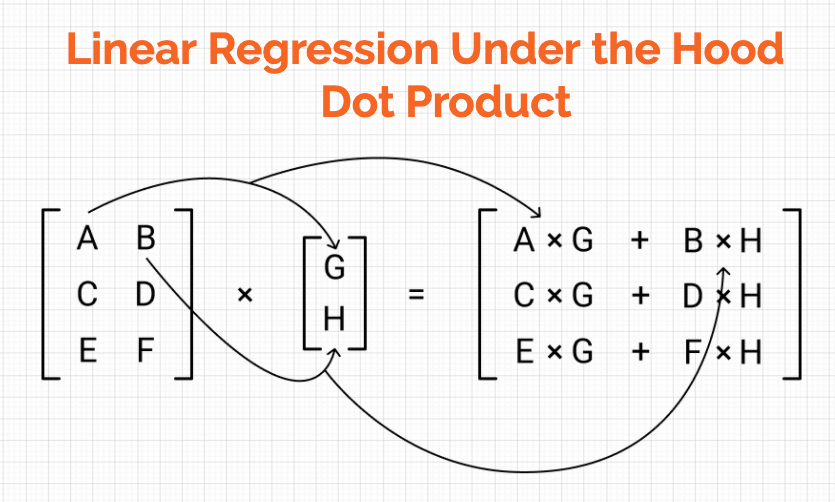
Building up the intuition for how matrices help to solve a system of linear equations and thus regressions problems
Building up the intuition for how matrices help to solve a system of linear equations and thus regressions problems
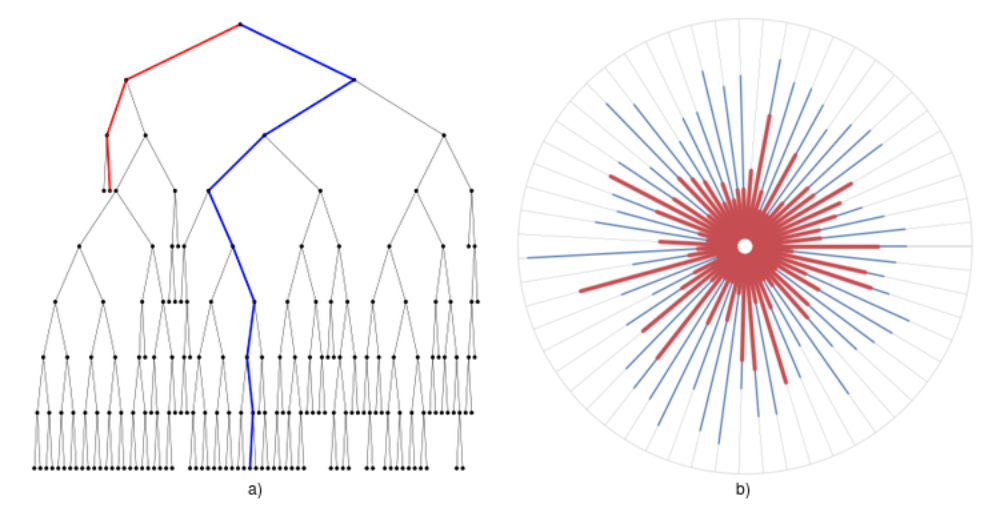
Implementation of Isolation forest from scratch for further understanding of the algorithm
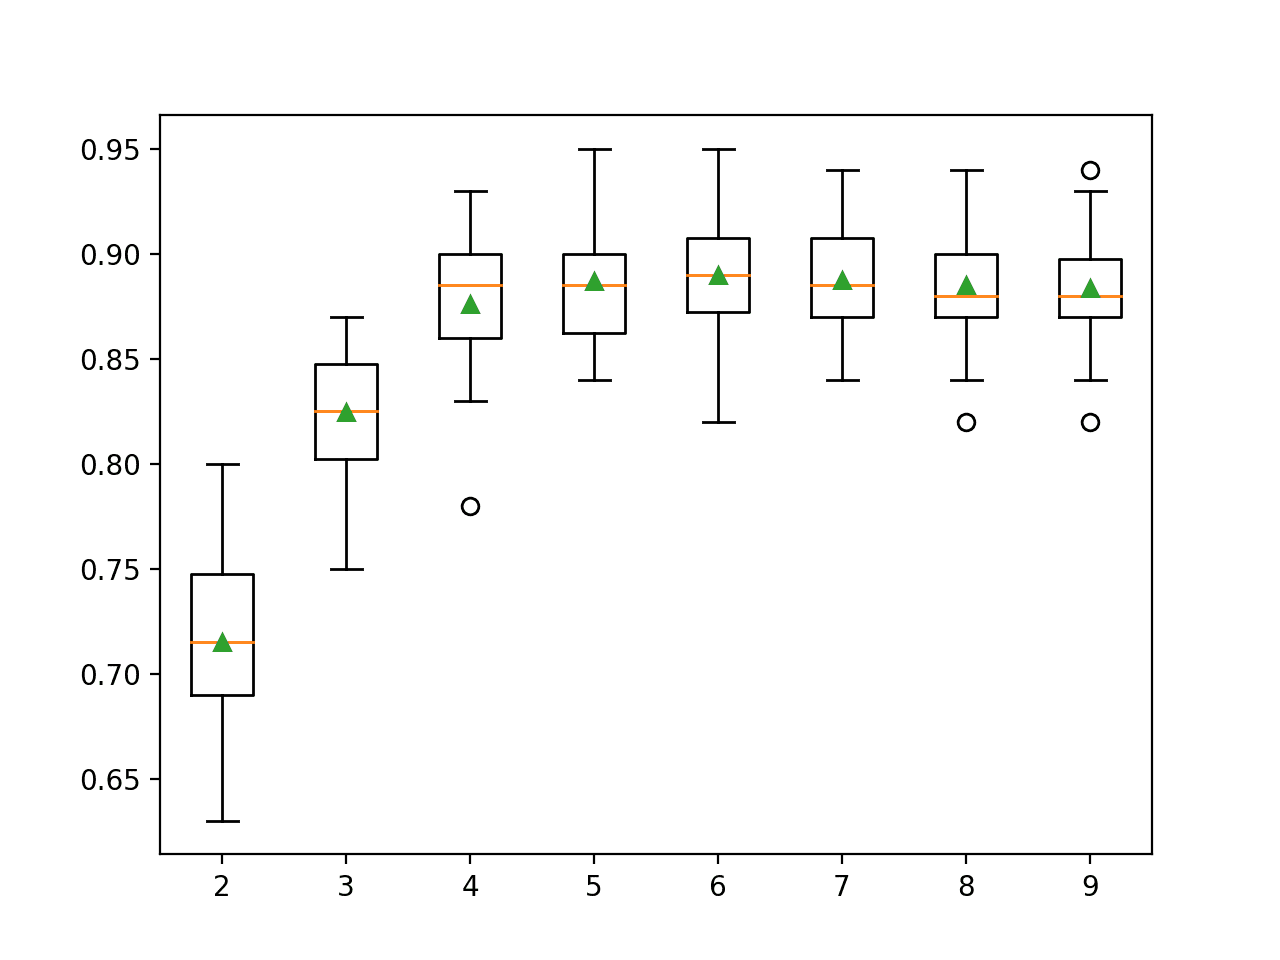
Recursive Feature Elimination, or RFE for short, is a popular feature selection algorithm. RFE is popular because it is easy to configure and use and because it is effective at selecting those features (columns) in a training dataset that are more or most relevant in predicting…

Explaining outlier detection with PyCaret library in python

Isotonic regression is a method for obtaining a monotonic fit for 1-dimensional data. Let’s say we have data such that . (We assume no ties among the ‘s for simplicity.) Informally, isotonic regression looks for such that the ‘s approximate … Continue reading →

Case study of tweets from comments on Indonesia’s biggest media
Yet another tool used to make Decision Tree splits.

Overview of deploying a model with the Chef — A Configuration Management Tool

Often, the input features for a predictive modeling task interact in unexpected and often nonlinear ways. These interactions can be identified and modeled by a learning algorithm. Another approach is to engineer new features that expose these interactions and see if they improve…

New method reduces training time by up to 99%, with no loss in accuracy.
Do Asian currencies move in tandem? What about emerging markets in general? Are commodity currencies like AUD and CAD closely related as…

An overview of the fundamentals behind measuring and comparing machine learning solutions

Dimensionality Reduction using t-SNE in a nutshell

Methods to encode categorical variables using Python
An elegant method to group predictions without labeling

Amazon researchers describe a machine learning system that plans the movements and paths of up to 1,000 mobile warehouse robots.
DataGene - Identify How Similar TS Datasets Are to One Another (by @firmai) - firmai/datagene

How to create time series datasets with different patterns
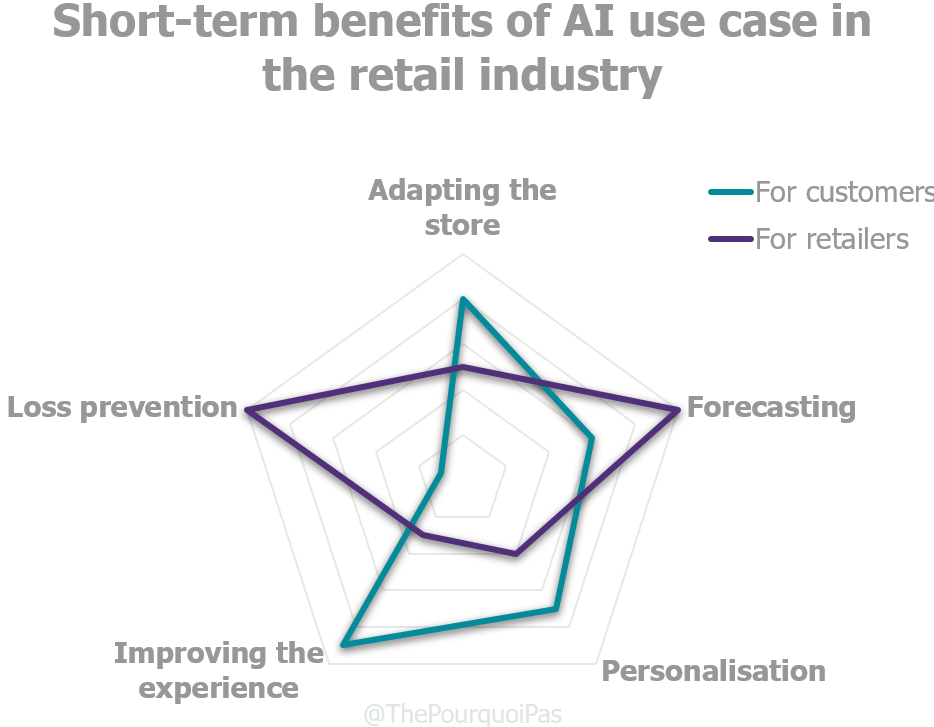
The stores aren’t dead yet

How and why we built a custom app for visual debugging of warehouse pick paths.

Qualcomm open sources the AI Model Efficiency Toolkit on GitHub, providing a simple library plugin for AI developers.
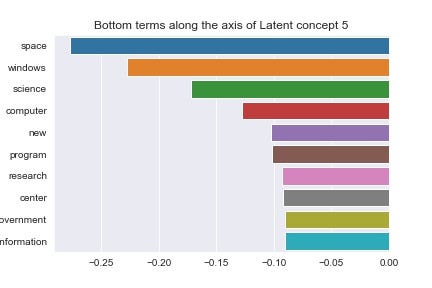
TL;DR — Text data suffers heavily from high-dimensionality. Latent Semantic Analysis (LSA) is a popular, dimensionality-reduction…
Deep dive into spatial autocorrelation and their industry use cases
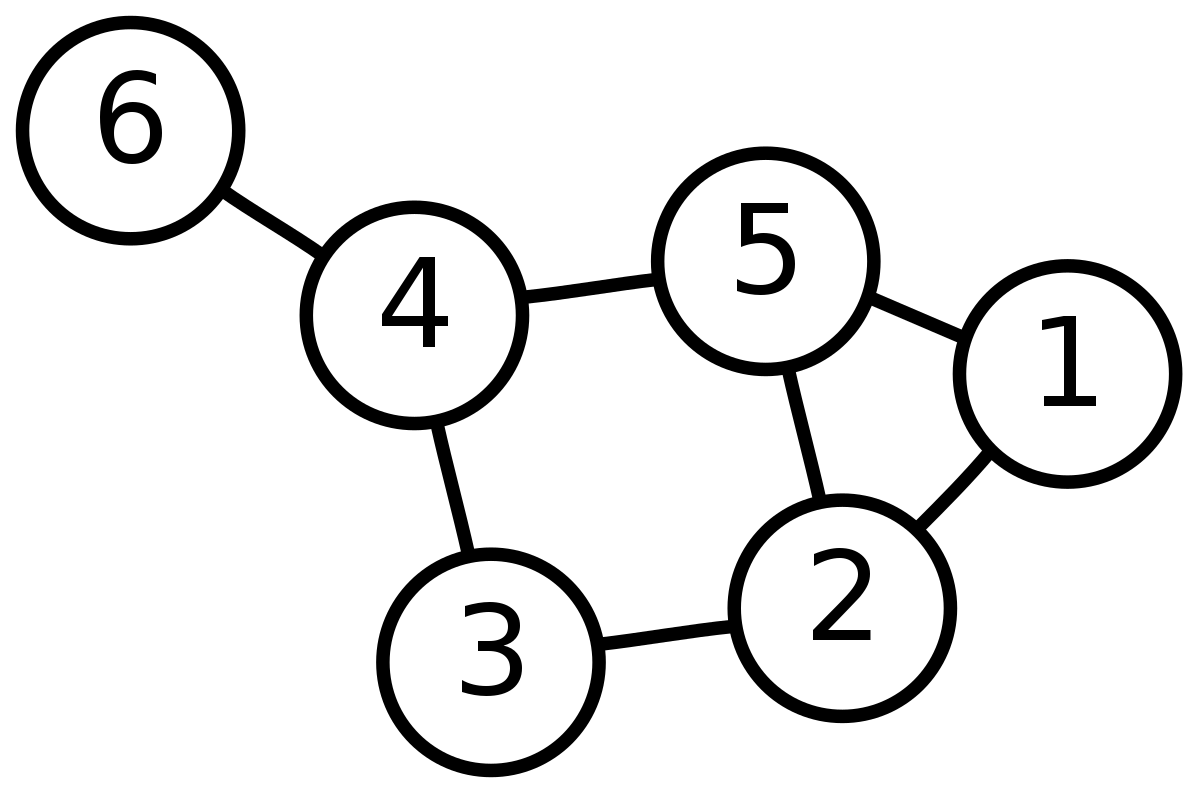
Graph Theory is the study of graphs which are mathematical structures used to model pairwise relations between objects. These graphs are…
This new Python package accelerates notebook-based machine learning experimentation
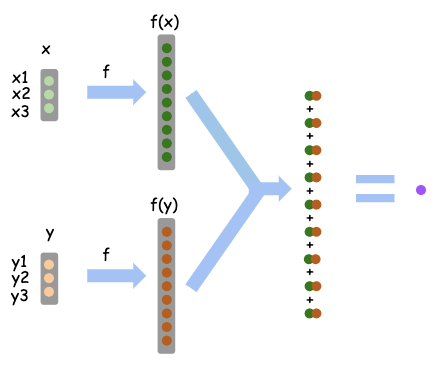
We will walk through a simple example with basic arithmetics to demystify the concept of kernel.
A Comparison of Naive Bayes and Logistic Regression
Using q-learning for sequential decision making and therefore learning to play a simple game.
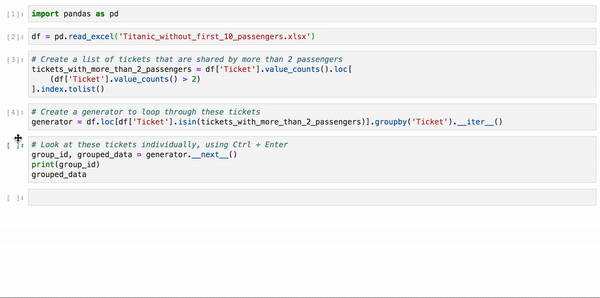
Pandas is the go-to library for data science. These are the shortcuts I use to do repetitive data science tasks faster and simpler.
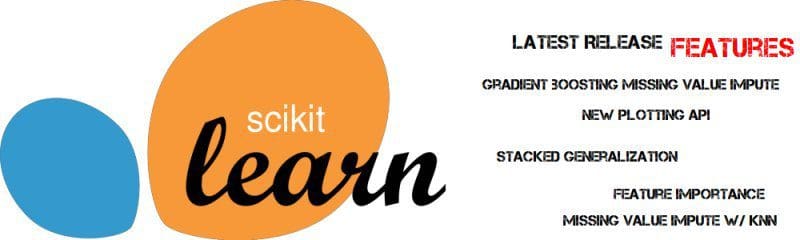
From not sweating missing values, to determining feature importance for any estimator, to support for stacking, and a new plotting API, here are 5 new features of the latest release of Scikit-learn which deserve your attention.
I came across Pycaret while I was browsing on a slack for data scientists. It's a versatile library in which you can apply/evaluate/tune…

In this blog, you will get an intuition behind the use of cross-entropy and log-loss in machine learning.
Deploy, scale and manage your machine learning services with Kubernetes and Terraform on GCP.

Learn about SVM or Support Vector Machine, Kernel Trick, Hyperplanes, Lagrange Multipliers using visual examples and code sections.

and how to train and deploy an ML model into production with them.
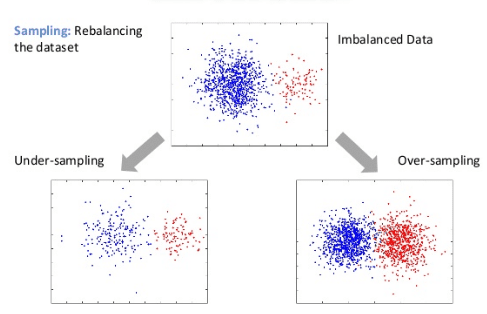
Consider a problem where you are working on a machine learning classification problem. You get an accuracy of 98% and you are very happy. But that happiness doesn’t last long when you look at the confusion matrix and realize that majority class is 98% of the total data and all…
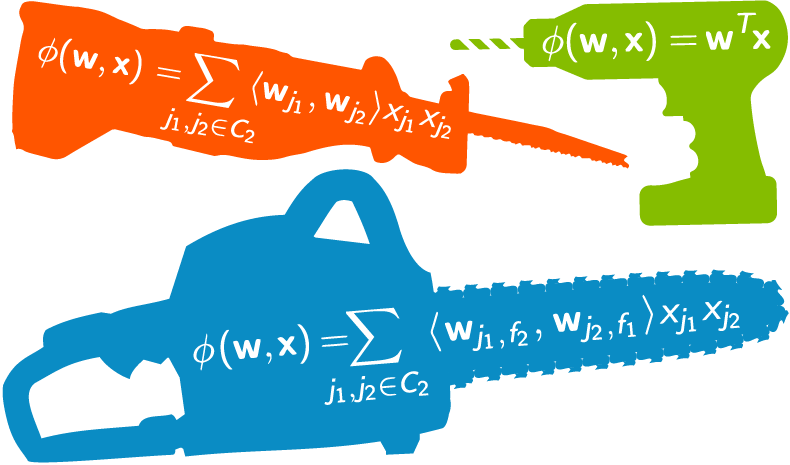
originally posted by the author on Linkedin : Link It is very tempting for data science practitioners to opt for the best known algorithms for a given problem.However It’s not the algorithm alone , which can provide the best solution ; Model built on carefully engineered and…

How to control the complexity of a model

A walkthrough of some of Netflix’s interview questions!
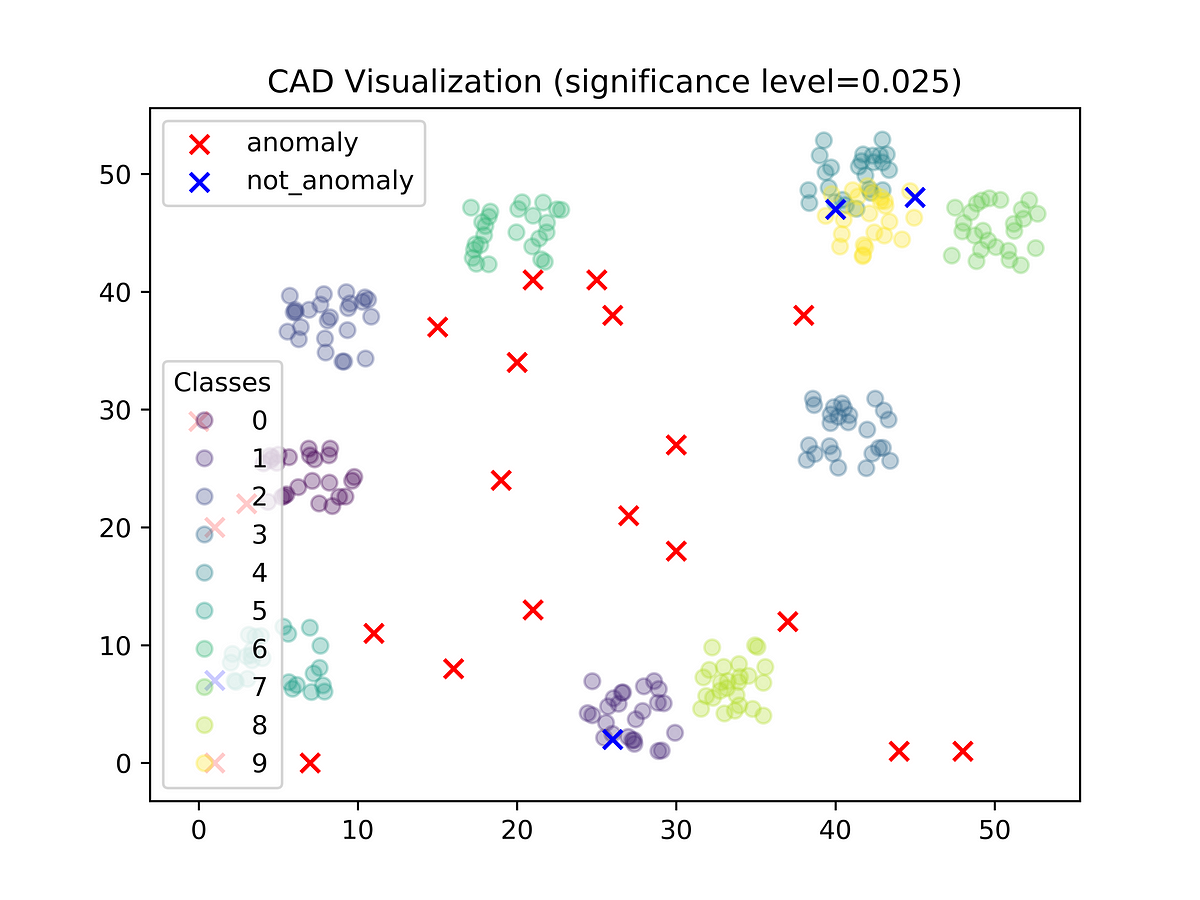
Weird data is important. Often in data science, the goal is to discover trends in the data. However, consider doctors looking at images of…

In-depth Interview Q&A from Facebook, Amazon, Apple, Netflix, and Google

This post is the last in our series of 5 blog posts highlighting use case presentations from the 2nd Edition of Seville Machine Learning School (MLSEV). You may also check out the previous posts ab…
Lambdaclass's blog about distributed systems, machine learning, compilers, operating systems, security and cryptography.
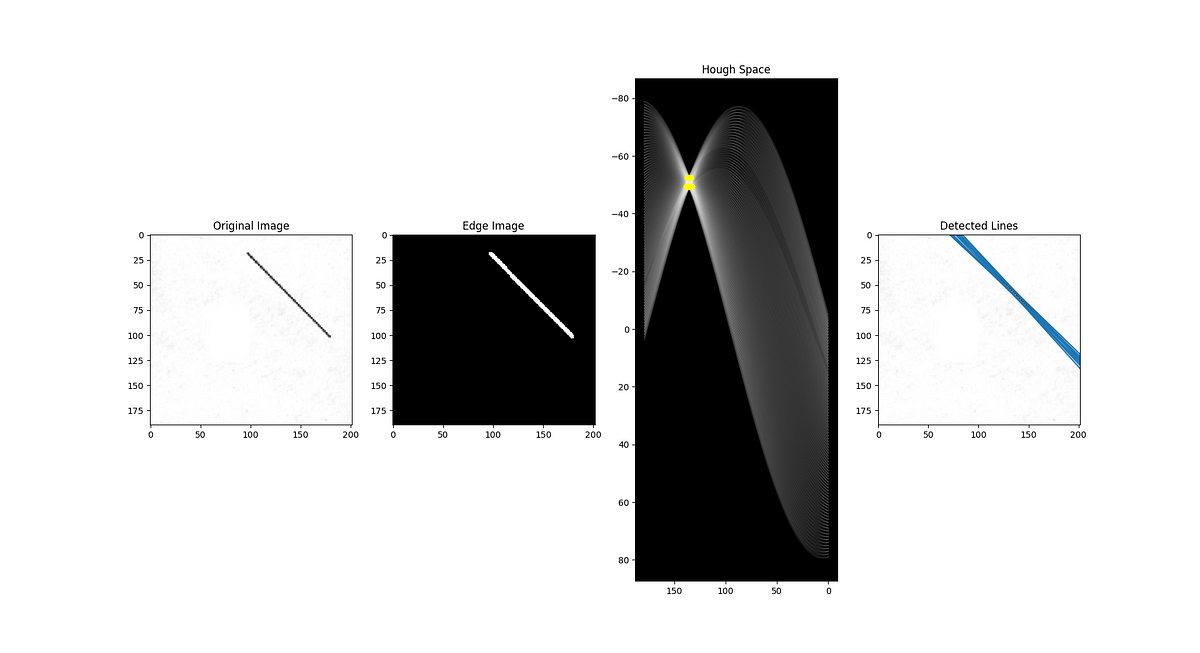
An algorithm to find lines in images

A detailed step-by-step guide to build a Lane Line Detection algorithm in OpenCV.
Why do we need Stochastic, Batch, and Mini Batch Gradient Descent when implementing Deep Neural Networks?
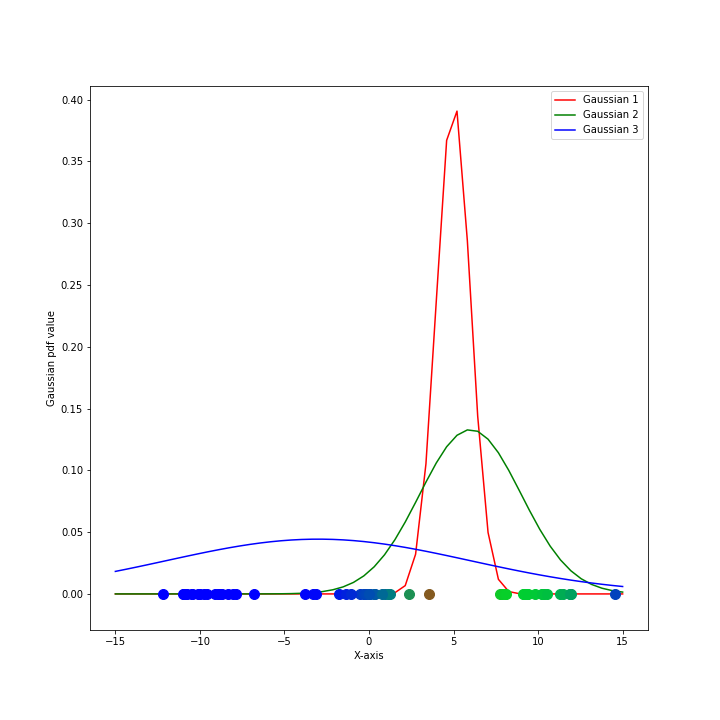
Understanding GMM: Idea, Maths, EM algorithm & python implementation

Introduction on Stacked Auto-encoder and Technical Walk-through on Model Creation using Pytorch